Eastern Anatolian Journal of Science
Volume II, Issue I, 37-48 Eastern Anatolian Journal of Science
Abstract Abstract
The focal mechanisms of the small-moderate earthquakes occurring in the brittle part of the crust are the expression of the present regional stress field and how these stresses act on existing structures in the crust. Especially for the middle and lower crust, for which borehole measurements are not possible, the analysis of focal mechanisms is the only tool for in-situ stress measurements. For this reason, the focal mechanisms of the 2007-2008 earthquakes (23 earthquakes) are obtained from both first motion analysis of vertical P waves (4 earthquakes) and time domain regional body waveforms inversion (19 earthquakes). Using other sources in total 37 earthquake focal mechanisms were obtained to determine active tectonics and the present-day stress field in the Bala-Ankara region. The focal mechanism of the analyzed earthquakes occurred in the Bala-Ankara region obtained both from first motion analysis and time domain moment tensor analysis indicate that the predominant earthquake mechanism is the strike-slip mechanism. All earthquakes occur at shallow depths. Only two events occur at 26 km and 36 km depths. The slip rate is calculated as 0.83 mm/year. The state of recent stress and ongoing deformation in Bala-Ankara region is primarily controlled by the north-northwest drift of the African and Arabian plates respectively. In terms of stress orientations, the Bala-Ankara region is affected by stresses with a general NW-SE orientation of horizontal maximum principal axis (SHmaxN169oE) and NE-SW orientation of minimum principal axis (SHminN79oE). However, the extensional features (a few normal faulting focal mechanisms) are observed and these features reflect local stress inhomogeneous compared to the regional stress which is strike-slip.
Keywords: Focal Mechanism, Stress Analysis, Central Anatolia, Bala, Ankara, Turkey.
Accepted Date: 08.04.2016 Corresponding author: Tahir Serkan Irmak, PhD
Kocaeli University, Department of Geophysical Engineering, Seismology Section, 41100, Kocaeli, Turkey
E-mail: [email protected]
number= 223501; Figure 2).
1. Introduction
The tectonic framework of Turkey is dominated by continental collision of the Eurasian and African plates with Eurasia as shown in Figure 1 (MCKENZIE, 1972; JACKSON and MCKENZIE, 1984). The Arabian plate is moving in a north-northwest direction relative to Eurasia at a rate of about 18 mm/yr (MCCLUSKY et al. 2000), averaged over about 3 My based on analysis of global seafloor spreading, fault systems, and earthquake slip vectors. These models also indicate that the African Plate is moving in a northly direction relative to Eurasia at a rate of about 6 mm/yr (MCCLUSKY et al. 2000). Different motions between Africa and Arabia (~ 8-15 mm/yr) are thought to be taken up predominantly by the left-lateral motion along the Dead Sea transform fault. This northward motion results in westward extrusion of the Anatolian Plate (AP). The western part of the AP shows a transition to the Aegean extensional system (AES). The central part of the AP, which the Bala-Ankara region is located there, does not host major faults, and the deformation is seen as internal deformation (ŞENGÖR and YILMAZ, 1981; REILINGER et al. 1997; MCCLUSKY et al. 2000; TAN et al. 2010). Internal deformation includes neotectonic secondary strike-slip faults and extensional basins (BOZKURT, 2001). KOÇYİĞİT and DEVECİ (2008) and KOÇYİĞİT (2009) reported that the direction of compression in the Bala-Ankara region was NW – SE until late Pliocene. The neotectonic regime was initiated controlled by active strike-slip faulting caused by approximately N – S compression. The right and left lateral strike slip faults trend NW – SE and NE – SW, respectively (Fig. 1). The most important structure is the Tuz Gölü Fault Zone (TGFZ) with a mapped length of about 200 km (BEEKMAN, 1966; KOÇYİĞİT and BEYHAN, 1988; ÇEMEN et al, 1999). GÖRÜR et al. (1984) point out that the TGFZ has been active since the Oligocene. There is no reliable historical earthquake information for this area. Also, there is no reliable instrumental period earthquake information until 2005. The 2005 Bala-Ankara earthquake sequence is the first seismic signature well recorded in the instrumental period which is followed by the 2007-2008 earthquake sequence. Both
Present-Day Stress Field in the Bala – Ankara (Turkey) Region from Inversion of Focal
Mechanisms
TAHİR SERKAN IRMAK1,*
1
Kocaeli University, Department of Geophysical Engineering, Seismology Section, 41100, Kocaeli, Turkey
38 Tahir Serkan Irmak Vol. II, Issue I, 2016
earthquake sequences are studied by several researchers (ÖZTÜRK and BAYRAK, 2006; KALAFAT et al. 2008; KOÇYİĞİT, 2009; TAN et al. 2010; KORHAN et al. 2011). Central Anatolia in Turkey is known as a quiet area in terms of seicmicity. The seismicity is characterized by diffused small and moderate earthquakes. Also, numbers of installed stations are less than western part of Turkey resulted less number of recorded earthquakes. Therefore, identification of active fault planes and obtaining detail seismotectonic structures for the area are generally difficult. Such an areas of low-to-moderate seismicity, the small-moderate earthquakes provide the only key to determine fault parameters and small-scale tectonic structure. The focal mechanisms or fault plane solutions of the small-moderate earthquakes occurring in the brittle part of the crust are expression of the present regional stress field and how these stresses act on existing structures in the crust. Thereby, inversions of ensembles of fault plane solutions are useful to constrain the tectonic stress field and allow implications on dynamic processes and on tectonic evolution. Especially for the middle and lower crust, for which borehole measurements are not possible, the analysis of focal mechanisms is only tool for in-situ stress measurements. For this reason, the focal mechanisms of the 2007-2008 earthquakes (23 earthquakes) are obtained from both first motion analysis of vertical P waves (4 earthquakes) and time domain regional body waveforms inversion (19 earthquakes). The focal mechanisms of the 2005 earthquake sequence and data belongs to other instrumental period earthquakes (14 earthquakes) are retrieved from Kalafat et al. (2009) and Tan et al. (2010), respectively. Total 37 earthquake focal mechanisms were obtained to determine active tectonics and the present-day stress field in the Bala-Ankara region. The seismic moments which are obtained from time domain regional waveform analysis are used to determine slip rates for the Bala-Ankara region.
In the simplest approach, P, B and T axes of earthquake focal mechanisms are equated to principal stress axes σ1, σ2, and σ3. In general, if there are pre-existing zones of weakness on which slip occurs, the principal stress axes may not be close to the P, B, and T axes (RALEIGH et al. 1972). MCKENZIE (1969) considered this possibility and showed that the axis of maximum compression may fall anywhere within the dilatational field of the focal mechanism. In such cases, only the direction of resolved shear stress on the fault plane, as indicated by the slip direction, can be used to constrain the stresses. There are many inversion methods in the literature developed to
determine the regional stress tensor from an ensemble of earthquake fault plane solutions (e.g. ANGELIER, 1979; ANGELIER et al. 1982; GEPHART and FORSTYH, 1984; MICHAEL, 1984; CAREY-GAILHARDIS and MERCIER, 1987; RECHES, 1987; RIVERA and CISTERNAS, 1990; DELVAUX, 1993; DELVAUX and SPENCER, 2003; IRMAK, 2013; DOĞAN et al., 2016). The inversion method of DELVAUX and SPENCER (2003) was applied to earthquake focal mechanism in this study.
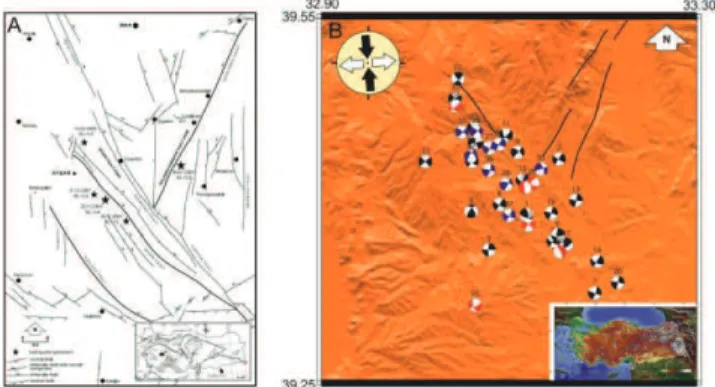
Figure 1A. Inner picture: Simplified map of the tectonics structures in Turkey. The black arrows indicate the motion
of the plates. AES: Aegean Extensional System, EAFS: East Anatolian Fault Zone, CAFS– Central Anatolian Fault
System, İAESZ– İzmir-Ankara-Erzincan Suture Zone, İEFS– İnonu-Eskişehir Fault System, GV– Galatya volcanics, KOF– Karataş-Osmaniye Fault, NAFS– North Anatolian Fault System, SC– Sakarya Continent, TGFZ– Tuz Golu Fault Zone. Modified from Tan et al. (2010). Outer picture: Simplified fault map of the Bala (Ankara) area and its surroundings (modified from Kocyiğit 2009). B.
Focal mechanisms of studied earthquakes in the Bala-Ankara region. The numbers above the beachballs show
event no in Table 1.
2. Data and Methods
Waveform data used in this study were recorded by the Kandilli Observatory and Earthquake Research Institute Seismogical Network. The number of digital broadband stations operated by the National Earthquake Monitoring Center of The Kandilli Observatory and Earthquake Research Institute (NEMC-KOERI) has been increasing since the devastating Kocaeli earthquake of August 17, 1999 in Turkey (IRMAK, 2000). Therefore, nowadays it is possible to obtain reliable fault plane solutions for any area of Turkey using waveform inversion techniques. Digital data sets have been available since 2004 and accessible via the internet provided by the NEMC-KOERI data center.
Vol. II, Issue I, 2016 Present-Day Stress Field in the Bala – Ankara (Turkey) Region 39 from Inversion of Focal Mechanisms
2.1 First Motion Analysis
The fault plane solutions were calculated by utilizing P-polarities on vertical component seismograms running the focmec programs (SNOKE et al., 1984) for the analyzed earthquakes. All available polarities from national seismic stations were carefully read. The number of stations with unambiguous first arrival polarities varies from earthquake to earthquake, but events with fewer than 10 clear polarity readings were discarded, as were those with ambiguous polarities. The P-waves were converted to displacement in order to see the P-wave onsets better due to low S/N ratio. Assuming the double-couple model for the seismic point source, P polarities on displacement seismograms were then read. The possible nodal planes which agree with the first motion polarities were searched, running the focmec program (SNOKE et al., 1984). Polarity errors could be caused by low S/N ratio at stations near nodal planes, so called 'mislocations', or structural heterogeneity, biasing calculation of azimuth and take off angle and aliasing effects (SCHERBAUM, 1994). However, no polarity error was allowed in the solutions. Events with multiple acceptable solutions, indicating different mechanism, or with faulting parameters uncertainties exceeding 20°, were not reported in this study.
2.2. Time Domain Moment Tensor Analysis
Moment tensor analysis theory involves fitting theoretical waveforms with observed broadband waveforms and inverting for the moment tensor elements. A time-domain inverse procedure (e.g., DREGER and ROMANOWICZ, 1994; PASYANOS et al., 1996) was used to estimate the seismic moment tensor of events listed in Table 1. This procedure is designed to obtain reliable solutions using a minimal number of stations. Data from one three-component station would be sufficient, but a few stations with some azimuthal coverage generally give more reliable results. Typically only two or three three-component broadband stations are required to obtain a unique solution (DREGER and HELMBERGER 1993).
In this procedure, the general representation of seismic sources is simplified by considering both a spatial and temporal point-source.
Un (x,t) = Mij . Gni,j (x,z,t) (1)
Un, is the observed nth component of displacement, Gni,j is the nth component Green’s function for specific force-couple orientations, and Mij is the scalar seismic moment tensor, which describes the strength of the force-couples. The general force-couples for a deviatoric moment tensor may be represented by three fundamental-faults, namely a vertical strike-slip, a vertical dip-slip, and a 450 dip-slip. The indices i and j refer to geographical directions. The above equation is solved using linear least squares for a given source depth. In this distribution only the deviatoric seismic moment tensor is solved for, and the inversion yields the Mij which is decomposed into the scalar seismic moment, a double-couple moment tensor and a compensated linear vector dipole moment tensor. The decomposition is represented as percent double-couple (Pdc) and percent CLVD (PCLVD). Percent isotropic (PISO) is always zero for this deviatoric application. The double-couple is further represented in terms of the strike, rake and dip of the two nodal planes. The basic methodology and the decomposition of the seismic moment tensor is described in JOST and HERRMANN (1989).
Source depth is found iteratively by finding the solution that yields the largest variance reduction. The results of the moment tensor inversion are generally not very sensitive to location errors. DREGER and HELMBERGER (1993) and also PASYANOS et al. (1996) have shown that errors of up to 15 km in epicenter location are less important at a distance range 50 – 400 km.
It is assumed that the event location is well represented by the high frequency hypocentral location, and a low frequency centroid location is not determined. Second, the simplified representation above assumes that the source time history is synchronous for all of the moment tensor elements and that it may be approximated by a delta function delta since the events used in this study generally have source durations of 2–3 s (ML < 5) (DREGER, 2003).
Preparation of the observed waveforms is a relatively straightforward process involving several steps, which include: 1) removal of the instrument response, 2) rotation of the horizontal components to radial and transverse components, 3) integration to convert to displacement, 4) bandpass filtering: accordingly, 3.5<ML<4.0 correspond to the frequency band 0.02-0.1 Hz; 4.0<ML<5.0 to 0.02-0.05 Hz; and ML>5.0 0.01-0.05 Hz, and 5) resampling the data to 2 Hz to match the Green’s functions. The Green’s functions are also filtered with the same bandpass filter as the observed data.
40 Tahir Serkan Irmak Vol. II, Issue I, 2016
The quality of the inversion can be controlled by different functions. For instance, a value of 100 of the Variance Reduction means observed and calculated seismograms are identical. Furthermore, the resulting tensor can be decomposed into a double-couple (DC) and a CLVD. The percentage of DC (JOST and HERRMANN, 1989) shows how well the model complies with a double-couple source. However, note that any CLVD contribution is an artifact of the present inversion scheme and indicates influences of structural complexities not considered in the calculation of the Green’s functions, source complexities, location errors (depth), etc.
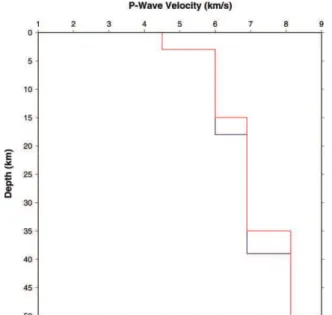
Green’s functions were calculated following a modified Haskell algorithm in the frequency–wavenumber domain (SAIKA, 1994). The formulation uses the three basic focal mechanisms (LANGSTON, 1981; HERRMANN and WANG, 1985). Far field and near field terms are both considered by this algorithm. The sampling rate was fixed at 2 Hz. The most important step for the regional moment tensor analysis is developed accurate 1-D velocity model, due to calculate correct Green’s functions at regional distances. We used GÜVEN (1999) velocity model as a initial model and a trial and error method that gave the best fit between observed and calculated seismograms was used to adjust final velocity model (Figure 2).
Figure 2. Velocity Model for the Ankara region (modified from Guven, (1999). Blue line shows Guven (1999) model
and red is mofified model). Moho depth is 35 km.
2.3. Slip Rate
In this paper, BRUNE (1968) has been followed to calculate the slip rate along the study area. Seismic moments for the earthquakes are calculated from regional waveform inversion. The total average displacement for the whole length of the fault, then, can be calculated from
! " # $= %
&'(!)* (2)
where u is total average displacement, μ is rigidity, A0 is fault area and M0 is seismic moment.
2.4. Stress Inversion
To study the present day stress field for Bala – Ankara region the Win-Tensor program (the new Windows version of the TENSOR program) (DELVAUX and SPENCER, 2003) was performed. The program attempts rely on two major assumptions for the study region: (a) the stress field is uniform and invariant in space and in time, and (b) earthquake slip d occurs in the directions of maximum shear stress τ (Wallace-Bott hypothesis, BOTT, 1959). The angle between the calculated shear stress τ and slip vector d is the fit angle α. Thus, the corresponding misfit function to be minimized for each earthquake i is the misfit angle α:
+,-. = /,-. (3)
The orientation of the three orthogonal principal stress axes σ1, σ2 and σ3 (where σ1≥ σ2≥ σ3) and the stress ratio R:
0 = 1%2 1341%2 13 (4)
which expresses the magnitude of σ2 relative to the magnitude of σ1 and σ3.
The data were processed interactively, first using the “Right Dihedron Method”, a graphical method for determination of the range of possible orientations σ1 and σ3, which is independent from the choice of the nodal planes (ANGELIER and MECHLER, 1977). The initial result is used as a starting point for the iterative grid-search “Rotational Optimization” procedure using the misfit function F5 in the TENSOR program (describes as f3 in DELVAUX and SPENCER, 2003). It minimizes the misfit angle α (Eq.(3)) using the stress tensor that is being tested,
Vol. II, Issue I, 2016 Present-Day Stress Field in the Bala – Ankara (Turkey) Region 41 from Inversion of Focal Mechanisms
but also favours higher shear stress magnitudes |5,i.| and lower normal stress magnitudes |v,i.| on the plane in order to promote slip. It contains three terms and is implemented in a way that it ranges from 0 (optimal misfit) to 360 and is independent from the ratio 6346%. The first term that minimizes α is based on the function S4 of ANGELIER (1991):
+,-. = 7-89,/,-. :4 . (5)
and is dominant over the two others (see DELVAUX and SPENCER, 2003 for details).
First we invert both nodal planes for each focal mechanism to a stress tensor. Then the plane that is best explained by the stress tensor is selected from the two nodal planes (smaller value of function F5 in Tensor of f3 in DELVAUX and SPENCER, 2003) and considered as the actual fault (or focal) plane. After this separation, the final inversion then includes only the focal planes that are best fitted by a uniform stress field (GEPHART and FORSYTH, 1984).
In order to express numerically the stress regime, the stress regime index R’, based the value of the stress ratio (R, Eq. (4)) and the type of stress regime as described in DELVAUX et al. (1997) and DELVAUX and SPENCER (2003) was used. The tectonic stress regime index R’ is defined as:
R’ = R for normal faulting regimes (NF) R’ = (2 – R) for strike-slip regimes (SS) and R’ = (2 + R) for thrust faulting regimes (TF) It forms a continuous scale ranging from 0 to 1 for normal faulting regimes, from 1 to 2 for strike – slip regimes and from 2 to 3 for thrust regimes. The quality evaluation of the results was done using updated quality ranking system of the World Stress Map release 2008 (HEIDBACH et al. 2010). It evaluates the azimuthal accuracy of SHmax obtained from the formal inversion of N well-constrained single-event focal mechanisms with an average misfit angle α in close geographic proximity (FMF category):
· A – quality (SHmax/SHmin within ± 15o): N ≥ 15 and
α ≤ 12o
· B – quality (SHmax/SHmin within ± 15o – 20o): 8 ≤ N ≤ 15 and α ≤ 20o (6)
· C – quality (SHmax/SHmin within ± 20o – 25o): not defined for FMF category as individual focal mechanism is assessed to C – quality.
3. Results and Discussions
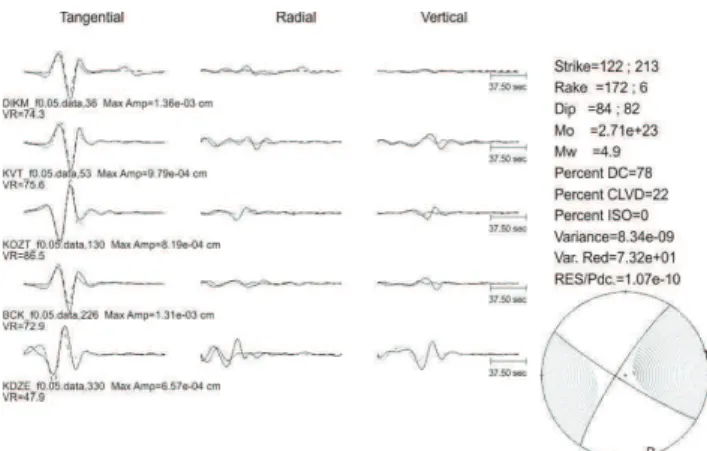
The focal mechanism of the analyzed earthquakes occurred in the Bala-Ankara region obtained both from first motion analysis and time domain moment tensor analysis indicate that the predominant earthquake mechanism is strike-slip mechanism. All earthquakes occur at shallow depths. Only two events occur at 26 km and 36 km depths. Figure 3 gives an example of the details of the time domain moment tensor for event no 1 in the Table 1. Data from five of the available stations in the distance range between 250– 500 km have been used. Each quadrant has at least one stations means that the azimuthal coverage is good to obtain reliable or stable focal mechanism. Source depth from inversion (12 km) is slightly larger than ISC solution (11 km). Variance reduction is 73% that the correlation of data and synthetics is reasonable. The noise on KDZE station could be reducing the variance reduction value. The double-couple contribution of 78% also indicates a good result. The moment magnitude obtained Mw=4.9 and ISC gives mb= 5.1. The mechanism indicates strike – slip faulting with T axis trending NE – SW and P axis NW – SE.
Figure 3. Moment TensorInversion results for the event no
1 in Table 1. Dashed: calculated waveforms, solid: observed seismograms; Letters and numbers below seismograms
indicate station code, filtered data, azimuth, maximum amplitude and variance reduction value.
Ta b le 1 . So u rce p ar am eter s o f th e an al y ze d ea rth q u ak e s. Ev en t N o Da te T im e (UT C) L at. ( o ) (IS C) L o n g . ( o ) (IS C) De p th (k m ) M w mb S tri k e1 ( 0 ) Dip 1 ( 0 ) Ra k e1 ( 0 ) S tri k e2 ( 0 ) Dip 2 ( 0 ) Ra k e2 ( 0 ) P T S . M o m en t (1 0 21 d y n .c m ) Co m m en ts A z P l A z P l 1 2 0 .1 2 .2 0 0 7 0 7 :3 6 :0 0 3 9 .3 8 7 6 3 3 .1 1 8 2 1 0 -- 3 .4 D 1 0 0 5 6 3 5 3 4 9 6 2 1 4 1 4 6 4 3 1 2 4 7 -- fm p 2 2 0 .1 2 .2 0 0 7 0 9 :4 8 :2 7 3 9 .4 3 3 6 3 3 .1 5 3 1 1 1 4 .9 5 .1 2 1 3 8 2 6 1 2 2 8 4 1 7 2 1 6 8 1 7 7 1 0 2 7 1 .0 M T 3 2 0 .1 2 .2 0 0 7 1 0 :1 6 :0 3 3 9 .3 9 0 5 3 3 .0 5 9 6 1 0 -- 3 .5 D 2 2 4 5 6 2 8 2 1 8 6 8 1 4 2 2 7 4 7 1 7 7 4 2 -- fm p 4 2 0 .1 2 .2 0 0 7 1 0 :4 5 :5 2 3 9 .3 6 6 0 3 3 .1 4 7 0 5 3 .7 3 .4 D 2 1 2 8 6 2 3 1 2 0 6 7 1 7 6 3 4 4 1 3 7 8 1 8 3 .5 4 0 M T 5 2 0 .1 2 .2 0 0 7 1 0 :5 0 :1 2 3 9 .3 5 8 7 3 3 .0 7 8 5 1 0 3 .9 3 .6 L 1 8 3 8 3 1 9 3 8 9 1 7 3 1 3 8 4 4 8 6 8 .1 8 0 “ 6 2 0 .1 2 .2 0 0 7 1 1 :1 1 :2 5 3 9 .3 7 1 2 3 3 .1 5 9 7 9 -- 3 .4 D 1 8 3 7 9 2 7 8 8 6 4 1 6 8 3 1 3 1 0 4 8 2 6 -- fm p 7 2 0 .1 2 .2 0 0 7 1 2 :3 4 :2 5 3 9 .3 2 3 0 3 3 .1 9 1 2 1 0 3 .6 3 .6 D 2 0 7 9 -6 1 1 1 8 5 -1 6 9 3 3 6 1 1 2 4 5 4 3 .2 5 0 M T 8 2 0 .1 2 .2 0 0 7 1 9 :1 8 :2 2 3 9 .3 9 6 2 3 3 .0 8 9 8 1 0 3 .7 3 .6 D 3 0 8 8 -1 1 1 2 0 7 9 -1 7 8 3 4 4 9 7 5 6 4 .3 7 0 “ 9 2 6 .1 2 .2 0 0 7 2 3 :4 7 :0 0 3 9 .4 3 9 2 3 3 .1 0 3 0 1 1 4 .2 5 .1 4 1 8 5 1 9 3 0 9 7 1 1 7 5 1 7 4 1 0 2 6 6 1 7 1 9 .7 0 “ 1 0 2 7 .1 2 .2 0 0 7 0 7 :4 7 :0 1 3 9 .4 8 3 4 3 3 .0 4 2 3 4 4 .1 3 .6 2 3 7 8 6 5 1 4 7 8 5 1 7 6 1 2 1 1 0 2 6 1 6 .8 0 “ 1 1 2 7 .1 2 .2 0 0 7 1 3 :4 7 :5 8 3 9 .4 5 3 7 3 3 .0 9 6 7 1 3 4 .6 4 .7 4 3 7 7 -2 7 1 4 0 6 4 -1 6 5 3 5 9 2 8 9 4 8 1 0 1 .0 “ 1 2 2 7 .1 2 .2 0 0 7 1 7 :5 6 :1 2 3 9 .4 1 6 6 3 3 .1 1 4 3 1 0 4 .1 4 .0 L 2 7 8 3 -2 5 1 2 0 6 5 -1 7 2 3 4 1 2 2 7 6 1 2 1 7 .1 0 “ 1 3 2 8 .1 2 .2 0 0 7 2 0 :5 7 :0 6 3 9 .4 3 1 6 3 3 .0 1 0 8 1 0 3 .7 3 .5 L 2 2 8 8 8 3 1 3 8 8 7 1 7 8 3 1 9 4 4 4 .3 3 0 “ 1 4 2 9 .1 2 .2 0 0 7 1 1 :5 4 :1 6 3 9 .3 4 9 3 3 3 .1 9 3 7 2 3 .5 3 .5 D 2 1 1 8 8 2 3 1 2 0 6 7 1 7 8 3 4 3 1 5 7 8 1 7 1 .9 4 0 “ 1 5 0 4 .0 1 .2 0 0 8 0 5 :0 3 :1 3 3 9 .3 9 9 6 3 3 .1 7 1 1 1 0 4 .2 3 .9 9 8 7 -2 9 9 8 8 -1 7 7 3 2 4 4 2 3 4 1 2 1 .0 0 “ 1 6 0 7 .0 1 .2 0 0 8 1 8 :2 6 :5 3 3 9 .4 4 7 9 3 3 .0 6 3 3 1 0 4 .0 3 .7 L 4 0 6 9 -6 1 3 2 8 4 -1 5 9 3 5 8 1 9 2 6 4 1 0 1 0 .6 0 “ 1 7 0 9 .0 1 .2 0 0 8 0 9 :5 0 :2 6 3 9 .3 6 3 0 3 3 .1 6 1 0 5 -- 3 .6 D 1 7 1 5 5 3 3 6 0 6 3 1 4 0 1 1 7 5 2 2 4 7 -- fm p 1 8 1 1 .0 1 .2 0 0 8 1 6 :0 7 :4 8 3 9 .4 3 1 6 3 3 .0 6 0 4 4 3 .9 3 .7 D 3 8 8 8 -9 1 2 8 8 1 -1 7 8 3 5 3 8 8 3 5 8 .6 5 0 M T 1 9 1 4 .0 1 .2 0 0 8 0 6 :5 7 :5 6 3 9 .3 8 9 0 3 3 .1 4 4 8 1 0 3 .8 3 .8 L 1 9 7 8 8 2 1 0 7 8 8 1 7 8 3 3 2 0 6 2 3 4 .9 8 0 “ 2 0 2 0 .0 1 .2 0 0 8 1 4 :4 5 :2 7 3 9 .3 3 1 6 3 3 .2 1 5 7 1 0 3 .5 3 .5 D 1 2 8 8 1 2 8 2 8 9 1 7 8 3 2 7 1 2 3 7 2 2 .1 6 0 “ 2 1 2 6 .0 1 .2 0 0 8 0 6 :5 7 :5 2 3 9 .4 4 7 2 3 3 .0 6 5 3 1 0 3 .7 3 .7 D 2 5 6 8 6 9 1 6 5 8 1 1 7 6 3 0 4 1 2 1 9 3 .7 2 0 “ 2 2 0 1 .0 2 .2 0 0 8 0 9 :1 1 :0 3 3 9 .4 5 9 2 3 3 .0 6 2 5 2 4 .1 3 .8 5 0 7 9 -2 1 4 0 8 8 -1 6 9 5 9 2 7 4 6 1 8 .3 0 “ 2 3 1 5 .0 3 .2 0 0 8 1 0 :1 5 :3 8 3 9 .5 0 0 1 3 3 .0 4 5 5 1 3 4 .9 4 .5 1 4 2 8 2 1 8 5 0 7 2 1 7 2 2 7 5 7 7 1 8 2 5 3 .0 “ 2 4 1 9 .0 4 .1 9 3 8 1 0 :5 9 3 9 .4 4 0 0 3 3 .7 9 0 0 1 0 6 .4 6 .8 S 3 0 6 0 3 2 9 8 8 7 1 5 0 3 4 8 1 8 2 5 0 2 3 4 9 5 4 0 K a la fa t et a l (2 0 0 9 ) 2 5 2 1 .0 4 .1 9 8 3 1 6 :1 8 3 9 .3 1 3 0 3 3 .0 6 3 6 3 6 4 .8 4 .1 6 4 7 2 -2 5 1 6 2 6 6 -1 6 0 2 2 3 0 1 1 4 4 1 9 7 2 4 “ 2 6 3 0 .0 7 .2 0 0 5 2 1 :4 5 3 9 .4 1 3 8 3 3 .0 9 7 0 5 -- 5 .3 L 2 4 7 2 2 6 2 8 5 6 5 1 6 0 1 5 3 5 2 4 6 3 1 -- T an e t al 2 0 1 0 2 7 3 1 .0 7 .2 0 0 5 2 3 :4 1 3 9 .4 4 3 0 3 3 .0 7 8 9 5 -- 4 .8 L 2 4 8 0 -5 1 1 5 8 5 -1 7 0 3 4 0 1 1 2 4 9 4 -- “ 2 8 0 1 .0 8 .2 0 0 5 0 0 :4 5 3 9 .4 5 6 2 3 3 .0 6 5 1 3 -- 4 .6 L 4 2 8 5 1 9 3 1 0 7 1 1 7 5 1 7 4 1 0 2 6 7 1 7 -- “ D: Du ra ti o n M ag n it u d e; L : L o ca l m ag n it u d e; S : S u rf ac e wa v e m ag n it u d e, Italic ev en ts d id n o t u se i n th e stre ss in v ersio n a n d s lip c alc u latio n , si n ce th ey o cc u rre d o u tsi d e o f th e stu d ied a re a.
Ta b le 1 ( co n tin u ed ) Ev en t N o Da te T im e (UT C) L at. ( o ) (IS C) L o n g . ( o ) (IS C) De p th (k m ) M w M L S tri k e1 ( 0 ) Dip 1 ( 0 ) Ra k e1 ( 0 ) S tri k e2 ( 0 ) Dip 2 ( 0 ) Ra k e2 ( 0 ) P T S . M o m en t (1 0 21 d y n .c m ) Co m m en ts A z P l A z P l 2 9 0 6 .0 9 .2 0 0 6 1 8 :4 7 3 9 .4 1 4 0 3 3 .1 2 5 0 1 0 3 .7 3 .8 1 1 8 6 5 -2 0 2 1 7 7 2 -1 5 4 7 9 3 1 3 2 9 4 4 .4 1 5 Ka la fa t et al (2 0 0 9 ) 3 0 2 1 .1 0 .2 0 0 7 2 1 :4 4 3 9 .5 5 7 0 3 3 .1 5 3 7 1 6 4 .0 3 .9 3 3 5 7 9 -8 9 1 5 0 1 1 -9 5 6 6 3 4 2 4 4 5 6 1 0 .1 1 “ 3 1 2 3 .1 2 .2 0 0 7 0 5 :0 2 3 9 .3 7 9 0 3 3 .1 2 0 5 2 6 4 .1 3 .6 D 2 2 1 8 8 -1 1 3 1 1 7 9 -1 7 8 1 7 6 9 2 6 7 6 1 3 .8 5 “ 3 2 1 9 .0 7 .2 0 0 8 0 1 :2 7 3 9 .4 1 0 2 3 3 .1 1 7 2 4 3 .5 3 .8 D 1 7 6 7 7 -8 0 3 1 5 1 7 -1 3 0 9 9 5 7 2 5 8 3 1 2 3 .2 2 “ 3 3 2 3 .0 9 .2 0 0 8 0 9 :0 9 3 9 .4 5 8 3 3 .0 6 0 3 .2 -- 4 .7 L 4 2 8 0 1 0 3 1 0 8 0 1 7 0 1 7 6 1 2 6 6 1 4 -- T an e t al (2 0 1 0 ) 3 4 1 0 .1 0 .2 0 0 8 0 6 :3 6 3 9 .4 5 3 4 3 3 .0 4 3 2 6 4 .2 4 .7 4 9 8 6 -5 4 1 4 4 3 7 -1 7 3 3 5 1 3 8 1 0 8 3 1 2 4 .3 1 Ka la fa t et al (2 0 0 9 3 5 3 1 .0 7 .2 0 0 5 0 0 :4 5 3 9 .4 5 4 3 3 .1 6 6 4 .2 -- 4 .2 L 7 0 9 0 2 6 3 4 0 6 4 1 8 0 2 0 2 1 8 2 9 8 1 8 -- T an e t al (2 0 1 0 ) 3 6 3 1 .0 7 .2 0 0 5 1 5 :1 8 3 9 .4 3 6 3 3 .1 3 8 3 .8 -- 4 .3 L 1 7 7 0 5 2 8 5 8 5 1 5 6 3 3 3 1 1 2 3 9 1 7 -- “ 3 7 0 1 .0 8 .2 0 0 5 0 2 :0 2 3 9 .4 0 0 3 3 .1 1 8 3 .5 -- 4 .0 L 2 8 8 0 -1 8 1 2 0 8 0 -1 7 0 3 4 4 1 4 7 4 1 -- “ 3 8 0 1 .0 8 .2 0 0 5 1 3 :2 2 3 9 .4 0 0 3 3 .1 3 3 3 .6 -- 4 .6 L 2 0 5 8 5 1 0 1 1 5 8 0 1 7 5 3 4 0 4 7 1 1 1 -- “ 3 9 1 1 .0 9 .2 0 0 8 0 8 :3 3 3 9 .4 5 8 3 3 .0 6 0 4 .7 -- 4 .0 L 2 0 9 6 9 -4 7 3 2 0 4 7 -1 5 0 1 6 4 4 8 2 6 9 1 3 -- “ D: Du ra ti o n M ag n it u d e; L : L o ca l m ag n it u d e; S : S u rf ac e wa v e m ag n it u d e, Italic ev en ts d id n o t u se i n th e stre ss in v ersio n a n d sl ip c alc u latio n , si n ce th ey o cc u rre d o u tsi d e o f th e stu d ied a re a.
44 Tahir Serkan Irmak Vol. II, Issue I, 2016
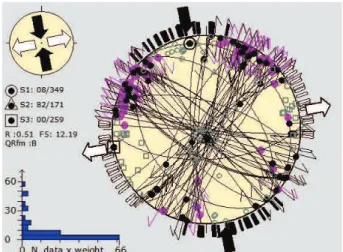
The results of the stress inversion are shown in Fig. 4. Positions of the principal stress axis are shown in equal-area projections. Since no information about the quality of the fault plane solutions of the earthquakes compiled from different studies, all events from the Bala-Ankara region have been given equal weights in the inversion. The results are represented on map view in function of stress regimes and horizontal stress axes orientation (Fig. 1B).
The inversion results reveal a general trend of NW – SE strike-slip (R’=1.49) movement with a B quality for all over the Bala-Ankara region. The principal stress axes of the best model are oriented close to horizontal (σ1 (Plunge: 08o/Azimuth: 349o) and σ3 (Plunge: 00o/Azimuth: 259o)) and vertical (σ2 (Plunge: 82o/Azimuth: 171o)), also indicating strike-slip regime. The maximum compression axis acts NW – SE direction and the minimum compression axis in a NE – SW direction. The SHmin orientation is NE – SW almost orthogonal to the Tuz Gölü Fault. These results are agreed with the study of KOÇYİĞİT and DEVECİ (2008) and KOÇYİĞİT (2009).
Figure 4. Stress inversion of the focal mechanism data from Table 1. Lower-hemisphere Schmidt stereoplot of the
selected focal planes and associated slip lines. Stress inversion results are presented by the orientation of the 3 principal axes (a black dot surrounded by a circle for σ1, a triangle for σ2, and a square for σ3.). The related SHmax and
SHmin orientations are represented by large arrows outside
the stereograms. Their type, length and colour symbolise the horizontal deviatoric stres magnitude relative to the isotropic stress (σi) and are in function of the stress regime and the stress ratio R=σ2−σ3/σ1−σ3. White arrows and black
arrows represents SHmin, and SHmax, respectively. The histogram represents the distribution of the misfit function
F5, weighthedaritmetically according to the magnitudes.
Although the inversion results indicate that the dominant regime is strike-slip, the 6 focal mechanisms retrieved from Kalafat et al. (2009) are mostly normal faulting (4 events) or strike –slip faulting with normal component (2 events) (Fig. 1B). The focal mechanisms of a few events obtained in this study and retrieved from TAN et al. (2010) have reverse faulting mechanism or strike-slip mechanism with reverse component. Since the occurrence of both normal and reverse faulting is not very likely in a single stress regime, these focal mechanisms suggests that the few normal and reverse events represents local stress inhomogeneous. The large misfit angle, α value indicates the internal heterogeneity (PLENEFISCH and BONJER, 1997). Furthermore, large misfit angles can be caused by badly determined fault mechanisms. PLENEFISCH and BONJER, (1997) used the focal mechanisms to obtain stress field in the Rhine Graben area, and found large misfit angle about 19o-22o. In this study, the misfit angle, α is obtained as 12.19o. For this reason that mentioned above, the focal mechanisms obtained by KALAFAT et al. (2009) were neglected and another inversion with the reduced dataset was done. In comparison to the results of the whole datasets the misfit angle is decreased to 10.56o. For the reduced dataset, the azimuths of the principal stress axes are more or less the same for the whole dataset. The differences between the misfit angles with both data sets are very small and the azimuths of the principal axes are almost same. Therefore, the author suggests that the normal and reverse faulting events represent local stress inhomogeneous. Since all earthquakes occur at shallow depths, change of the stress regime with depth did not investigate. Only two events from 37 events occur at 26 km and 36 km depths. Therefore, the changes in the principal stress axes with depth are not understood.
We took about 30 km to the length of the region and about 10 km to the width of the region using the scale in Figure 1A. Then using calculated seismic moment from Table 1,
!"= 2.0563. 10#$%. &
'"= 3()(10*(&+
, = 3.3()(10#"(%&-+
The total seismic moment is calculated as /!"= 2.0563 × 10#$%. &, and the total area is A
"=
3.0(x(10*(m+, and take the rigidity as , = 3.3()(10#"(%&-+. Then the total slip has been calculated 2.08 cm between the years of 1983-2008. The slip rate for
Vol. II, Issue I, 2016 Present-Day Stress Field in the Bala – Ankara (Turkey) Region 45 from Inversion of Focal Mechanisms
this period of time is about 0.083 cm/year or 0.83 mm/year using Equation 2.
4. Conclusions
The main objective of this paper is the determination of the present-day stress field in the Bala-Ankara region by the inversion of focal mechanism. Based on reliable 37 fault plane solutions of small-moderate earthquakes obtained from first motion analysis and regional bodywaveform inversion, several inversions runs have been performed using the inversion method of DELVAUX and SPENCER (2003). The predominant earthquake mechanism is strike-slip in the area and all earthquakes occur at shallow depths except two of them located at 26 km and 36 km depths. The slip rate is calculated as 0.83 mm/year. The state of recent stress and ongoing deformation in Bala-Ankara region is primarily controlled by north-northwest drift of the African and Arabian plates respectively. In terms of stress orientations, the Bala-Ankara region is affected by stresses with a general NW-SE orientation of horizontal maximum principal axis (SHmax N169oE) and NE-SW orientation of minimum principal axis (SHmin N79oE). However, the extensional features (a few normal faulting focal mechanisms) are observed and these features reflect local stress inhomogeneous compared to the regional stress which are strike-slip. Due to all earthquakes occur at shallow depths, the changes in the principal stress axes with depth are not understood. More data and detailed synthesis may be required for a better understanding of these changing.
REFERENCES
ANGELIER, J. and MECHLER, P., (1977), Sur une methode graphique de recherche des contraintes principales egalcment utilisable en tectonique et en seismologie: methode des diedres droits. Bull. Soc. Geol. Fr., 7(19): 1309-1318.
ANGELIER, J., (1979), Determination of the mean principal direction of stresses for a given fault population, Tectonophysics 56, T17–T26. ANGELIER, J., LYBERIS, N., LE PICHON, X.,
BARRIER, E., and HUCHON, P., (1982), The tectonic development of the Hellenic arc and the
Sea of Crete: A synthesis:
Tectonophysics, v. 86, p. 159–196.
ANGELIER, J., (1991), Inversion directe et recherche 4-D:
comparaison physique et
mathernatique de deux methodes de determination
des tenseurs des paleocontraintes
en tectonique de failles. C.R. Acad Sci., Paris, 312(11): 1213-1218.
BEEKMAN, P.H. (1966), Hasan Dağı–Melendiz Dağı
bolgesinde Pliosen ve Kuvaterner
volkanizma faaliyetleri [Pliocene and Quaternary
volcanism in Hasan Dağı-Melendiz
Dağı region]. MTA Bulletin, 66, 88–103 [in Turkish with English abstract].
BOTT, M. H. P., (1959), The mechanism of oblique-slip
faulting. Geological Magazine, 96,
109-117.
BOZKURT, E. (2001), Neotectonics of Turkey—A
synthesis, Geodin. Acta, 14, 3–30,
doi:10.1016/S0985-3111(01)01066-X.
CAREY-GAILHARDIS, E. and MERCIER, J. L. (1987), A
numerical method for
determining the state of stress using focal
mechanisms of earthquake populations.
Earth planet. Sci. Lett. 82, 165-179.
ÇEMEN, İ., GONCUOĞLU, M.C. and DIRIK, K. (1999),
Structural evolution of the Tuz
Golu basin in Central Anatolia, Turkey. The Journal of Geology, 107, 693–706.
DELVAUX, D., 1993. The TENSOR program for
reconstruction: examples from the East
African and the Baikal rift zones.Terra Abstracts. Abstract Supplement, 1 to Terra Nova, 5: 216.
DELVAUX D., MOEYS, R., STAPEL, G. et al. (1997),
Paleostress reconstruction and
geodynamics of the Baikal region, Central Asia, Part
2, Cenozoic rifting.
Tectonophysics, 282, 1-38.
DELVAUX, D. and SPERNER, B. (2003), Stress tensor
inversion from fault kinematic
indicators and focal mechanism data: the TENSOR
program. In: Nieuwland, D. (Ed.),
New Insights into Structural Interpretation and
Modelling: Geol. Soc. Lond. Spec.
46 Tahir Serkan Irmak Vol. II, Issue I, 2016
DOGAN, B., IRMAK, T.S., KARAKAŞ, A., and KALAFAT, D., (2016), Seismotectonic content by the source parameters of the June 10,
2012 Ölüdeniz-Fethiye (Dodecanese
Islands) Mw6.1 earthquake and afterschocks
(southwestern Turkey), Acta Geod.
Geophys., 51, 15-41.
DREGER, D. S., and HELMBERGER, D. V. (1993),
Determination of Source Parameters at
Regional Distances with Single Station or Sparse
Network Data, J.Geophys. Res.
98, 8107-8125.
DREGER, D. and ROMANOWICZ, B. (1994), Source
Characteristics of Events in the San
Francisco Bay Region, USGS Open-file report, 94-176, 301-309.
DREGER, D. S., (2003), TDMT_INV: Time domain
seismic moment tensor INVersion. In
International Handbook of Earthquake and Engineering Seismology, ed. W. K. Lee, Boston: Academic Press 81B, 1,627.
GEPHART, J. W. and FORSYTH, D. W. (1984), An
improved method for determining the
regional stress tensor using earthquake focal
mechanism data: Application to the San
Fernando earthquake sequence, J. Geophys. Res. 89, 9,305-9,320.
GÖRÜR, N., OKAY, F.Y., SEYMEN, İ. and ŞENGÖR,
A.M.C. (1984), Palaeotectonic
evolution of the Tuzgolu Basin complex, central
Turkey: sedimentary record of a Neo-
Tethyan closure. In: Dixon, J.E. and Robertson,
A.H.F. (eds), The Geological
Evolution of the Eastern Mediterranean. Geological
Society of London, Special
Publications, 17, 467–482.
GÜVEN, İ. T., (1999), Yapay Sismogram Hesaplama Yöntemi ile Ankara ve Civarının Yerkabuğu Yapısının Modellenmesi, Master Thesis (in Turkish, unpublished).
HEIDBACH, O., TINGAY, M., BARTH, A., REINECKER, J., KURFESS, D., and MILLER, B., (2010), Global crustal stress pattern based on the
World Stress Map database
release 2008, Tectonophysics, 482, 3-15.
HERRMANN, R. B. and WANG, C. Y. (1985), A
comparison of synthetic seismograms, Bull.
Seism. Soc. Am. 75, 41-56.
IRMAK, T.S. (2000). The source-rupture processes of
recent large Turkey
earthquakes.Individual studies by participants to the
International Institute of
Seismology and Earthquake Engineering,36, 131-143.
IRMAK, T. S. (2013). Focal mechanisms of small-moderate
earthquakes in Denizli Graben
(SW Turkey).Earth, Planets and Space,65(9),
943-955.
JACKSON, J., and MCKENZIE, D. (1984) Active tectonics
of the Alpine-Himalayan belt
between Turkey and Pakistan,Geophys. J. Royal Astronom. Soc. Vol. 77, pp. 185-264.
JOST, M. L., and HERRMANN, R. (1989), A student's
guide to and review of moment
tensors, Seismological Research Letters, 60, 37-57. KALAFAT, D., KEKOVALI, K., DENIZ, P., GÜNEŞ, Y.,
PINAR, A., and HORASAN, A.,
(2008), 31 Temmuz 2005-1 Ağustos 2005 ve 20-27
Aralık 2007 Afşar-Bala (Ankara)
Deprem Dizisi (July 31, 2005 - August 1, 2005 and
December 20-27, 2007 Afşar-Bala
(Ankara) Earthquake Sequence, İstanbul
Yerbilimleri Dergisi, 21(2), 47-60 [in Turkish with English abstract].
KALAFAT, D., KEKOVALI, K., GÜNEŞ, Y., YILMAZER, M., KARA, M., DENİZ, P., and BERBEROĞLU, M. (2009), Türkiye ve çevresi
faylanma-kaynak parametreleri (mt)
kataloğu (1938-2008) A Catalogue of Source
Parameters of Moderate and Strrong
Earthquakes for Turkey and its Surrrounding Area
(1938-2008), Kandilli Observatory
and Earthquake Research Institute report.
KOÇYİĞİT, A. and BEYHAN, A. (1998), A new
intracontinental transcurrent structure: the
Central Anatolian Fault Zone, Turkey.
Vol. II, Issue I, 2016 Present-Day Stress Field in the Bala – Ankara (Turkey) Region 47 from Inversion of Focal Mechanisms
KOÇYİĞİT, A. and DEVECİ, Ş. (2008), Ankara orogenic
phase, its age and transition from
thrusting-dominated palaeotectonic period to the
strike-slip neotectonic period,
Ankara (Turkey). Turkish Journal of Earth Sciences, 17, 433–459.
KOÇYİĞİT, A. (2009), Ankara’nın depremselliği ve 2005–
2007 Afşar (Bala-Ankara)
depremlerinin kaynağı [Seismicity of Ankara and
source of 2005–2007 Afşar (Bala-
Ankara) earthquakes]. Harita Dergisi, 141, 1–12 [in Turkish with English abstract].
KORHAN, U.S., ÖZEL, N.M., and NECMİOĞLU, Ö., (2011), Detection and Identification of Low-magnitude Seismic Events near Bala, Central
Turkey, Using Array-based
Waveform Correlation, Seism.Res.Lett. 82(1), 97-103.
LANGSTON, C.A., (1981), Source inversion of seismic
waveforms: the Koyna, India,
earthquakes of September 13, 1967. Bull. Seis. Soc. Am., 71:1-24.
MCCLUSKY, S. et al. (2000), GPS constraints on plate
kinematics and dynamics in the
eastern Mediterranean and Caucasus, J. Geophys. Res., vol. 105, pp. 5695–5719.
MCKENZIE, D. P. (1969), The relation between fault plane
solutions for earthquakes and the
directions of the principal stresses, Bull. Seism. Soc. Am. Vol. 59, no. 2, pp. 591-601.
MCKENZIE, D. P. (1972), Active tectonics of the
Mediterranean Region, Geophys. J. Royal
Astronom. Soc., 30, 109-185.
MICHAEL, A. J. (1984), Determination of stress from slip
data: Faults and folds, J.
Geophys. Res. 89, 11,517-11,526.
ÖZTÜRK, S. and BAYRAK, Y., (2006), 31 Temmuz 2005
Bala (Ankara) depremi, MD=4.9,
artçı şok dizisinin istatistiksel olarak
değerlendirilmesi ve artçı şok parametrelerinin bölgesel değişimleri, Journal of İstanbul Kültür University, 4(2), 145-155. [in Turkish]
PASYANOS, M. E., DREGER, D. S. and ROMANOWICZ, B. (1996), Towards Real-Time Determination of Regional Moment Tensors, Bull. Seism. Soc. Am., 86, 1255-1269.
PLENEFISCH, T., and BONJER K. P., (1997), The stress
field in the Rhine Graben area
inferred from earthquake focal mechanisms and
estimation of frictional parameters.
Tectonophysics, 275, 71-97.
RALEIGH, C. B., HELAY, J. H. and J.D. BREDEHOEFT, (1972), Faulting and crustal stress at Rangely, Colorado, in Flow and Fracture of Rocks, Geophys.Monog. Ser., vol. 16, edited by H. C. Heard et al., pp. 275-284, AGU, Washington D. C.
RECHES, Z., (1987), Mechanical aspects of pull-apart
basins and push-up swells with
applications to the Dead Sea Transform,
Tectonophysics, 141, 75 – 88.
REILINGER, R.E., MCCLUSKY., S., ORAL, M.B., KING,
R.W. and TOKSÖZ, M.N.
(1997), Global Positioning System measurements of
present-day crustal movements in
the Arabia-Africa-Eurasia plate collision zone. Journal of Geophysical Research 102 (B5), 9983–9999.
RIVERA, L., and CISTERNAS, A., (1990). Stress tensor
and fault plane solutions for a
population of earthquakes. Bull. Seismol. Soc.Am. 80 (3), 600–614.
SAIKIA, C. K., (1994), Modified frequency-wavenumber
algorithm for regional seismograms
using Filon’s quadrature; modeling of Lg waves in
eastern North America,
Geophysical Journal International, 118, 142-158. SCHERBAUM, F., (1994), Basic Concepts in Digital
Signal Processing for Seismologists:
Springer-Verlag New York, Inc (Mar 5 1996). SNOKE, J. A., MUNSEY, J. W. TEAGUE, A. G. and
BOLLINGER, G. A. (1984), A
program for focal mechanism determination by
combined used of polarity and SV-P
48 Tahir Serkan Irmak Vol. II, Issue I, 2016
ŞENGÖR, A.M.C. and YILMAZ, Y. (1981), Tethyan evolution of Turkey: a plate tectonic approach. Tectonophysics 75, 181–241.
TAN, O., et al. (2010), Bala (Ankara) earthquakes:
Implications for shallow crustal
deformation in central Anatolian section of the
Anatolian platelet (Turkey), Turk. J.