DYNAMIC MANAGEMENT OF MUTUAL FUND ADVISORY
CONTRACTS
*YATIRIM FONU ANLAŞMALARININ DİNAMİK YÖNETİMİ
Yaman Ö. ERZURUMLU
Doğuş University, Department of Economics and Finance
ABSTRACT: The price of professional portfolio management provided by the mutual fund adviser depends not only on the fund characteristics but also on the fund objective, the adviser’s portfolio related and management based decisions, and the portfolio performance. I analyze the advisory fee, using a survivorship bias free data set of 176 equity funds managed by 125 different advisers. Advisers benchmark the objective average but this benefit the shareholders only when the objective trend is descending. Advisers tend to reduce the cost of their marginal product through the use of derivatives or manipulate by engaging in soft dollar agreements. I find that the advisers actively manage the advisory fee contracts responding to the outcome of their management decisions. The advisory fee increases after voluntary fee reimbursement or if the adviser is not fully reimbursed for the compensation of independent directors and officers. Keywords: Mutual fund, Advisory fee, Management fee, Contract, Adviser.
ÖZET: Profesyonel portföy yönetim hizmetinin bedeli fon özelliklerinin yanı sıra, fon cinsine, fon yöneticisinin direkt portföy ilişkili ve kurum yönetimi ilişkili kararlarına ve portföyün performansına bağlıdır. Çalışmada 125 farklı kurum tarafından yönetilen 176 hisse senedi fonu incelenmektedir. Fon yönetimi Pazar hizmet fiyatı ortalamasını veri almakta ancak bu strateji ancak trend azalan karakterde olduğu durumlarda fon hissedarlarının lehine işlemektedir. Fon yöneticileri hizmetlerinin masrafını türev araçlarını kullanarak azaltabilmekte ya da “soft dollar” anlaşmalarına girerek manipule etmektedir. Fon yönetim bedeli zorunlu olmayan kesinti aflarını ve bağımsız yöneticilerin masraflarının fon hissedarlarınca tam olarak karşılanmadığı dönemlerden sonra artış göstermektedir.
Anahtar Kelimeler: Yatırım fonları, fon yönetim bedeli, kontrat, fon yönetimi.
1. Introduction
Mutual funds have been displaying dramatic growth for over a decade and this dynamic financial service industry has been getting increasing attention from the regulators, academia, and the press. Despite this rapid growth and dynamic structure of the mutual funds industry, the attention devoted to the advisory contracts which determines the price of the primary product, professional portfolio management, is limited.
Optimal contracts should provide a strong link between managerial compensation and investor welfare when there is little known by the investors about the production function linking their objective function and manager’s objective function (Murphy 1998). Since
*
I would like to thank Melissa Frye, Charles Schnitzlein, Pradipkumar Ramanlal, Richard Hofler, Joel Harper, S. Sinan Erzurumlu, Srinivasan Krishnamurthy and the participants at the presentation of the paper at University of Central Florida and SFA 2005 for helpful comments.
each fund and each adviser is unique, so the contracts should be. The advisory fee contract defines the optimal advisory fee, the major component of the total fee; that covers solely the cost of portfolio management, provides profit to the adviser and still attracts additional inflows. Other components of the fund’s total fee are 12b-1 fees, which are used to compensate broker-dealers for selling efforts, transfer agent fees, and accounting and legal expenses. Funds also charge loads that incur when fund shares are purchased (front-end load) and redeemed (back-end load).
Coles et al (2000) argue that the optimal fee structure varies between funds. Furthermore, Deli (2002) provides evidence implying that the fund characteristics have impact on the variation of the advisory fee. However, the economic determinants of the advisory fee would not be limited to the fund characteristics for couple of reasons. First, the advisory fee is not bound by any regulation such as 12b-1 fees. Due to its largely unconstrained nature, the advisory fee will depend on the contract environment (Jensen and Meckling (1976), Deli (2002). Therefore, market dynamics and norms are likely to affect the optimal advisory fee. Second, Tufano and Sevick (1997) suggest that advisory contracts are largely the products of advisory firms themselves. Therefore, the advisory fee is dependent on the adviser’s decisions. These decisions might be directly related to portfolio management such as the use of derivatives or they might be management decisions exogenous to cost of portfolio management such as voluntary reimbursement of fees. The adviser is also expected to attempt to distinguish himself based on the quality of his marginal product. Therefore, the adviser is likely to try to signal abnormal performance as an indicator of superior management skills.
Overall, the economic determinants of the optimal advisory fee are not limited to the fund characteristics. While the adviser takes the fund characteristics, the market norms and fund performance given, he or she could actively manage the advisory fee through his or her own management decisions. The adviser would consider these four set of factors while adopting an advisory fee strategy.
In a competitive market such as mutual funds where funds are pushed to compete on the fees, the adviser would determine the additional mark-up to advisory fee observing the market norms and competitors’ advisory fees. This would not require a fundamental change to the cost structure as long as the premium is high enough for the adviser. However, the competition would limit the degree of mark-up. Hence, this would lead the adviser to attempt to find ways to reduce the cost of portfolio management. In that case, the advisor has broadly two options. First, the adviser may alter the portfolio management techniques or reimburse fees. Second, he or she may simply manipulate the fee contract in order to reduce the contractual advisory fee without actually changing the total rent transfer from shareholders.
Using a survivorship bias free sample of 176 equity funds managed by 125 different advisors, I investigate how the dynamic advisory fee management is associated with the adviser’s decisions and the given factors such as fund characteristics, market norms and performance. I find that fund characteristics have an impact on the advisory fee. The advisory fee decreases with fund size, but increases with the adviser’s size. I find that the advisory fee is adjusted based on the objective average. However, this strategy benefits the shareholder only when the objective average fee declines.
Advisory fee determination is associated with both the portfolio related and the management related decisions of the adviser. Several results support this conclusion. I find that, the adviser successfully reduces the cost of portfolio management by using derivatives or manipulate the advisory fee by engaging in research agreements. Also, funds that bundle the gross administrative fee and gross advisory fee have a higher contractual advisory fee. Contracting is further affected by ex ante voluntary fee reimbursement by the advisory firm. Advisers do not adjust the advisory fee based on the overall number of non-reimbursed services. However, when the non-reimbursement is examined at the individual service level, the results indicate that advisers adjust the advisory fee based on the non-reimbursement of certain services.
Finally, not necessarily performance improvement but superior performance gives the adviser the opportunity to successfully signal better management skills and increase the advisory fee. Since Jensen (1968), the majority of the studies show that mutual fund managers fail to outperform passive benchmarks. However, superior performance is still likely to serve as a signal of better management skills.
Section 2 discusses the variables and hypothesis. Section 3 provides information on the data and methodology. Section 4 presents descriptive statistics, discusses empirical results, and limitations. Section 5 concludes and suggests possible future research.
2. Variables and Hypotheses
2.1 Advisory fee
Literature provides evidence that advisory contracts differ based on fund characteristics. However, the adviser would consider different sets of factors simultaneously for the advisory fee determination. Besides the fund characteristics, the adviser’s fee decision would be constrained by the norms imposed by the market dynamics; influenced by the incentive to signal superior management skills, and determined by the management decisions.
2.1.1. Fund specific factors
The literature provides evidence that fund size significantly affects the advisory fee. Smaller funds and funds of smaller advisers have higher advisory fees (Deli (2002)), thus economies of scale exists.1 Furthermore, a better informed adviser is more likely to engage in a greater amount of information-motivated trading leading to a higher turnover rate (Ippolito (1992), Edelen (1999), Deli (2002)). Nevertheless, it has also been suggested that a high turnover rate could be the result of the manager’s excess risk-taking motivated by poor performance (Brown et al. (1996), Khorana (2001)). Moreover, it could be higher rent transfer that gives incentive to the fund management to increase the amount of transactions. Therefore, the relation between turnover and the advisory fee is an empirical question.
Tufano and Sevick (1997) point out that a higher minimum investment will reduce the number of shareholder accounts, and have a negative effect on the total fee, increasing
1 McLeod and Malhotra (1994); Malhotra and McLeod (1997); Latzko (1999); Rea et al. (1999); Securities and Exchange Commission (2000); LaPlante (2001); Latzko (2004). ), and Fortin
the monitoring power of shareholders. On the other hand, distribution of the fixed part of the management cost over a larger number of accounts decreases the cost per account. Freeman and Brown (2000) challenge the latter argument suggesting that additional shareholder accounts resembles “the effect of adding viewers on the creative cost of devising a TV show.” and should not affect the management cost. Thus, the relation between the advisory fee and the number of shareholder accounts is not clear a priori. 2.1.2. Market factors
Due to its largely unconstrained nature, the advisory fee will depend on the contract environment (Jensen and Meckling (1976), Deli (2002)). Moreover, if the mutual fund market is self disciplinary and competitive, advisers that fail to be competitive on the advisory fee should be driven out of the market. Luo (2002) reports that competition within the fund objective --measured by a Herfindahl index-- has a decreasing effect on the mark-up of management fees. This proxy also suggests that competition will be stronger if there are more funds in an objective or the assets are more equally distributed. Therefore, I expect the advisory fee to decrease as the objective gets more competitive. Besides the competition, the optimal advisory fee will be affected by the market norms if the adviser actually benchmarks them. In that case, the adviser would take the competitors’ advisory fees into account while determining his or her own advisory fee. Thus, if the common argument in the fund proxies stating that the advisory fee is set with respect to similar funds’ is valid, then I should observe the adviser adjusting the advisory fee according to the objective average. For example, if an adviser sets the advisory fee equal to the objective average, a decrease in the objective average would require an advisory fee adjustment.
2.1.3. Fund performance
The literature suggests that bearing the cost of load fees or higher expense ratios does not necessarily lead to better returns for investment.2 Furthermore, there is a tradeoff between higher costs and excess return. Nevertheless, the adviser is likely to try to justify an increase in the advisory fee by implying better performance is a signal of superior management skills. Similarly, if performance is poor, the adviser is likely to be monitored more closely. Kuhnen (2005) suggests that the advisory fee decreases when the fund is within the group of the lowest two deciles of unadjusted performers.
If the investor reacts to simple performance measures as Sirri and Tufano (1998) suggest then beating the market benchmark or objective average could be used to justify an increase in advisory fee. Thus, a fund that beats its benchmark may be able to successfully signal superior management skills.
2.1.4. Adviser’s decisions
As mentioned above, the literature argues that the advisory contracts are largely the products of advisory firms themselves. Thus, the contractual advisory fee should not be independent from the adviser’s decisions. The first group of these decisions is directly related to portfolio management such as outsourcing the research service or the use of derivatives. These decisions would be mainly cost reduction motivated and would be
2 Ippolitto (1989), Elton, Gruber, Das, Hlavka (1993), Grinblatt and Titman (1994), Droms and Walker (1994), Gruber (1996), and Fortin and Michelson (1996)
indirectly enforced by the market factors that limit the degree of possible mark-up for excess premium. The second group is management decisions that are not directly linked to the portfolio management such as voluntary fee reimbursement. The adviser is likely to consider the outcome of these decisions while reviewing the advisory fee.
2.1.4.1. Research agreements and use of derivatives
The adviser takes market dynamics as given and these factors play mostly a constraining role on the mark-up. However, there is a limit that the adviser can decrease the mark-up in order to remain competitive without decreasing the cost of portfolio management. In an attempt to reduce the cost or manipulate the advisory fee, the adviser may choose to alter portfolio management techniques or adopt additional procedures. In the case of successful reduction of the cost, the adviser chooses between passing on the reduction to shareholders as a lower advisory fee and keeping the excess rent as an indirect mark-up.
One procedure would be outsourcing the research activity under agreements commonly known as “soft dollar agreements” or “soft dollar arrangements.” When the research activity is carried out by a separate entity, the adviser does not necessarily change the cost structure of portfolio management but rather manipulates it. The cost of research which would otherwise be paid out of the advisory fee is transferred from shareholders in the form of brokerage fees. In this case, less rent transfer from shareholders under the advisory fee should be enough to accomplish the remaining portfolio management functions. Thus, advisers that enter research agreements should have lower advisory fees if they pass the reduction on to the shareholders.
Another procedure would be the use of derivatives. Even if the use of derivatives as an alternative portfolio management tool requires the mutual fund board’s approval, it is the fund management that decides to actually use them. Deli and Varma (2002) suggest that approval of derivatives varies between different types of funds based on the risk involved. Thus, the use of the derivatives is not independent from the adviser’s marginal product. Although Koski and Pontiff (1999) find that funds use derivatives as a means of reducing the transaction costs that are necessary to keep a given portfolio exposure, Deli (2002) argues that there is no significant relation between the use of derivatives and the advisory fee. On the other hand, it is possible that the adviser proposes the successful use of derivatives as a signal of superior management skill.
2.1.4.2. Adviser’s management decisions
Deli (2002) suggests that equity and domestic funds with higher numbers of services have higher advisory fees. However, services that are reported in fund’s NSAR filings3 under item 54 are the services that the adviser provides, but is not fully
3 (1) Occupancy and office rental (2) Clerical and bookkeeping services (3) Accounting services (4) Services of independent auditors (5) Services of outside counsel (6) Registration and filing fees (7)Stationery, supplies and printing (8) Salaries & compensation of Registrant’s interested directors (9)Salaries & compensation of Registrant’s disinterested directors (10) Salaries & compensation of Registrant’s officers who are not directors (11) Reports to current shareholders (12) Determination of offering and redemption prices (13) Trading department (14) Prospectus preparation and printing for current shareholders (15) Other
reimbursed by the fund.4 In case of non-reimbursement, the adviser has the option to adjust the advisory fee or forgo non-reimbursement probably because the current advisory contract already includes the necessary mark-up. Furthermore, the adviser’s response to non-reimbursement may differ between the services based on the structure of the service. If the cost of the service is mostly fixed and the adviser could predetermine the approximate cost allocated to a specific fund (i.e. occupancy of office rental), he or she can make necessary adjustments to advisory fee in advance. On the other hand, if the cost of the service varies based on changing fund characteristics, or if the service is solely used by the fund, the adviser could choose to adjust the advisory fee following the non-reimbursement of the service. Salaries and compensation of independent directors is a good example for this type of service. Compensation of directors not only depends on the changing workload of the fund but also on the fact that each fund compensates its board members separately. Thus, the non-reimbursement of these types of services may increase the advisory fee ex post.
Another management decision of the adviser is how the payment of gross administrative fee would be. Funds pay the gross administrative fee separately or bundled with the gross advisory fee. In the bundled case, the fund reports in the NSAR a gross administrative fee of zero. Therefore, a fund that reports a positive administrative fee in the NSAR is expected to report a lower advisory fee compared to a similar fund that reports the two costs combined. Latzko (1999) finds larger economies of scale in administrative services cost. Therefore, any existing economies of scale should not be affected even if the administrative fee and the advisory fee are bundled.
Christoffersen (2001) suggests that ex ante contracting is affected by the possibility of ex post voluntary reimbursement by the advisory firm. The best signal for the possibility of ex post voluntary reimbursement is likely to be the ex ante reimbursement. Thus, I control for the amount of ex ante voluntary reimbursement. Overall, in a competitive market where the advisory fee contracts are dynamically managed, the advisory fee contract is based on but not limited to the fund characteristics. The advisory fee management would be affected by a set of factors. Successfully signaling superior management skills (i.e. higher quality marginal product) may give the adviser the opportunity for additional mark-up. However, in a dynamic market the adviser is expected to respond to the competitors’ price and market structure as well. The reduction of mark-up solely based on market factors is limited and enforces cost reduction as an alternative in order to remain competitive. The adviser could reduce the portfolio management cost either by using more sophisticated techniques such as derivatives or simply manipulate the advisory fee by adopting procedures such as the “soft dollar agreement”. Besides these cost
4 NSAR asks the fund (the registrant) to provide the following information under item 54 “Indicate below whether services were supplied or paid for wholly or in substantial part by investment adviser(s) or administrator(s) in connection with the advisory or administrative contract(s) but for which the adviser(s) or administrator(s) are not reimbursed by the Registrant:”
reduction techniques, outcomes of the adviser’s management decisions would also have a significant effect on the advisory fee.
3. Data and Methodology
The data covers a 9-year period from 1996 to 2004. 1996 was picked as the beginning year since SEC started to make the filing of NSAR a requirement for a subsample of funds in 1994 and for the whole industry beginning in 1996. The information was collected from the fund proxy reports, the NSAR-B, the SAI (Statement of Additional Information) and the CRSP Survivorship Free Mutual Fund Database. Table 1 provides a list of variables with their sources and definitions.
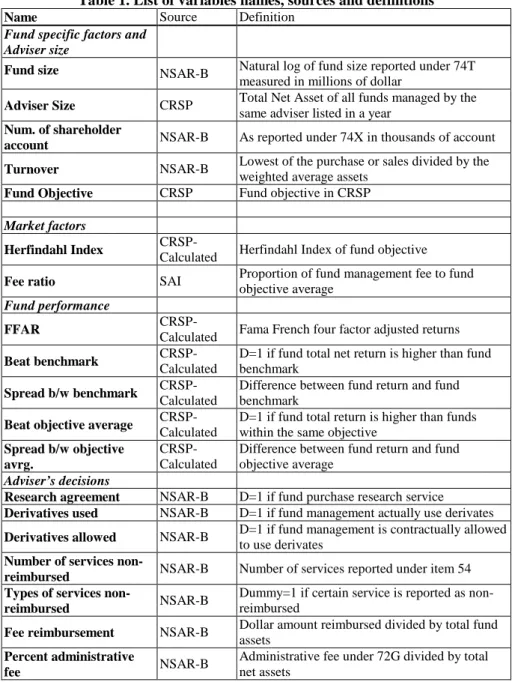
Table 1. List of variables names, sources and definitions
Name Source Definition
Fund specific factors and Adviser size
Fund size NSAR-B Natural log of fund size reported under 74T
measured in millions of dollar
Adviser Size CRSP Total Net Asset of all funds managed by the
same adviser listed in a year
Num. of shareholder
account NSAR-B As reported under 74X in thousands of account
Turnover NSAR-B Lowest of the purchase or sales divided by the
weighted average assets
Fund Objective CRSP Fund objective in CRSP
Market factors
Herfindahl Index
CRSP-Calculated Herfindahl Index of fund objective
Fee ratio SAI Proportion of fund management fee to fund
objective average
Fund performance
FFAR
CRSP-Calculated Fama French four factor adjusted returns
Beat benchmark
CRSP-Calculated
D=1 if fund total net return is higher than fund benchmark
Spread b/w benchmark
CRSP-Calculated
Difference between fund return and fund benchmark
Beat objective average
CRSP-Calculated
D=1 if fund total return is higher than funds within the same objective
Spread b/w objective avrg.
CRSP-Calculated
Difference between fund return and fund objective average
Adviser’s decisions
Research agreement NSAR-B D=1 if fund purchase research service
Derivatives used NSAR-B D=1 if fund management actually use derivates
Derivatives allowed NSAR-B D=1 if fund management is contractually allowed
to use derivates
Number of services
non-reimbursed NSAR-B Number of services reported under item 54
Types of services
non-reimbursed NSAR-B
Dummy=1 if certain service is reported as non-reimbursed
Fee reimbursement NSAR-B Dollar amount reimbursed divided by total fund
assets
Percent administrative
fee NSAR-B
Administrative fee under 72G divided by total net assets
To construct the sample, I select randomly among the actively managed equity funds on the CRSP Survivorship Free Mutual Fund Database after excluding index funds and funds that are managed by Vanguard. Data are limited to equity funds in order to make the collection process manageable, and most prior literature focuses on equity funds. The management of Vanguard is structurally different than rest of the industry. Index funds were eliminated because these funds are not actively managed. Multiple classes of the same fund were also eliminated, thus the final list included each fund only once. One possible concern may be that large fund families such as Fidelidity are likely to appear more frequently, leading to a selection bias. However, considering the ongoing fee competition between major fund families, it cannot be ruled out that an advisory firm which has more weight in the industry might also have more influence on the industry norms. Moreover, as mentioned above it is widely stated in fund proxies that comparing the fee rate of the fund with the fee rate of similar funds is a common method. Thus, any bias in the sample set due to this reason will also be valid for the population itself.
Funds are grouped according to their objective as defined in the CRSP Database. The weight of each objective in the initial sample set was determined based on the weight of the objective in the whole set of funds. For example, if there are 100 funds that were active in the industry sometime between 1996 and 2004, and 20 of these funds are aggressive growth funds; then my sample set was constructed such that 20% of it consists of aggressive growth funds. The final data set consist of 176 funds, 109 of which are still active and 67 are dead. These 176 funds are managed by 125 different advisers.
I collect the information about the funds and the advisers from the funds’ NSAR-B and SAI. The advisory fee reported in fund NSAR-B at the end of a fiscal year is taken as the applied advisory fee during that past fiscal year. The adviser is assumed to determine the applied advisory fee after observing the information at the beginning of the fiscal year. For example, the advisory fee reported in January 2000 NSAR-B is taken as the applied advisory fee for the year 1999 based on the information available to the adviser at the beginning of 1999, reported in January 1999 NSAR-B.
For the model in Table 4 the dependent variable is the weighted advisory fee measured in basis points. The study is limited to funds that have contracts defining advisory fee as a percentage of total assets. Deli (2002) shows that the majority of the advisory fee contracts have asset based fixed or scaled fee structures. Under a scaled fee contract, different fee rates are applied to different ranges of assets. In the case of scaled fee contract, asset weighted advisory fee is calculated by multiplying each fee level with the amount of asset the fee is applied to using the total weighted average asset of the fund reported in NSAR-B. Thus, the first fixed effects model for fund “i” where the advisory fee is regressed on lagged variables (except research agreement dummy) is as follows;
t i t i t i t i t i t i t i t i t i t i t i t i t i t i
e
peradmfee
s
feereimbur
rv
nonreimbse
research
derivused
ffar
feeratio
herfindahl
numaccount
turnover
advsize
fsize
advfee
, 1 , 1 , 1 , , 1 , 1 , 1 , 1 , 1 , 1 , 1 , 1 , ,ln
ln
ln
+
+
+
+
+
+
+
+
+
+
+
+
=
− − − − − − − − − − − (1)Where the independent variables are fund size, adviser size, number of shareholder accounts, objective Herfindahl index, objective management fee average, Fama French four factor adjusted return, “use of derivatives” dummy, research dummy, percent non-reimbursement, percent fee reimbursement and percent administrative fee respectively. Detailed definitions and the calculations of the variables are given in Table 1.
Fama French 4 factor adjusted return 5 is replaced with a “beat fund objective average return” dummy in model 2 and is replaced with the spread between the fund return and the objective average in model 3. Services are entered separately in model 4. Hausmann tests favored fixed effects model. However, recent literature raises concern about the use of a more restricted fixed effects model arguing that governance structures of corporations are too dynamic to assume that uncontrolled variables are constant throughout the sample period. Therefore, such assumption could lead to spurious results (Zhou 2001). Furthermore, the random effect models allow for the inclusion of non-variant variables. Model 5 is the random effects model with the additional non-variant variables of dead fund dummy and fund objective. Results of both methods are reported for robustness check.
The Herfindahl index of each objective is calculated in order to control for the competitiveness of the objective. Using the notation of Luo (2002), the calculation of the objective’s Herfindahl index
h
( i
I
,
)
is as follows:∑ ∑
∈ ∈
=
I k I j j kA
A
i
I
h
2)
,
(
(2) Where∑
∈I j j kA
A
is the share of net assets of fund k relative to the total net assets in
the category.
Luo (2002) argues that if the competition among the advisers in an objective is Bertrand competition then all advisers’ services are assumed to be homogeneous and equal. Therefore, I should observe the advisers pricing their services equal to the marginal cost of the product regardless of the number of advisers in the market. This would be the
5 Intercept of the regression analysis where excess fund return is regressed on Fama and French four factors: small to big (SMB), high minus low (HML), excess return on market (MKTRF) and momentum. Values for factors are obtained from CRSP Survivorship Free Mutual Fund Database.
same as saying one adviser is not different than another, which is a strong assumption in the mutual fund industry. Furthermore, Sutton (1991) shows that, over a broad class of oligopoly models, there is not necessarily a relation between the number of market participants and the variable part of the cost of the product. Thus, normalized Herfindahl indices are calculated following Luo’s (2002) technique.
Specifically, the normalized Herfindahl index for category I in which fund i belong, denoted
h
iI, is defined as:1
)
,
(
)
,
(
−
=
i
I
h
i
I
h
h
iI c (3)Where
h
c(
I
,
i
)
=
1
/
N
I;N
I denotes the number of funds in mutual fund category.The normalized Herfindahl index characterizes the relative competitiveness of the objective to which the fund belongs compared to the case where net assets are equally distributed among all funds within the objective. For example, it takes the value of one if there exists one fund in an objective.6
4. Empirical Analysis
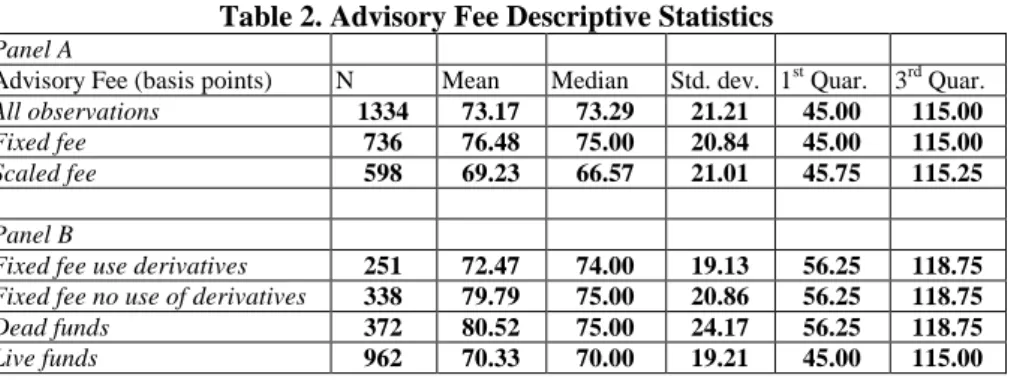
4.1. Descriptive StatisticsTable 2 specifies that the asset weighted advisory fee mean is 73.17, median is 73.29 basis points. Partitioning the sample set based on the contract type reveals that fixed fee funds’ average advisory fee is 7.25 basis points higher than funds with concave fee contracts. Results also provide preliminary evidence suggesting that use of derivatives is negatively related with the advisory fee. Although all have linear fee structures, fixed fee funds that use derivatives have on average lower advisory fee (79.79 bp.) than the fixed fee funds that do not (72.47 bp). Furthermore, the funds that fail to survive during the sample period have 0.119% higher advisory fee suggesting that competitive fee pricing may be necessary for survival.
Table 2. Advisory Fee Descriptive Statistics Panel A
Advisory Fee (basis points) N Mean Median Std. dev. 1st Quar. 3rd Quar.
All observations 1334 73.17 73.29 21.21 45.00 115.00
Fixed fee 736 76.48 75.00 20.84 45.00 115.00
Scaled fee 598 69.23 66.57 21.01 45.75 115.25
Panel B
Fixed fee use derivatives 251 72.47 74.00 19.13 56.25 118.75
Fixed fee no use of derivatives 338 79.79 75.00 20.86 56.25 118.75
Dead funds 372 80.52 75.00 24.17 56.25 118.75
Live funds 962 70.33 70.00 19.21 45.00 115.00
6
I repeated tests without normalizing the Herfindahl index as suggested by Luo (2002). Results remained qualitatively the same.
Table 3 shows that average fund size is $254.55 million and average advisory size is $9506.09 million. Average fund turnover is 90.48%. Funds do not fully reimburse the management company, on average, for 6 services. Although, average voluntary reimbursement of fees is equal to 21 basis points of net assets, the median is 0 basis points, indicating that a significant number of funds do not reimburse fees. The number of years that the funds voluntarily reimburse fees accounts for 47% of all observations. Administrative fee has the same skewed distribution. Although the average administrative fee is 0.11% of the total net assets, the median is just 0.013% since some funds combine the administrative costs with the advisory fee, and report administrative expenses in NSAR as $0. The number of years that the administrative fee is equal to zero accounts for 47% of the observations. Funds receive research service from an outside source for 81% of the fund years7, and use derivatives as a management tool for 44% of the fund years indicating that these practices are not rare among funds.
Table 3. Descriptive Statistics of Independent Variables Panel A
Variables Mean Median
Fund size ($ million) 254.55 275.63
Adviser size ($ million) 9506.09 14445.80
Turnover 90.48 68.00
Services 5.80 6.00
% reimbursement 0.21% 0.00%
Num of account (thousand) 7374.75 10721.0
Percent Administrative cost 0.11% 0.013%
Panel B
Variables 1 0
Research Agreement 81% 19%
Use of derivatives 44% 56%
Preliminary tests not reported here reveal that correlations between the advisory fee and other types of rent transfer (i.e. loads and 12b-1) are positive and below 0.58. Thus, one type of rent transfer is not used systematically as substitute for another.8
7 These are the funds that stated that the item 26B in fund NSAR-B “receipt of investment research and statistical information” as one of the “considerations which affected the participation of brokers or dealers or other entities in commissions or other compensation paid on portfolio transactions of Registrant”
8 Advisory fee is the only form of rent transfer to the adviser solely for the purpose of portfolio management service and represents the largest component of total fee. Nevertheless, it is not the only form of rent transfer to adviser. Thus, one may argue that an adviser who transfers enough rent through other sources (such as 12b-1 and loads) may accept a lower advisory fee.
Finally, all VIF (variance inflation factor) values are below 3, suggesting that there is no serious multicollinearity between independent variables.9
4.2. Advisory Fee
4.2.1. Fund specific factors and adviser size
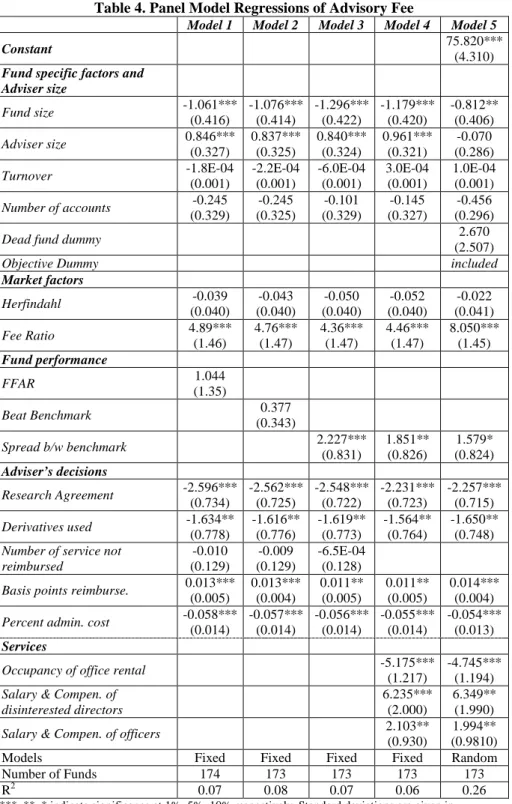
Table 4 reports results from the model (1) which dependent variable is the basis point advisory fee. Results indicate that larger funds have lower advisory fees, consistent with the previous literature and supports the existence of economies of scale. It also implies that funds that manage to survive and grow reduce the advisory fee. However, a positive relation between the adviser size and the advisory fee indicates that as the adviser grows, he or she charges higher advisory fees. I interpret this result as the adviser reflecting the increasing market power to shareholders as assets under the management grow.
4.2.2. Market factors
The positive relation between the fee ratio and the advisory fee indicate that the objective average management fee is benchmarked. However, this benefits the shareholder only when there is a decrease in the objective advisory fee. For example, if the objective average advisory fee and the fund advisory fee ratio is 1 and the objective average advisory fee increases and ratio becomes 2, the adviser negotiates for higher advisory fee for the following fiscal year. Similarly, if the ratio is 2 and decreases to 1 after the objective average advisory fee decreases, the adviser approves lower advisory fee for the following fiscal year. However, the Herfindahl index and the advisory fee are not significantly related indicating that the advisory fee is not managed based on the objective asset concentration.10
4.2.3. Fund returns
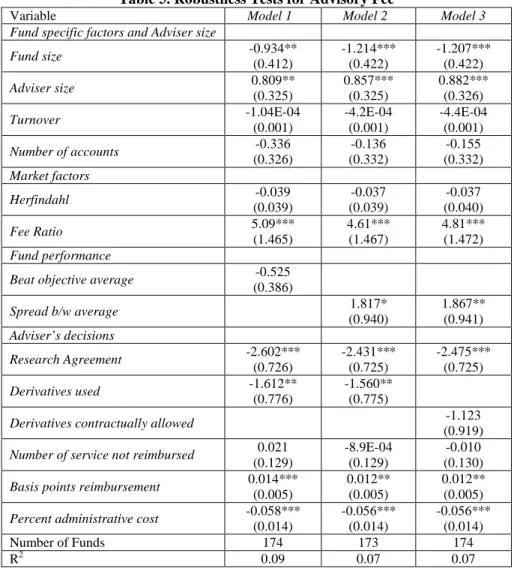
Results indicate that performance improvement does not necessarily signal superior management skill leading to additional mark-up. Thus, the advisers tend to prefer to benefit from investor’s “return chasing” behavior, additional fund inflow following a performance improvement (Sirri and Tufano 1998). Further the second model where the Fama-French 4 factor adjusted return is replaced by the dummy variable equal to one if the fund beats the benchmark implies similar results. However, in model 3 where the adjusted return is replaced by the spread between the benchmark and the adjusted fund performance suggest that sufficient spread between the benchmark and the fund return is followed by additional mark-up. Although an adviser who beats the benchmark index does not necessarily signal superior management skills, performance improvement seems to be sufficient if the fund return exceeds a certain threshold for signaling superior management. Table 5 reports the robustness check where the market benchmark is replaced by the objective average return. Results are qualitatively the same.
9 Although there is no certain threshold in statistics for determining multicollinearity based on VIF values, 10 is considered as the conservative threshold (Neter, Wasserman and Kutner 1985).
10
This result is consistent with Warner and Wu (2005) where in a different and limited model they study the role of economies of scale, advisor ability and industry competition on advisory fee contracts.
Table 4. Panel Model Regressions of Advisory Fee
Model 1 Model 2 Model 3 Model 4 Model 5
Constant 75.820***
(4.310)
Fund specific factors and Adviser size Fund size -1.061*** (0.416) -1.076*** (0.414) -1.296*** (0.422) -1.179*** (0.420) -0.812** (0.406) Adviser size 0.846*** (0.327) 0.837*** (0.325) 0.840*** (0.324) 0.961*** (0.321) -0.070 (0.286) Turnover -1.8E-04 (0.001) -2.2E-04 (0.001) -6.0E-04 (0.001) 3.0E-04 (0.001) 1.0E-04 (0.001) Number of accounts -0.245 (0.329) -0.245 (0.325) -0.101 (0.329) -0.145 (0.327) -0.456 (0.296)
Dead fund dummy 2.670
(2.507)
Objective Dummy included
Market factors Herfindahl -0.039 (0.040) -0.043 (0.040) -0.050 (0.040) -0.052 (0.040) -0.022 (0.041) Fee Ratio 4.89*** (1.46) 4.76*** (1.47) 4.36*** (1.47) 4.46*** (1.47) 8.050*** (1.45) Fund performance FFAR 1.044 (1.35) Beat Benchmark 0.377 (0.343) Spread b/w benchmark 2.227*** (0.831) 1.851** (0.826) 1.579* (0.824) Adviser’s decisions Research Agreement -2.596*** (0.734) -2.562*** (0.725) -2.548*** (0.722) -2.231*** (0.723) -2.257*** (0.715) Derivatives used -1.634** (0.778) -1.616** (0.776) -1.619** (0.773) -1.564** (0.764) -1.650** (0.748) Number of service not
reimbursed -0.010 (0.129) -0.009 (0.129) -6.5E-04 (0.128) Basis points reimburse. 0.013***
(0.005) 0.013*** (0.004) 0.011** (0.005) 0.011** (0.005) 0.014*** (0.004) Percent admin. cost -0.058***
(0.014) -0.057*** (0.014) -0.056*** (0.014) -0.055*** (0.014) -0.054*** (0.013) Services
Occupancy of office rental -5.175***
(1.217)
-4.745*** (1.194) Salary & Compen. of
disinterested directors
6.235*** (2.000)
6.349** (1.990)
Salary & Compen. of officers 2.103**
(0.930)
1.994** (0.9810)
Models Fixed Fixed Fixed Fixed Random
Number of Funds 174 173 173 173 173
R2 0.07 0.08 0.07 0.06 0.26
***, **, * indicate significance at 1%, 5%, 10% respectively. Standard deviations are given in parenthesis.
4.2.4. Adviser’s decisions
Further results indicate that the adviser’s decisions related to portfolio management that will reduce the cost of management or just manipulate the advisory fee without a fundamental change to the overall cost affect the advisory fee. Decisions such as the use of derivatives, the research agreements, separating administrative fee and fee reimbursements are used in order to remain competitive and for indirect mark-up. 4.2.4.1. Use of derivatives and research agreements
One optional technique is the use of derivatives (options or futures). The negative result between the use of derivatives and the advisory fee supports Koski and Pointiff’s (1999) argument that the use of derivatives reduces the cost of portfolio management. Certainly, the result does not rule out the argument that ability to use derivatives being taken as a signal of superior management skill which could lead to an advisory fee increase; yet, the benefit seems to exceed the potential cost of it. Although the use of derivatives has to be approved by the fund board before they are actually used by the adviser, the robustness check in Table 5 shows that the approval does not lead to a decrease in the advisory fee. Thus, the approval of the use of derivatives by the board does not automatically signal that the adviser has superior management skills.
Another optional procedure is outsourcing the research activity. In this case, the cost of research which would otherwise be paid out of the advisory fee is transferred from the shareholder in the form of a brokerage fee. Such an agreement gives the adviser the opportunity to reduce the advisory fee without a fundamental reduction in the overall cost of portfolio management. Positive result between the research dummy and advisory fee suggests that funds with such agreements have significantly lower advisory fees.
4.2.4.2. Adviser’s management decisions
One of the adviser’s management decisions is whether to bundle the gross administrative fee with the gross advisory fee. Results imply that the advisory fee is lower for the funds that pay a separate gross administration fee. Another management decision of the adviser is voluntary fee reimbursement. Christoffersen (2001) suggests that expense reimbursements negotiated at the end of the year are direct mechanism of temporary increase in fund returns thus rebalancing rent transfer to shareholders. The contract environment is affected by the possibility of this ex post reimbursement by the adviser. A signal of the possible ex post reimbursement practice is voluntary reimbursement during the previous fiscal year. I find that ex ante voluntary fee reimbursement leads to a higher advisory fee. Thus, previous voluntary fee reimbursement is likely to be taken as a signal for possible fee reimbursement in the future. In this case, the contractual fee might include some amount of mark-up that is expected to be ex post reimbursed. Such mark-up gives the adviser opportunity to manage the rent transfer after the contract is created. The fourth and fifth models in Table 4 provide further evidence on non-reimbursed services. In these two models, the aggregate number of non-reimbursed services is replaced by the dummy variables for the services listed in the NSAR. VIF values of all services are below 4.03 indicating that there is no serious multicollinearity between services. Only statistically significant results are reported in Table 4. Although the total
number of non-reimbursed services and the advisory fee do not reveal any significant relation in previous models, results in the last two models in Table 4 indicate that advisers do not follow a uniform strategy for the non-reimbursement among services. Results indicate that the adviser adjusts the advisory fee if the adviser is not fully reimbursed for the disinterested directors’ and officers’ compensation. The result supports the positive relation between independent director compensation and advisory fee.11 The negative result of office rental could be due to the predictability of the cost which gives the adviser the opportunity to make necessary mark-up ex ante. Furthermore, funds might benefit from economies of scale since cost of office rent is allocated between funds under the management of the same adviser.
Table 5. Robustness Tests for Advisory Fee
Variable Model 1 Model 2 Model 3
Fund specific factors and Adviser size
Fund size -0.934** (0.412) -1.214*** (0.422) -1.207*** (0.422) Adviser size 0.809** (0.325) 0.857*** (0.325) 0.882*** (0.326) Turnover -1.04E-04 (0.001) -4.2E-04 (0.001) -4.4E-04 (0.001) Number of accounts -0.336 (0.326) -0.136 (0.332) -0.155 (0.332) Market factors Herfindahl -0.039 (0.039) -0.037 (0.039) -0.037 (0.040) Fee Ratio 5.09*** (1.465) 4.61*** (1.467) 4.81*** (1.472) Fund performance
Beat objective average -0.525 (0.386) Spread b/w average 1.817* (0.940) 1.867** (0.941) Adviser’s decisions Research Agreement -2.602*** (0.726) -2.431*** (0.725) -2.475*** (0.725) Derivatives used -1.612** (0.776) -1.560** (0.775)
Derivatives contractually allowed -1.123
(0.919) Number of service not reimbursed 0.021
(0.129)
-8.9E-04 (0.129)
-0.010 (0.130) Basis points reimbursement 0.014***
(0.005)
0.012** (0.005)
0.012** (0.005) Percent administrative cost -0.058***
(0.014) -0.056*** (0.014) -0.056*** (0.014) Number of Funds 174 173 174 R2 0.09 0.07 0.07
***, **, * indicate significance at 1%, 5%, 10% respectively. Standard deviations are given in parenthesis.
11
4.4 Limitations
Results suggest neither a form of causality nor an order of the factors. While determining the optimal advisory fee, each adviser is likely to give different weights to each factor but the results do not imply that the advisers favor one type of factors over another. Moreover, results should be interpreted carefully and not be taken as rejection of any alternative theory. Performance is a good example for this phenomenon. Results suggest that superior performance is rewarded by a higher advisory fee but they do not refute the alternative theory of performance improvement as a result of excess resource allocation. Furthermore, the advisory fee could be driven by some unaccounted factors. For example, the study does not fully capture the possible effect of the adviser marginal product. Any uncaptured difference between marginal products of the advisers could be partially responsible for the variation of advisory fee. However, this is minimized through the use of a panel model.
The data set is limited to actively managed equity funds. The literature documents qualitatively similar results between the fund characteristics and the advisory fee of different types of funds. Nevertheless, the relations between the advisory fee and other factors investigated in this study like market norms, superior performance and use of alternative portfolio techniques could be qualitatively and quantitatively different for other types of funds.
Finally, as Deli (2002) notes, there may be factors which have the potential to be substitutes for the advisory fee that are not observed such as the adviser’s ownership of the fund.
5. Conclusion
The determination of the advisory fee is based on, but not limited to, fund specific characteristics. Market norms as well as the choice of portfolio techniques and management decisions affect the adviser’s decision about the price of the professional portfolio management. Although the evidence suggests that the effect of market factors on the advisory fee is moderate, the adviser’s decisions that would reduce the cost of management or just manipulate the advisory fee without a fundamental change to the overall cost have relatively stronger impact on the advisory fee.
The advisers systematically adjust the advisory fee based on the objective average as it is commonly stated in fund proxies. However, this benefits the shareholders only when the objective average declines. I find that the improvement of adjusted performance or beating the benchmark index is not sufficient for the adviser to negotiate for an increase of the advisory fee. Advisers successfully signal superior managerial skills for additional mark-up if the fund beats the benchmark index or objective average by a significant spread. In a competitive market, the limited nature of the reduction of mark-up without altering the cost structure would enforce cost reduction in order to remain competitive. I show that advisers successfully use derivatives to reduce the cost of portfolio management or engage in research agreements partially to manipulate the advisory fee without necessarily changing the total cost.
I also show that besides the adviser’s decisions that are directly related to portfolio, advisers actively manage the advisory fee based on the outcomes of their management
decisions. The funds that report the gross administrative fee and gross advisory fee separate have lower advisory fees. Ex ante voluntary fee reimbursement affects the ex post contracting leading to higher advisory fee and the adviser increases the advisory fee if there is non-reimbursement for the compensation of independent directors and officers. There are several issues that require further research. While my results suggest that advisers reduce the advisory fee if they have research agreements, they do not provide insight on whether the shareholders benefit overall from the transfer of the cost of research from the advisory fee to the brokerage fee. The results do not address to what degree the persistence of superior performance requires allocation of additional resource and if superior performance covers the cost of this additional resource. Finally, the role of mutual fund boards in negotiating the advisory fee requires further attention.
References
BROWN, K., HARLOW, W., STARKS, L. (1996). Of tournament and temptations: an analysis of managerial incentives in the mutual fund industry. Journal of Finance, Vol.51, No.1, pp. 85-110.
CHRISTOFFERSEN, S. E. K. (2001). Why do money fund managers voluntarily waive their fees?. Journal of Finance, Vol.56, No.3, pp.1117-1140.
DEL GUERCIO, D., DANN, L. Y., PARTCH, M. M. (2003). Governance and board of directors in closed-end investment companies. Journal of Financial Economics, Vol.69, No.1, pp.111-152.
DELI, D. N. (2002). Mutual fund advisory contracts: An empirical investigation. Journal of Finance, Vol.57, No.1, pp.109-133.
DELI, D. N., VARMA, R. (2002). Contracting in the investment management industry: evidence from mutual funds. Journal of Financial Economics, vol.63, no.1, pp.79-98. DROMS, W. G., WALKER, D. A. (1994). Investment performance of international
mutual funds. Journal of Financial Research, Vol.17, No.1, pp.1-14.
EDELEN, R. M. (1999). Investor flows and the assessed performance of open-end mutual funds. Journal of Financial Economics, Vol.12, No.2, pp. 439-466
ELTON, E. J., GRUBER, M. J., DAS, S., HLAVKA, M. (1993). Efficiency with costly information: A reinterpretation of evidence from managed portfolios. Review of Financial Studies, Vol.6, No.1, pp.1-22
ELTON, E., GRUBER, M., BLAKE, C., (2003). Incentive fees and mutual funds. Journal of Finance, Vol.58, No.2, pp.779-804
FORTIN, R., MICHELSON, S. (1996). What mutual funds really return after taxes. Journal of Financial Planning, Vol.9, No.2, pp.60-65
FREEMAN, J. P., BROWN, S. L. (2001). Mutual fund advisory fees: The cost of conflicts of interest. The Journal of Corporation Law, Vol.26, No.3, 609-673. GRINBLATT, M., TITMAN, S. (1994). A study of monthly mutual fund returns and
performance evaluation techniques. Journal of Financial and Quantitative Analysis, Vol.29, No.3, pp.419-445
GRUBER, M. J. (1996). Another Puzzle: The growth in actively managed mutual funds. Journal of Finance, Vol.51, No.3, pp. 783-810
IPPOLITO, R.A. (1989). Efficiency with costly information: A study of mutual fund performance 1965-1984. The Quarterly Journal of Economics, vol.104, no.1, pp.1-23 IPPOLITO, R. A. (1992). Consumer reaction to measures of poor quality: Evidence
from the mutual fund industry. Journal of Law and Economics, Vol.35, No.1, pp.35-70
KHORANA, A., SERVAES, H. (1999). Determinants of mutual fund starts. Review of Financial Studies, Vol.12, No.5, pp.1043-1074.
KHORANA, A. (2001). Performance changes following top management turnover: Evidence from open-end mutual funds. Journal of Financial and Quantitative Analysis, Vol.36, No.3, pp.371-393
KHORANA, A., TUFANO, P., WEDGE L. (2005). Board structure, mergers and shareholders wealth: A study of mutual fund industry. working paper, Georgia Institute of Technology
KOSKI, J. L., POINTIFF, J. (1999). How are derivatives used? Evidence from the mutual fund industry. Journal of Finance, Vol.54, No.2, 791-816
KUHNEN, C. M. (2005). Dynamic Contracting in The Mutual Fund Industry. working paper, Stanford Graduate School of Business
LAPLANTE, M. (2001). Influences and trends in mutual fund expense ratios. Journal of Financial Research, Vol.24, No.1, pp.45-63.
LATZKO, D. A. (1999). Economies of scale in mutual fund administration. Journal of Financial Research, Vol.22, No.3, pp.331-339.
LATZKO, D. A. (2004). Mutual fund expenses. working paper, Pennsylvania State University
LUO G. Y. (2002). Mutual fund fee-setting, market structure and mark-ups. Economica, Vol.69, No.274, pp.245-271
MALHOTRA, D. K., MCLEOD R. W. (1997). An empirical analysis of mutual fund expenses. Journal of Financial Research, Vol.20, No.2, pp.175-190
MCLEOD, R., MALHOTRA D. (1994). A re-examination of the effect of 12b-1 plans on mutual fund expense ratios. Journal of Financial Research, Vol.17, No.2, pp.231-240
MURPHY, K. (1998). Executive compensation. working paper, University of Southern California
NETER, J., WASSERMAN, W., KUTNER, M. H. (1985). Applied linear statistical models (Second edition). Irwin, Homewood IL
REA, J. D., REID, B. K., MILLAR, K. W. (1999). Operating expense ratios, assets, and economies of scale in equity mutual funds. Investment Company Institute Perspective, No.5, 1-15
Security and Exchange Commission, Division of Investment Management (2000), Report on mutual fund fees and expenses. Available from: http://www.sec.gov/ news/ studies/ feestudy.htm [Last accessed August 6 2006]
SIRRI, E., TUFANO, P. (1998). Costly search and mutual fund flows. Journal of Finance, Vol.53, No.5, pp.1589-1622.
STARKS, L. T. (1987). Performance incentive fees: An agency theoretical approach. Journal of Financial and Quantitative Analysis, Vol.22, pp.17-32
SUTTON, J. (1991). Sunk cost and market structure. Cambridge, Mass: MIT Press TUFANO, P., SEVICK, M. (1997). Board structure and fee-setting in the U.S. mutual
fund industry. Journal of Financial Economics, Vol. 46, No.3, pp.321-355.
WARNER, J. B., WU, J. S. (2005). Changes in mutual fund advisory contracts. working paper, University of Rochester
ZHOU, X. (2001). Understanding the determinants of managerial ownership and the link between ownership and performance: comment. Journal of Financial Economics, Vol. 62, No.3, pp.559-571.