Received: October 26, 2015 Revision received: April 26, 2016 Accepted: May 9, 2016 OnlineFirst: August 5, 2016
Copyright © 2016 EDAM www.estp.com.tr
DOI 10.12738/estp.2016.4.0334 August 2016 16(4) 1349-1380 Research Article
Citation: Akçöltekin, A. (2016). Investigation of the effects of trainings on the development of high school teachers’ attitudes about scientific researches and project competitions. Educational Sciences: Theory & Practice, 16, 1349-1380. * This study is supported by the Commission of Scientific Research Projects of Ardahan University (Project number: 2014/08). 1 Correspondence to: Alptürk Akçöltekin (PhD), School of Physical Education and Sport, Ardahan University, Ardahan
75000 Turkey. Email: [email protected]
Abstract
The main purpose of this study is to develop positive attitudes in high school teachers towards scientific research and project competitions by training them in scientific research and project preparation subjects. The study group consists of 90 high school teachers. As a result of the study, a significant difference was found in favor of post-test scores of high school teachers about their attitudes towards both scientific research and project competitions (p < .05). Furthermore, the attitudes of teachers towards project competitions, evaluation of projects included in the project competitions, being a mentor in these competitions and behaviors of students, which were considered to be positively changed by project competitions, were determined to be developed in a positive way. In addition, high school teachers developed a more positive attitude towards researchers and scientific research and it was concluded that there was no difference between attitudes of teachers towards scientific research in terms of their gender and educational level. Prior to the study, there was a weak, positive and statistically insignificant correlation between attitudes of high school teachers towards project competitions and scientific research (r = 0.149; p > .05). On the other hand, a moderate, positive and significant correlation was determined between attitudes of high school teachers towards project competitions and scientific research as a result of the study (r = 0.319; p < .05).
Keywords
Scientific research methods attitude • High school teachers • Project competitions attitude
Alptürk Akçöltekin1 Ardahan University
Investigation of the Effect of Training on the
Development of High School Teachers’ Attitudes
Considering the competences of individuals in today’s society, there is a need for problem solving, research-oriented, questioning, productive, constructive and creative individuals who can approach incidents as a scientist (Michael, 2000). Many countries revise their science programs in order to equip individuals with 21st Century skills such as cooperation, critical thinking and creativity (Ravitz, Hixson, English, & Mergendoller, 2012). The most appropriate way to meet these skills is directing individuals to scientific research. The process of presenting scientific knowledge as a whole is called “scientific research” (Geray, 2006; Punch, 2005). The basic principle of scientific research is the inclusion of a planned work process and consists of a number of successive steps. The research process, starting with the identification of the problem includes identification of the methods to be employed, data collection, developing results and recommendations to solve the problem, and preparing a scientific report by including the conclusions reached and recommendations (Llewellyn, 2002). Since this process, called the scientific method, adopts the principle of obtaining the evidence at the point of rejection or verification of facts and principles presented, it may differ from other methods used to reach the information (Honer, Thomas, & Okholm, 2003). The most important tool in the development of scientific research competence in students are science fairs. Students exhibit their scientific projects during these science fairs. In science fairs, the projects submitted by students are reviewed by a jury (Abernathy & Vineyard, 2001; Bunderson & Anderson, 1996). Science fairs allow students, teachers, their friends and scientists, as well as other people in the society to come together and share scientific projects (Abenarty & Vineyard, 2001). Teachers are the main factor in increasing or reducing participation of students in science fairs (Fisanick, 2010). Teachers play an important role in terms of informing and guiding students through science fairs and scientific projects (Blenis, 2000). Students mention their teachers as a source of assistance in project competitions (Schapiro, 1997 as cited in Syer & Shore, 2001). If teachers have first-hand experience and information about scientific research, the interest of students in scientific research will eventually increase (LaBanca, 2008). Many teachers cannot teach students how to prepare a successful science fair project (Cook, 2003). Teachers don’t inform students about the research and project competitions and direct students only to conduct research without fulfilling the necessary guidance tasks in the research process (Akçöltekin, 2014). Teachers should have research and investigation, problem solving and critical thinking skills in order to transfer these skills to the next generation (Saracaloğlu, 2008). Teachers with research skills and positive attitudes towards scientific research and who can use research techniques and analyze scientific research can be trained with only research education offered by educational institutions. In this regard, teachers should be trained with research skills (Taşdemir & Taşdemir, 2011). In addition, since teachers have important responsibilities in terms of spreading the research culture to the social base and giving
a scientific perspective to the students, they should have a positive attitude towards both research and researchers (Korkmaz, Şahin, & Yeşil, 2011a).
Project applications provide the opportunity to learn by living and gain the ability to conduct scientific research (Raghavan, Coken-Regev, & Strobel, 2001). Projects may have some disadvantages due to the time consuming, complex and extensive structures of them that require some effort (Thomas, 2000). According to Çepni (2007) the disadvantages of projects include increasing workload and responsibilities of teachers, that they may increase the time spent for learning, and an extreme deviation and disintegration could be observed if boundaries of the research are not well-defined (p. 121). Teachers are required to have sufficient theoretical knowledge and experience in the scientific research projects in order to manage the teaching-learning process effectively (Frank & Barzilai, 2004). The project preparation process provides gains for both the students and the teachers in many ways. However, this process is long and difficult to complete. The main causes of these problems are inadequate management of this process (Küfrevioğlu, Baydaş, & Göktaş, 2011). According to the results of the study, a very significant majority of the teachers come to teacher training programs without any project experience (Roth 1999; Shapiro, 1996; Windschilt, 2003), they had difficulties in the process of implementation of projects (Tural, Yiğit, & Alev, 2009), they didn’t receive sufficient guidance in the process and do not have enough information regarding the project stages (Baki & Bütüner, 2009). Teachers with a masters of science degree see themselves as inadequate in the projects (Arslan, 2010) and the vast majority of prospective teachers experience difficulties in the identification of the research problem, experimental design process and determining variables in the projects (Roth, 1999; Shapiro, 1996). These problems arise because teachers don’t receive any practical training related to projects during university years (Baki & Bütüner, 2009).
Teachers are not adequately informed about their roles in the project period (NRC, 2000) and this is seen as an indication that teachers do not have enough pedagogical information about the projects (Frank & Barzilai, 2004). Güven (2013) indicates that a course named “project applications” should be offered to prospective teachers to inform them about project applications. Önen, Mertoğlu, Saka, and Gürdal (2010) suggest that teachers should be encouraged about projects. Bulunuz (2011) states that participations rates of teachers in the projects should be increased by providing institutional and in-service practical training activities for teachers who will be a part of these projects. Çakmakcı (2009) suggests that studies investigating the effectiveness of programs offered to teachers and prospective teachers to provide them a researcher identity are insufficient and new applications should be administrated to teachers and prospective teachers in different majors to provide them a researcher identity. Küfrevioğlu et al. (2011) suggest that in-service training programs can be offered to teachers in summer breaks to increase their awareness. Önen et al. (2010), Erdem, Uzal, and Ersoy (2007)
state that teachers are positively affected by the project implementation period with activities included in this period, and they consider participating in project activities and have fun doing these activities and gain competence to prepare projects. Akçöltekin (2014) suggests that necessary measures should be taken to eliminate the problems faced during the project implementation period by conducting studies with regard to attitudes of students and teachers towards conducting scientific research and students’ participation in scientific project competitions. In the literature, there are several studies suggesting that attitudes, behaviors and skill levels of teachers have decisive influence on students (Kılıç & Acat, 2007; Oruç & Ulusoy, 2008).
Considering the relevant literature, one of the most important elements in improving students’ competence in scientific research is found to be project competition. Teachers have huge responsibilities in students’ participation in the project competitions. On the other hand, both teachers and prospective teachers are not well-equipped in scientific research methods and the basic steps of the scientific projects; therefore, there is a common conclusion suggesting that they develop a negative attitude towards scientific research methods and project competitions. Attitudes affect the intent of the behavior, and intent of the behavior shapes the actions (Ajzen, 2005; Kollmuss & Agyeman, 2002). Attitude serves as a mediating variable between behaviors and values (McCarty & Shruni, 1993). Individuals who have a positive attitude about a subject behave more responsibly towards the issue compared to those with negative attitudes (Hines, Hungerford, & Tomera, 1987). Thus, attitude is an important factor that can be used to measure the relationship between values and behaviors (Kim & Choi, 2005). As a result of the study, it is thought that attitudes of high school teachers towards project competitions are affected by their negative attitudes towards scientific research and scientific projects; and this is considered one of the causes of possible problems arising in high school students’ participation in scientific project competitions.
The main purpose of this study is to make a positive change in the attitudes of high school teachers towards scientific research methods and project competitions by informing them about scientific research methods and scientific research
For this purpose, the following sub-problems were intended to be answered: 1) What is the impact of the study on teachers’ attitudes towards project competitions? 2) Is there a statistically significant difference between teachers’ attitudes towards
project competitions before and after the study in terms of their a. Gender
3) Is there a correlation between teachers’ attitudes towards project competitions and scientific research prior to the study?
4) What is the impact of the study on teachers’ attitudes towards scientific research? 5) Is there a statistically significant difference between teachers’ attitudes towards
scientific research before and after the study in terms of their a. Gender
a. Education Level
6) Is there a correlation between teachers’ attitudes towards project competitions and scientific research after the study?
Method Research Model
This study was conducted by using the pretest and posttest model, which is a pre-experimental research models (Karasar, 1991). In a single group pretest-posttest model, the variable is applied on a randomly selected group. The symbolic view of the model is as follows:
G1 O1.1 X O1.2
G1 O2.1 X O2.2
G1: Research Group, O1.1: First measurement (Pretest), X: Independent Variable (Educational Activities), O1.2: Second Measurement (Posttest)
G1: Research Group, O2.1: Second Measurement (Pretest), X: Independent Variable (Educational Activities), O2.2: Second Measurement (Posttest)
In the model, if O1.2 > O1.1 and O2.2 > O2.1, this is considered to be caused by X application, and evaluated accordingly. In this study, the “Project Competition Attitude Scale” and “Scientific Research Attitude Scale” was applied on 90 high school teachers as the pretest in order to determine the change in their attitudes towards project competitions and scientific research. A total of 90 teachers selected from high schools located in the city center and other districts of the city were trained for 8 hours on scientific research methods and project competitions. At the end of the study both the “Project Competition Attitude Scale” and “Scientific Research Attitude Scale” were administrated to teachers as the posttest and the difference between scores obtained from these two scales were compared in order to see whether there is a statistically significant difference (p < .05). In addition, the correlation between
scores of the “Project Competition Attitude Scale” and “Scientific Research Attitude Scale,” which were administrated prior to the study, and the correlation between scores of the “Project Competition Attitude Scale” and “Scientific Research Attitude Scale,” which were administrated after the study, were investigated.
Study Group
The study group consists of a total of 90 teachers from 9 different branches (Mathematics, Computers, Geography, Biology, Sociology, Chemistry, Physics, History and Psychology) in high schools operating under the Ardahan Provincial Directorate of Education in the 2014-2015 academic year. In this study, the criterion sampling method, which is a known sampling method, was used. The sampling method allows researchers to investigate subjects with rich information in detail (Patton, 1997). The basic understanding of the criterion sampling method is studying all cases that meet a set of predetermined criteria. The aforementioned criterion or criteria can be defined by the researcher or a previously prepared list of criteria can be used (Yıldırım & Şimşek, 2006). The criterion of this study is teachers, who can attend a science fair organized by TÜBİTAK, from 9 different branches. The demographic information of the teachers which participated in the study are presented in Table 1.
Table 1
Demographic Characteristics of Teachers
Gender f % Male 48 53.3 Female 42 46.7 Total 90 100 Education Undergraduate 63 70 Graduate 27 30 Total 90 100 Field of Study Mathematics Teaching 26 28.9 Computer Teaching 10 11.1 Geography Teaching 10 11.1 Biology Teaching 10 11.1 Sociology Teaching 4 4.4 Chemistry Teaching 7 7.8 Physics Teaching 8 8.9 History Teaching 13 14.4 Psychology Teaching 2 2.2 Total 90 100
Considering the demographics of the teachers presented in Table 1; 48 (53.3%) of the teachers are men and the remaining 42 (46.7%) teachers are women; 63 (70%) of them have graduated from universities, and the remaining 27 (30%) teachers hold a masters
of science degree, respectively. Considering the branches of the teachers; 26 (28.9%) of them are teaching Mathematics, 10 (11.1%) Computer, 10 (11.1%) Geography, 10 (11.1%) Biology, 4 (4.4%) Philosophy, 7 (7.8%) Chemistry, 8 (8.9%) Physics, 13 (14.4%) History and the remaining 2 (2.2%) teachers are Guidance teachers, respectively. Data Collection Tool
Project Competitions (Science Fair) Teacher Attitude Scale. In the study, the “Project Competition Attitude Scale for Teachers,” which was developed by (Tortop, 2013a), was used to collect the data after receiving written approval from the developer of the scale in an e-mail. The 5-point Likert type scale consists of 19 items and 5 factors. In the scale, the positive answers were coded as “I totally agree,” “I agree,” “I haven’t decided yet,” “I disagree,” and “I strongly disagree,” corresponding to a rating system (5, 4, 3, 2 and 1); and the negative answers were coded by following the opposite scoring system (1, 2, 3, 4 and 5). Some of the items in the scale (6, 7, 8, 9, 10, 11, 12, 13, 14, 15, 16, 17, 18 and 19) were coded in reverse due to the negative expressions in the answer, while some other items (1, 2, 3, 4 and 5) were coded normally. (n-1)/n formula was used to have evenly spaced intervals for the rating of the scale and the score corresponding to each space was calculated as 0.80. In this way, the system consisted of rates as 1.00-1.80 for “I strongly disagree,” 1.81-2.60 for “I disagree,” 2.61-3.40 for “I haven’t decided yet,” 3.41-4.20 for “I agree,” and 4.21-5.00 for “I totally agree,” respectively. The lowest score that can be obtained from the scale was determined as 19, while the highest score was 95. Considering the items and factors in the scale; there are 6 items about development of the students (1, 2, 3, 4, 5 and 6), 5 items about importance of education (7, 8, 9, 10 and 11), 3 items about evaluation (12, 13 and 14), 2 items about negative behaviors (15 and 16) and 3 items about mentorship (17, 18 and 19), respectively. The overall Cronbach’s alpha reliability coefficient of the scale was found to be 0.87. The overall factor loads of the scale ranged from 0.458 to 0.868 and explains 51.37% of total variance. The Cronbach’s alpha reliability coefficient of the “Student’s Development” dimension was found to be 0.82, factor loads of this dimension ranged from 0.458 to 0.820 and explains 15.14% of total variance; the Cronbach’s alpha reliability coefficient of the “Importance of Education” dimension was found to be 0.84, factor loads of this dimension ranged from 0.592 to 0.777 and explains 14.09% of total variance; the Cronbach’s alpha reliability coefficient of the “Evaluation” dimension was found to be 0.70, factor loads of this dimension ranged from 0.505 to 0.826 and explains 7.83% of total variance; the Cronbach’s alpha reliability coefficient of the “Negative Behaviors” dimension was found to be 0.76, factor loads of this dimension ranged from 0.715 to 0.868 and explains 7.35% of total variance; the Cronbach’s alpha reliability coefficient of the “Mentorship” dimension was found to be 0.66, factor loads of this dimension ranged from 0.582 to 0.671 and explains 6.93% of total variance, respectively.
Scientific Research Attitude Scale. In the study, the “Scientific Research Attitude Scale,” which was developed by Korkmaz et al. (2011a) in order to determine attitudes of prospective teachers towards scientific research, was used to determine attitudes of teachers towards scientific research. The 5-point Likert type scale consists of 30 items and 4 factors. In the scale, the positive answers were coded as “I totally agree,” “I agree,” “I haven’t decided yet,” “I disagree,” and “I strongly disagree” that correspond to a rating system (5, 4, 3, 2 and 1); and the negative answers were coded by following the opposite scoring system (1, 2, 3, 4 and 5).
Considering the findings about factors in the scale; the factor “Being Reluctant to Help Researchers” consists of 8 items (1, 2, 3, 4, 5, 6, 7 and 8) and its factor loads range between 0.560 and 0.748. The eigenvalue of this factor in the overall scale is 6.392; its contribution to the general variance is 13.491%. The factor “Negative Attıtude towards Research” consists of 9 items (9, 10, 11, 12, 13, 14, 15, 16 and 17) and its factor loads range between 0.542 and 0.686. The eigenvalue of this factor in the overall scale is 3.453; its contribution to the general variance is 12.597%. On the other hand, the factor “Positive Attitude towards Research” consists of 7 items (18, 19, 20, 21, 22, 23 and 24) and its factor loads range between 0.447 and 0.799. The eigenvalue of this factor in the overall scale is 2.333; its contribution to the general variance is 10.910%. The factor “Positive Attitude towards Researchers” consists of 6 items (25, 26, 27, 28, 29 and 30) and its factor loads range between 0.561 and 0.753. The eigenvalue of this factor in the overall scale is 1.724; its contribution to the general variance is 9.343%. The Cronbach’s alpha reliability coefficients of the scale were determined as 0.85, 0.81, 0.80 and 0.76, respectively. Considering the goodness of fit values obtained as a result of first and second level confirmatory factor analyses; the goodness of fit values obtained for first level confirmatory factor analysis were χ2 (sd = 399, N = 372) = 816.14, p < .001, RMSEA = 0.053, S-RMR = 0.047, GFI = 0.90, AGFI = 0.85, CFI = 0.95, NNFI = 0.95, IFI = 0.94; whereas the goodness of fit values obtained for second level confirmatory factor analysis were χ2 (sd = 401, N = 372) = 830.28, p < .001, RMSEA = 0.054, S-RMR = 0.051, GFI = 0.90, AGFI = 0.85, CFI = 0.95, NNFI = 0.95, IFI = 0.94, respectively.
Before conducting the study, the scale, which was developed to determine attitudes of prospective teachers towards scientific research, was used by performing its adaptation studies on 378 high school teachers in order to determine their attitudes towards scientific research. The findings of the scale were presented under “Adaptation of the Scale.”
Adaptation of the scale. Before conducting the study, the scale, which was developed to determine attitudes of prospective teachers towards scientific research, was used by performing its adaptation studies on 378 high school teachers in order to
determine their attitudes towards scientific research. The findings of the scale were presented under “Adaptation of the Scale”. First, exploratory factor analysis was applied on the data obtained. The goodness of fit values of the model were determined by applying first and second level confirmatory factor analyses on the data obtained from exploratory factor analysis.
Findings of the Exploratory Factor Analysis
Factor analysis was used to validate the measurement tool used (Büyüköztürk, 2007). Factor analysis is the most powerful method to examine the construct validity and factor analysis requires less factors by bringing the variables measuring the same quality together (Tabachnick & Fidell, 2001). First, exploratory factor analysis (EFA) was performed on variables in order to test the construct validity of Scientific Research Attitude Scale. The data was analyzed with Kaiser-Meyer-Olkin (KMO) and Bartlett Tests for testing their compliance to the data structure for factor analysis in terms of sample size. The results of exploratory factor analysis, which was performed to test the construct validity of the scale are as follows; KMO= 0.898; Barlett test value χ2 = 8260.580; sd = 435 (p = .000). In behavioral science, since KMO values greater than or equal to 0.60 are deemed sufficient to perform factor analysis (Büyüköztürk, 2010), factor analysis can be performed on the scale that consists of 30 items. As a result of the factor analysis, since factor loads of M1, M3, M22, M6, M7, M8 and M11 were below 0.40 after the rotation process, they were excluded from the scale (Sipahi et al., 2010). When factor analysis was reapplied on the resulting new scale factors, M24 was found to be comorbid in the 1st and 3rd factors and they were removed from the scale where the difference between their factor loads was not 0.100. As a result of the analysis performed, if the difference between two factors is not higher than 0.100, they should be excluded from the scale since it is considered as an indication of disintegration of the two factors (Balcı, 2009; Büyüköztürk, 2002). According to the repeated factor analysis on scale items, KMO = 0.864, χ2 = 5487.977; sd = 253 (p = .000) and items of the scale were found to be explaining 62 219% of the total variance. The item total correlation of resulting 4-factor scale was found to range between 0.488 and 0.873 and the total Cronbach’s alpha reliability coefficient of the scale was determined to be 0.86.
Considering the reliability coefficients of items, factor load intervals of these items and factors of the resulting four-factor scale; the first factor was found to range from 0.700 to 0.873 and the reliability coefficient was found to be 0.92; the second factor was found to range from 0.542 to 0.785 and the reliability coefficient was found to be 0.84; the third factor was found to range from 0.505 to 0.797 and the reliability coefficient was found to be 0.79; the fourth factor was found to range from 0.488 to 0.808 and the reliability coefficient was found to be 0.77, respectively.
The items included in the scientific attitude scale as a result of exploratory factor analysis given to 5 different faculty members from 4 different universities, who are specialized in the field of scientific research methods at both undergraduate and graduate level, in order to receive their opinions about content validity of the scale. As a result of positive feedback suggesting that these items serve the purpose of the study received by these experts, it has been concluded that these items can be used to determine attitudes of teachers towards scientific research. Content validity shows whether the desired characteristic to be measured is adequately represented by the items included in the measurement tool (Erkuş, 2001; Öner, 1997). Content validity of the scale shows to what extent the scale and items included in the scale serve the purpose of the study (Ercan & Kan, 2004). Receiving expert opinion is one of the common methods used to determine content validity representing adequacy of the items both quantitatively and qualitatively (Kurnaz & Yiğit, 2010). The form of content validity should be given to at least three experts and these experts should evaluate the form independently (Erefe, 2002).
Considering the correlation values between factors of the four-factor scale; there is a weak and negative correlation between F1 and F2 (r= -.392; p < .001), there is a moderate and positive correlation between F1 and F3 (r = 0.544; p < .001), there is a weak and negative correlation between F1 and F4 (r = -.324; p < .001), there is a moderate and negative correlation between F2 and F3 (r = -.504; p < .001), there is a weak and negative correlation between F3 and F4 (r = -.320; p < .001) and lastly there is a weak and positive correlation between F2 and F4 (r = 0.430; p < .001), respectively. If the correlation coefficient (r) is between 0.00-0.25, there is a very weak relationship between variables; if it is between 0.26-0.49, there is a weak relationship; if it is between 0.50-0.69, there is a moderate relationship; if it is between 0.70-0.89, there is a strong relationship and if it is between 0.90-1.00, there is a very strong relationship between variables (Kalaycı, 2005). The weak correlation between factors shows that factors are independent from each other and it supports the factor structure. As a result of these operations, the findings related to item loads, eigenvalues of the factors, their degree to explain variance and reliability values are presented in Table 2.
As seen in Table 2, the first factor of the scale “Positive Attitudes towards Researchers” consists of 6 items with an eigenvalue of 4.568 and 19.862% contribution to the general variance; the second factor of the scale “Being Reluctant to Help Researchers” consists of 6 items with an eigenvalue of 3.655 and 15.896% contribution to the general variance; the third factor of the scale “Positive Attitudes towards Research” consists of 5 items with an eigenvalue of 3.051 and 13.264% contribution to the general variance and the fourth factor of the scale “Negative Attitudes towards Researches” consists of 5 items with an eigenvalue of 3.036 and 13.199% contribution to the general variance, respectively. Considering the total
scale, 62.219% of total variance is explained by the factors of the scale. According to Tavşancıl (2002), the variance rates between 40% and 60% are considered adequate in the analysis of social sciences.
Table 2
Results of the Factor Analysis
Factors İtem No İtems F1 F2 F3 F4 α
(Factor 1) Positive Attitudes Towards Resear chers
M28 Scientists are always open for self-development and new developments .873 M27 Scientists should have high predictive power. .866
M26 Scientists should think universally with objective, intel-lectual and moral responsibilities. .845 .927 M25 Scientists are honest, knowledgeable, productive, and respectful people. .823
M30 Scientists are respectful people who try to understand and tell glorious mysteries of the universe. .801 M29 Scientists don’t act contrary to the ethical rules no matter what happens. .700
(Factor 2) Unwillingness for Helping the Resear chers
M2 I don’t want to contribute to scientific research since our opinions are not taken into account. .785 M9 I find research results unreliable due to the collection of information in a narrow space. .756 M5 I don’t want to contribute to scientific research since our opinions are not taken into account. .673
M10 I think there is a problem in the sources where data is col-lected, therefore I don’t rely on scientific research results. .624 .841 M4 I don’t not want to help scientific researchers because they work to get a title in general. .587
M13 I find research results unreliable since the data is collect-ed from limited resources. .542
(Factor 3) Positive Attitudes for Resear ch’
s M19M20 I take pleasure in doing scientific research.I like reading scientific research. .797.762
M21 I try to solve my problems by using scientific research methods. .668 .794 M23 I would like to do scientific research if someone gives me the opportunity. .599
M18 Research is part of my field of interest. .505
(Factor 4) Negative Attitudes towards Resear ches
M16 I find research consuming too much time unnecessary. .808 M15 Development and change takes place automatically. Be-cause of this there is no need for scientific research .800 M12 It is enough to know history. There is no need to make new research. .792 .778 M14 Scientific research is part of the natural sciences; it can-not be in social sciences. .579
M17 Research results often worry me. .488
Eigenvalues: 4.568 3.655 3.051 3.036 Explained Variance: 19.862 15.896 13.264 13.199
First and Second Level Confirmatory Factor Analysis
As a result of the first level confirmatory factor analysis, the goodness of fit values were found as χ2(sd, N)= 650.46 (203, 378), χ2/sd = 3.204, RMSEA = 0.076, S-RMR = 0.061, AGFI = 0.83, NFI = 0.90, NNFI = 0.92, CFI = 0.93 and IFI = 0.93. The goodness of fit values were found as χ2(sd, N) = 513.22 (200, 378), χ2/sd = 2.566,
RMSEA = 0.064, S-RMR = 0.056, AGFI = 0.86, NFI = 0.95, NNFI = 0.95, CFI = 0.94 and IFI = 0.94 after making modifications on the items (F1_2 and F1_1; F2_4 and F2_2 and F2_6 and F2_2) in the first level confirmatory factor analysis. According to the data obtained, they have acceptable goodness of fit values. In other words, this model shows that the factors included in the scale are confirmed by the data. The factorial model and t values of the relationship between factors-items obtained as a result of the first level confirmatory factor analysis are presented in Figure 1.
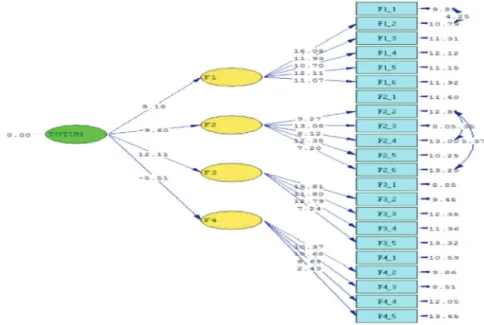
The second level confirmatory factor analysis was performed in order to show that the dimensions “Positive Attitudes towards Researchers,” “Being Reluctant to Help Researchers,” “Positive Attitudes towards Research,” and “Negative Attitudes towards Research,” which were obtained by the first level confirmatory factor analysis, represent a higher concept. The latent variables obtained by the first level confirmatory factor analysis were used as the basis of this model. In this model, it has been shown that the attitude variable was explained by the first level variables with variances. The first level confirmatory structure was tested by 4 latent and 22 indicator variables and second
level attitude latent variable is added to this structure and the goodness of fit values were found to be χ2/sd, N (653.71, sd = 205, N = 378), RMSEA = 0.076, S-RMR = 0.062, GFI = 0.86, AGFI = 0.083, CFI = 0.93, NNFI = 0.92, IFI = 0.93, NFI = 0.90. The goodness of fit values were found as χ2/sd, N(517.32, sd = 202, N = 378), RMSEA= 0.064, S-RMR = 0.058, GFI = 0.89, AGFI = 0.086, CFI = 0.95, NNFI = 0.95, IFI = 0.96, NFI = 0.95 after making modifications on the items (F1_2 and F1_1; F2_4 and F2_2 and F2_6 and F2_2) in the second level confirmatory factor analysis.
The values obtained indicate that data is sufficient for the model (Lewis et al., 2002; Olivares et al., 2004). The connection diagram of the second level confirmatory factor analysis and t-values are presented in Figure 2.
The first level variables in the model and second level variable “scientific research attitude” and factor loads between them (λx), t values, measurement errors (delta, δ) and explanation rates of second level variables on the first level variables (R2) are given in Table 4.
Table 3
Second Level Confirmatory Factor Analysis Values of the Scale
Second Level Variables First Level Variable λx δ coefficient (Measuring Error) t R2
F1 0.58 0.52 9.18 0.40
Scientific Research Attitude F2 0.72 0.49 -9.60 0.52
F3 0.84 0.29 12.11 0.71
F4 0.39 0.85 -5.51 0.15
As it can be seen in Table 3, considering the coefficients and t values between second level attitude latent variable and first level (λx = 0.58; p < .05; t = 9.18) and third level latent variables; there is a positive and significant relationship between attitude and first and third factors; and there is a negative and significant relationship between second (λx = 0.72; p < .05; t = -9.60) and fourth (λx = 0.39; p < .05; t = -5.51) factors. If the t value is higher than 1.96, the significance level is accepted as p = .05 and if it is higher than 2.56, then the significance level is accepted as p = .001, respectively (Schumacker & Lomax, 2010). In this model, t values of all items and t values of all factors in these items should be significant to have an acceptable model. Considering the variances explained by second level attitude latent variables in the first level variables, the most positive attitude towards research in the first level variables was found as (R2 = 0.71) and the least positive attitude towards research in the first level variables were found as (R2 = 0.15), respectively. The determination coefficient (R2) should be defined like other fit indices in other research. (R2) is defined as the variance explained and it is a coefficient which determines to what extent changes in the latent variables of indicator variables are explained (Kelloway, 1998). If the value of (R2) is below 0.2, it is weak; if it is between 0.2 and 0.4, then it is moderate and lastly if it is higher than 0.4, then it is considered strong (https://www.american.edu/ctrl/ p. 4).
Discrimination of the Items
In this part of the study, item discrimination levels are determined by calculating the correlations between scores obtained from each item in the factors and scores obtained from factors according to the item total correlation method. The item discrimination index indicates to what extent individuals are distinguished in regard with the characteristics of the items. In other words, this test is used to distinguish individuals with a high and low level of pre-defined characteristics (Büyüköztürk, Çakmak, Akgün, Karadeniz, & Demirel, 2010). Item-factor correlation values obtained for each item in the scale are presented in Table 4.
Table 4
Item Factor Scores Correlation Analysis
F1 F2 F3 F4
Item No r Item No r Item No r Item No r
28 0.901** 2 0.784** 19 0.823** 16 0.717** 27 0.866** 9 0.749** 20 0.791** 15 0.713** 26 0.905** 5 0.772** 21 0.755** 12 0.758** 25 0.890** 10 0.676** 23 0.754** 14 0.717** 30 0.838** 4 0.728** 18 0.604** 17 0.430** 29 0.755** 13 0.655** N = 378, p < .001.
As seen in Table 4, item test correlations range between 0.755 and 0.905 for the first factor, 0.655 and 0.784 for the second factor, 0.604 and 0.823 for the third factor
and 0.430 and 0.758 for the fourth factor, respectively. Each item in the factors has a significant and positive relationship with the items of the sub-scales (p < .001). These coefficients are validity coefficients of each item in the scale and they represent the consistency of the scale.
The first factor of the scale “Positive Attitude towards Researchers” consists of 6 items (25, 26, 27, 28, 29 and 30), the second factor of the scale “Being Reluctant to Help Researchers” consists of 6 items (2, 9, 5, 10, 4 and 13), the third factor of the scale “Positive Attitudes towards Research” consists of 5 items (19, 20, 21, 23 and 18) and the fourth factor of the scale “Negative Attitudes towards Research” consists of 5 items (16, 15, 12, 14 and 17), respectively. (n-1)/n formula was used to have evenly spaced intervals for the rating of the scale and the score corresponding to each space was calculated as 0.80. In this way, the system was rates as 1.00-1.80 for “I strongly disagree,” 1.81-2.60 for “I disagree,” 2.61-3.40 for “I haven’t decided yet,” 3.41-4.20 for “I agree” and 4.21-5.00 for “I totally agree”, respectively. The lowest score that can be obtained from the scale was determined as 22, while the highest score was 110.
In the scale, the positive answers were coded as “I totally agree,” “I agree,” “I haven’t decided yet,” “I disagree,” and “I strongly disagree” that are corresponding to a rating system (5, 4, 3, 2 and 1); and the negative answers were coded by following the opposite scoring system (1, 2, 3, 4 and 5). Accordingly, items in the 1st and 3rd factors of the scale are coded regularly because they include positive statements; and the high score obtained from the 1st factor of the scale shows that positive attitudes of teachers towards researchers are increased while the high score obtained from 3rd factor of the scale shows that positive attitudes of teachers towards research are increased. The items in the 2nd and 4th factors of the scale are coded irregularly because they include negative statements; and high scores received from these factors indicate that negative attitudes are reduced and positive attitudes are increased. According to this, the high score obtained from the 2nd factor of the scale show that negative attitudes of teachers towards helping researchers are decreased and their positive attitudes are increased; and the high score obtained from the 4th factor of the scale show that negative attitudes of teachers towards research are decreased and their positive attitudes are increased.
Structure of the Study
This study was conducted on a total of 90 teachers from 9 difference branches (Mathematics, Computers, Geography, Biology, Sociology, Chemistry, Physics, History and Psychology) in high schools operating under the Ardahan Provincial Directorate of Education in the 2014-2015 academic year between 25/05/2015- 29/05/2015. In this study, the “Project Competition Attitude Scale” and “Scientific Research Attitude Scale” was applied on high school teachers as the pretest in order to determine the change in
their attitudes towards project competitions and scientific researches. Then, they were informed about the subject to be covered during the study. The study lasted 8 hours in total to avoid disrupting their educational programs described in the curriculum. In the first 4 hours of the study, teachers were informed about scientific research methods by using educational materials developed in accordance with contents of International Institute for Educational Planning (2005) and Research Methods in Education (2012). In the remaining 4-hour period, the educational materials, which were developed in accordance with contents of Ministry of National Education Lifelong Learning General Directorate of Project Preparation Guide (2013) and TÜBİTAK 45th Secondary Students
Research Project Competition Project Guide (2014), were used.
In the 1st hour of the application phase, teachers were informed about Basic Concepts and Research Stages in Scientific Research. In the 2nd hour, they were informed about Scientific Research Methods and Research Designs. In the 3rd hour, they were informed about preparation and application of Data Collection Tools and in the 4th hour, data analysis techniques and reporting the data obtained were discussed; and the first 4-hour period of the application was completed by allowing teachers to share their experiences by interacting with each other. In the 5th hour of the application phase, they were asked “What is the Project?” and informed about general and specific objectives of the project, main features of the project, project writing process and responsibilities of teacher during the project. In the 6th hour, they were informed about rationale, limitations, duration of the project, activities and details of these activities. In the 7th hour, they were informed about project outcomes, sustainability, performance indicators and logical framework. In the 8th hour, two completed projects in the area of social sciences were explained step by step to achieve the integrity and then the “Project Competitions Teacher Attitude Scale” and “Scientific Research Attitude Scale” were administrated on teachers as the posttests. Data Analysis
Distribution of the data was examined in order to see whether it were distributed normally before comparing pretest-posttest data. In such cases, the Shapiro-Wilk test is used for groups smaller than 50 people and the Kolmogorov Smirnov test is used for groups larger than 50 to examine the normal distribution (Büyüköztürk, 2007; Köklü, Büyüköztürk, & Bökeoğlu, 2006). The findings obtained are presented in Table 5.
Table 5
Kolmogorov-Smirnov Test Results
Kolmogorov Smirnov Test Pre-Test (N = 90) Post-Test (N = 90) Project Competition Attitudes 0.175>0.05 0.843>0.05 Scientific Research Attitudes 0.184>0.05 0.317>0.05
Considering the Kolmogorov-Smirnov test results of teachers presented in Table 5, the data of pretest-posttest of project competitions attitude scale and scientific research attitude scale are found to be distributed normally (p > .05) and they can be analyzed by using parametric statistical techniques. A paired samples t-test was used to determine whether the difference between pretest-posttest scores of teachers received from the entire scale and project competitions attitude scale and scientific research attitude scale is statistically significant. A paired samples t-test is used to test whether the difference between average values of two samples is significant. In order to use the t-test for related samples, the score of the dependent variables should be at least interval scale and the difference scores associated with set points should have a normal distribution. In experimental studies, when measurements of the subjects related to the dependent variable are taken before and after experimental operations, repeated time-dependent measurements of the subjects are required. In this case, the measurements obtained are related and it is convenient to use a t-test for related groups in the analysis phase due to the repeated measurements (Büyüköztürk, 2010). Pearson correlation analysis was performed in order to determine the correlation between pretest-posttest attitude scores of teachers towards project competitions and scientific research. The correlation coefficient is used to find the extent of the relationship between two variables and interpret this relationship. Pearson’s correlation coefficient requires two continuous variables with normal distribution together (Büyüköztürk, 2014). The effect size (η2) correlation coefficient was calculated in order to investigate the effect of the activities performed during the research on the attitudes of teachers towards project competitions and scientific researches. The effect size is used to determine the effect of independent variable on dependent variable (Akbulut, 2010; Büyüköztürk, 2007, 2010). In addition, an unrelated samples t-test was used to determine the statistical change of attitudes of teachers towards project competitions and scientific researches and pretest and posttest scores from the entire scale and sub-scales according to their gender and educational level. This test is a parametric test used to test the significance between averages values of two independent variables. In order to use an independent samples t-test, two samples groups should be unrelated, the dependent variable should be measured at an interval or ratio scale level, and raw scores of populations representing each sample should have a normal distribution (Büyüköztürk, Çokluk, & Köklü, 2011).
Findings
In this part of the study, in addition to determination of the statistical change of attitudes of teachers towards project competitions and scientific research during the study and pretest and posttest scores from the entire scale and sub-scales according to their gender and educational level, the statistical change of attitudes of teachers towards scientific research during the study in the entire scale and all other factors
of the scale was investigated according to their gender and educational level. Distribution of pretest-posttest scores of teachers received from the entire attitude scale and factors included in the scale are presented in Table 6.
Table 6
Pretest-Posttest Results of Project Competition Teacher Attitude Scale
Dimensions of the Scale Group N X Ss sd t p η2
The Overall Scale Post-TestPre-Test 9090 3.683.84 .437.391 89 -3.602 .001* .067 Student Development Post-TestPre-Test 9090 4.274.32 .500.434 89 -.997 .321 -The Importance of Education Pre-Test 90 4.23 .680 89 -1.174 .862
-Post-Test 90 4.24 .628
Evaluation Post-TestPre-Test 9090 1.872.14 .667.885 89 -2.567 .012* .035 Negative Behavior Post-TestPre-Test 9090 3.804.04 .816.693 89 -2.331 .022* .029
Mentoring Pre-Test 90 3.35 .771 89 -4.632 .000* .100
Post-Test 90 3.78 .698
As can be seen in Table 6, the arithmetic average of pretest scores of teachers received from project competitions teacher attitude score was found as (X = 3.68), while the arithmetic average of posttest scores of teachers received from project competitions teacher attitude score was found as (X = 3.84), respectively. According to these results, there is an increase in favor of the posttest scores; thus, there is a statistically significant difference between pretest-posttest scores of the group (t(89) = -3.602; p < .05). Considering the relationship between factors of project competition teacher attitude scale and pretest-posttest scores of teachers, there is no significant difference between development of the students and importance of education dimensions and pretest-posttest scores of teachers. On the other hand, the arithmetic average of pretest scores of teachers received from evaluation dimension was found as (X = 1.87) and the average posttest scores was found as (X = 2.14), respectively. According to these results, there is an increase in favor of the posttest scores; thus, there is a statistically significant difference between pretest-posttest scores of the group (t(89) = -2.657; p < .05). In the negative behavior dimension, the average pretest score of teachers was found as (X = 3.80) and the average posttest score of teachers was found as (X = 4.04), respectively. Thus, there is an increase in favor of the posttest scores and there is a statistically significant difference between pretest-posttest scores of the group (t(89) = -2.331; p < .05). Finally, in the mentorship dimension of the scale, the average pretest score of teachers was found as (X = 3.35) and the average posttest score of teachers was found as (X = 3.78), respectively. There is a statistically significant difference between pretest-posttest scores of the group (t(89) = -4.632; p < .05). At this point, considering the effect size of entire scale and factors included in the scale (η2); the effect size was found as (η2 = .067) in the entire scale, it was
found as (η2 = .035) in the evaluation dimension, (η2 = .029) in the negative behavior dimension and (η2 =.100) in the mentorship dimension, respectively. This can be considered an effect size from small to moderate. Because the effect sizes 0.01, 0.06 and 0.14 are defined as small, moderate and large, respectively (Gren, Salkind, & Akey, 2000; Köklü et al., 2006, pp. 171–172). The pretest-posttest results of teachers with regard to the relationship between their attitudes towards project competitions and their gender are shown in Table 7.
Table 7
The Difference between Attitudes of Teachers towards Project Competitions by Their Gender
Dimensions of the Scale Group Gender N X Ss sd t p
The Overall Scale
Pre-Test FemaleMale 4842 3.613.77 .509.322 88 -1.753 .083 Post-Test FemaleMale 4842 3.813.87 .413.367 88 -.776 .440 Student Development
Pre-Test Male 48 4.23 .569 88 -.735 .465 Female 42 4.31 .411
Post-Test FemaleMale 4842 4.334.32 .409.466 88 .129 .898 The Importance of Education Pre-Test
Male 48 4.09 .803 88 -2.053 .043* Female 42 4.38 .468
Post-Test Male 48 4.15 .720 88 -1.396 .166 Female 42 4.34 .494
Evaluation
Pre-Test FemaleMale 4842 1.841.89 .730.595 88 -.350 .727 Post-Test Male 48 2.21 .926 88 .852 .396
Female 42 2.05 .839 Negative Behavior
Pre-Test Male 48 3.72 .967 88 -.948 .346 Female 42 3.89 .600
Post-Test FemaleMale 4842 3.944.05 .693.717 88 -.749 .456 Mentoring
Pre-Test Male 48 3.25 .895 88 -1.345 .182 Female 42 3.46 .589
Post-Test FemaleMale 4842 3.683.89 .751.622 88 -1.427 .157 p < .05.
Considering the change of pretest-posttest scores of male and female teachers in regard with their attitudes towards project competitions by their gender presented in Table 7, there is no statistically significant difference between pretest-posttest scores of teachers in regard to their attitudes towards project competitions (pretest = t((88)= -1.753; p > 0.05) and posttest= t((88) = -.776; p > 0.05). There is a significant difference in favor of female teachers in the pretest results of importance of education dimension of teacher attitude scale towards project competitions, while no statistically significant difference was found between posttest scores of male and female teachers in the importance of the education dimension of the scale (pretest = t((88) = -2.053; p <
0.05) and posttest = t((88)= -1.396; p > 0.05). The pretest-posttest results of teachers in regard with the relationship between their attitudes towards project competitions and their educational level are shown in Table 8.
Table 8
The Difference between Attitudes of Teachers towards Project Competitions by Their Educational Level Dimensions of the Scale Group Education Status N X Ss sd t p The Overall Scale
Pre-Test UndergraduateGraduate 6327 3.663.73 .432.455 88 -.706 .482 Post-Test UndergraduateGraduate 6327 3.823.86 .427.297 88 -.397 .693 Student Development
Pre-Test Undergraduate 63 4.28 .440 88 .130 .897 Graduate 27 4.26 .627
Post-Test UndergraduateGraduate 6327 4.344.29 .434.441 88 .448 .655 The Importance of
Education
Pre-Test UndergraduateGraduate 6327 4.224.23 .661.735 88 -.054 .957 Post-Test Undergraduate 63 4.17 .680 88 -1.549 .125
Graduate 27 4.40 .460 Evaluation
Pre-Test Undergraduate Graduate 6327 1.772.08 .551.855 88 -2.044 .054 Post-Test Undergraduate 63 2.13 .917 88 -.052 .959
Graduate 27 2.14 .823 Negative Behavior
Pre-Test Undergraduate 63 3.79 .796 88 -.210 .834 Graduate 27 3.83 .877
Post-Test UndergraduateGraduate 6327 3.964.09 .752.572 88 -.816 .417 Mentoring
Pre-Test Undergraduate 63 3.31 .771 88 -.744 .459 Graduate 27 3.44 .779
Post-Test UndergraduateGraduate 6327 3.833.67 .742.580 88 .944 .348
As it can be seen in Table 8, considering the change of pretest-posttest scores of male and female teachers in regard with their attitudes towards project competitions by their educational level (undergraduate, graduate), there is no statistically significant difference between pretest-posttest scores of teachers in regard to their attitudes towards project competitions according to their educational level (undergraduate, graduate) (pretest = t((88)= -.706; p > .05) and posttest = t((88) = -.397; p > .05). The correlation between pretest results of teachers in regard to their attitudes towards project competitions and scientific research are shown in Table 9.
Table 9
The Correlation Analysis Results of Pretest Results of Teachers in Regard to Their Attitudes towards Project Competitions and Scientific Research
Variable N r p Attitudes towards Project Competitions 90 0.149 .162 Attitudes towards Scientific Research 90
Considering the correlation between pretest results of teachers in regard with their attitudes towards project competitions and scientific researches; there was a weak and statistically insignificant correlation between attitudes of teachers towards project competitions and scientific research before the application (r = 0.149; p > .05). The pretest-posttest results of teachers received from the entire scientific research attitude scale and factors included in the scale are presented in Table 10.
Table 10
Pretest and Posttest Results of Attitudes of Teaches towards Scientific Research
Dimensions of the Scale Group N X Ss sd t p η2
The Overall Scale Post-TestPre-Test 9090 3.694.10 .645.323 89 -5.432 .000* 0.142 Positive Attitudes towards Researchers Post-TestPre-Test 9090 3.954.40 .891.519 89 -4.474 .000* 0.101 Unwillingness for Helping Researchers Pre-Test 90 3.43 .823 89 -6.325 .000* 0.183
Post-Test 90 4.02 .428
Positive Attitudes towards Research Post-TestPre-Test 9090 3.604.11 .761.502 89 -5.585 .000* 0.149 Negative Attitudes towards Research Post-TestPre-Test 9090 3.814.04 .708.436 89 -2.984 .004* 0.047
As can be seen in Table 6, the arithmetic average pretest score of teachers received from scientific research attitude scale was found as (X = 3.69), while the arithmetic average posttest score of teachers received from scientific research attitude scale was found as (X = 4.10), respectively. According to these results, there is an increase in favor of the posttest scores; thus, there is a statistically significant difference between pretest-posttest scores of the group (t(89) = -5.432; p < .05). On the other hand, a statistically significant difference is observed in the sub-scales of scientific research attitude scale of teachers. In this regard, a statistically significant difference was found in favor of posttest scores received from “Positive Attitudes towards Researchers” (t(89) = -4.474; p < .05), “Being Reluctant to Help Researchers” (t(89) = -6.325; p < .05), “Positive Attitudes towards Researches” (t(89) = -5.585; p < .05) and “Negative Attitudes towards Researches” (t(89) = -2.984; p < 0.05). At this point, considering the effect size of entire scale and factors included in the scale (η2); the effect size was found as (η2 = .142) in the entire scale, (η2 = .101) in the “Positive Attitudes towards Researchers” sub-scale, (η2 = .183) in the “Being Reluctant to Help Researchers” sub-scale, (η2 = .149) in the “Positive Attitudes towards Researchers” sub-scale and (η2 = .047) in the “Negative Attitudes towards Researches” sub-scale. This can be considered as a large effect size in the entire scale and all factors of the scale. The relationship between gender of teachers and their attitudes towards scientific research are presented in Table 11.
Table 11
The Difference between Attitudes of Teachers towards Scientific Research According to Their Gender
Dimensions of the Scale Group Gender N X Ss sd t p
The Overall Scale
Pre-Test Male 48 3.56 .741 88 -2.015 .057 Female 42 3.83 .482
Post-Test Male 48 4.13 .308 88 .812 .419 Female 42 4.07 .340
Positive Attitudes Towards Researchers
Pre-Test Male 48 3.79 1.011 88 -1.935 .056 Female 42 4.15 .695
Post-Test Male 48 4.41 .559 88 .076 .939 Female 42 4.40 .477
Unwillingness for Helping Researchers
Pre-Test Male 48 3.28 .860 88 -1.864 .066 Female 42 3.60 .752
Post-Test Male 48 4.02 .447 88 .029 .977 Female 42 4.02 .411
Positive Attitudes towards Research
Pre-Test Male 48 3.55 .852 88 -.703 .484 Female 42 3.67 .647
Post-Test Male 48 4.16 .471 88 .997 .321 Female 42 4.05 .535
Negative Attitudes towards Research
Pre-Test Male 48 3.68 .807 88 -1.958
Female 42 3.97 .544 .053
Post-Test Male 48 4.02 .313 88 .935 .353 Female 42 3.92 .619
p < .05.
Considering the comparison of the change of pretest and posttest scores of teachers towards scientific research by their gender with unrelated samples t-test; there is no statistically significant difference between pretest and posttest scores of male and female teachers in regard to scientific researches (pretest = t((88) = -2.015; p > .05) and posttest = t((88) = .812; p > .05). The relationship between attitudes of teachers towards scientific research and educational level is shown in Table 12.
Considering the comparison of the change of pretest and posttest scores of teachers towards scientific research by their educational level (undergraduate, graduate) with an unrelated samples t-test; there is no statistically significant difference between pretest and posttest scores of teachers holding a bachelor degree and graduate degree in regard to scientific researches in the entire scale and all factors included in the scale (pretest = t((88) = -1.807; p > .05) and posttest = t((88) = .449; p > .05). The correlation between attitudes of teachers towards preparing projects and scientific research is given in Table 13.
Considering the posttest correlation analysis results of teachers in regard with their attitudes towards project preparation and scientific research in Table 13; a significant and moderately positive relationship was found between their attitudes towards project preparation and scientific research after the application (r = 0.319; p < .05).
Discussion
As a result of the study, a statistically significant difference in favor of posttest scores of teachers was found in their attitudes towards project competitions (p < .05). According to this result, it can be suggested that attitudes of teachers towards project competitions were developed in a positive way.
A statistically significant difference in favor of posttest scores of teachers received from mentorship, negative behavior and evaluation dimensions of the scale was found (p < .05). According to these results, teachers developed a positive attitude as being a mentor during these competitions, they developed a positive attitude about the fact that students develop positive behaviors during project competitions, and lastly they developed a positive attitude about evaluation of the projects submitted to the competitions. Tortop (2013a; 2013c) concluded that teachers don’t want to attend project competitions as a mentor unless it is necessary and they have a negative
Table 12
The Difference between Attitudes of Teachers towards Scientific Research According to Their Educational Level
Dimensions of the Scale Group Education Status N X Ss sd t p The Overall Scale
Pre-Test Undergraduate 63 3.61 .659 88 -1.807 .074 Graduate 27 3.88 .581
Post-Test UndergraduateGraduate 63 4.11 .347 8827 4.08 .262 .449 .655 Positive Attitudes towards Researchers
Pre-Test UndergraduateGraduate 63 3.94 .914 8827 3.98 .854 -.154 .878 Post-Test Undergraduate 63 4.45 .503 88 1.205 .232
Graduate 27 4.30 .554 Unwillingness for Helping
Research-ers
Pre-Test UndergraduateGraduate 63 3.30 .860 88 -2.174 .06227 3.61 .661 Post-Test UndergraduateGraduate 63 4.05 .443 8827 3.93 .386 1.265 .209 Positive Attitudes towards Research
Pre-Test Undergraduate 63 3.94 .914 88 -1.782 .078 Graduate 27 3.98 .854
Post-Test UndergraduateGraduate 63 4.45 .503 8827 4.30 .554 -.026 .979 Negative Attitudes towards Research Pre-Test
Undergraduate 63 3.74 .752 88
Graduate 27 4.00 .561 -1.632 .106 Post-Test Undergraduate 63 3.94 .536 88 -.834 .407
Graduate 27 4.04 .312 Table 13
The Posttest Correlation Analysis Results of Teachers in Regard to Their Attitudes towards Project Preparation and Scientific Research
Variable N r p Attitudes Towards the Project Competition 90 0.319* .002 Attitudes Towards Scientific Research 90
attitude towards being a mentor in such competitions. Considering the effect size (η2), which is used to determine the statistical effect of research applications on the attitudes of teachers in regard to project competitions; the effect size of the entire research on the attitudes of teachers in regard to project competitions was found to be 0.067 and ranged between 0.029 and 0.100 for dimensions of the scale. Thus, it can be suggested that only 6.7% of the positive changes seen in the attitudes of teachers in regard to project competitions is the outcome of the activities performed during the study. According to these findings, 93.3% of the positive changes seen in the attitudes of teachers in regard to project competitions is caused by some other reasons.
Considering the pretest-posttest data in regard to the relationship between attitudes of teachers towards project competitions and their gender; there was no statistically significant relationship between attitudes of teachers towards project competitions and their gender in the entire scale before the application (p > .05). There was a significant difference in favor of female teachers in the “importance of education” dimension of teacher attitude scale towards project competitions (p < .05). According to this result, female teachers used to consider project competitions as an important element of educational activity. Considering the posttest data obtained from the study, it was concluded that there is no statistically significant difference between attitudes of teachers towards project competitions and their gender in the entire scale and all factors (p > .05). As a result of the study, no significant difference was found between posttest scores of male and female teachers received from the “importance of education” sub-scale. Therefore, it can be thought that male teachers have realized that project competitions are an important element of educational activities.
Considering the pretest-posttest data of teachers in regard to their attitudes towards project competitions and educational levels; no statistically significant difference was found between attitudes of teachers towards project competitions and their educational levels in the entire scale and factors of the scale before the application (p > .05).
Considering the correlation between pretest data of attitudes of teachers towards scientific research and project competitions, a positive and statistically significant relationship was found between attitudes of teachers towards scientific research and project competitions (r = 0.149; p > .05). According to this result, it is thought that teachers couldn’t fully understand the relationship between project competitions and scientific research stages prior to the study.
Considering the changes in the attitudes of teachers towards scientific research during the study, a significant difference was found in favor of posttest scores of teachers in the scientific research attitude scale and factors of the scale (p < .05). According to this result, attitudes of teachers towards scientific research were improved during the study and they developed a more positive attitude for researchers and scientific
research (Küçükoğlu, Taşkın, & Çelik, 2013) conducted a study with prospective teachers and stated that concepts related to the scientific research processes are not completely and accurately perceived by prospective teachers. In addition, although prospective teachers stated that doing research is not necessary for teachers, scientific research can be useful in their professional lives.
Considering the effect size (η2), which is used to determine the statistical effect of the research period on the positive attitudes of teachers towards scientific research; the effect size of the entire research on the attitudes of teachers in regard to their general attitudes towards scientific research was found to be 0.142, and ranged between 0.047 and 0.183 for dimensions of the scale. Thus, it can be suggested that only 14.2% of the positive changes seen in the attitudes of teachers towards scientific research is the outcome of the activities performed during the study. According to these findings, 85.8% of the positive changes seen in the attitudes of teachers towards scientific research is caused by some other reasons.
Considering the relationship between attitudes of teachers towards scientific research and their gender, no statistically significant difference was found between pretest-posttest results of both male and female teachers in the scale and factors included in the scale (p > .05). According to this result, it is concluded that there is no statistically significant difference between attitudes of teachers towards scientific research and their gender, and gender is not an important factor effecting attitudes of teachers towards scientific research (Polot, 2014) stated that gender is not an important factor effecting attitudes of prospective teachers towards scientific research, (Korkmaz, Şahin, & Yeşil, 2011b) determined that knowledge, skills and qualifications of teachers about the implementation of the process of scientific research do not differ according to their gender.
Considering the relationship between attitudes of teachers towards scientific research and their educational level, there was no statistically significant difference between pretest-posttest scores of teachers in regard to their attitudes towards scientific research according to their educational level in the scale and factors included in the scale. According to this result, it is concluded that there is no statistically significant difference between attitudes of teachers towards scientific research and their educational level and having a graduate or undergraduate degree is not an important factor effecting attitudes of teachers towards scientific research.
Considering the correlation between posttest attitude data of teachers in regard to scientific research and project competitions; a positive and significant relationship was found between attitudes of teachers towards scientific research and project competitions (r = 0.319; p < .05). Çetin and Şengezer (2013) determined that project studies improve scientific process skills of students and (Tortop, 2013b) conducted

![Rumelihisarı [Rumeli Hisarı] temsilleri bu gece başlıyor](data:image/gif;base64,R0lGODlhAQABAIAAAP///wAAACH5BAEAAAAALAAAAAABAAEAAAICRAEAOw==)