Tar. Bil. Der. Dergi web sayfası: www.agri.ankara.edu.tr/dergi Journal homepage: www.agri.ankara.edu.tr/journal
Exact Microsatellite Density Differences among Capsicum
Tissues and Development Stages
Ayşe Gül INCEa, Mehmet KARACAb, Ahmet Naci ONUSa a
Akdeniz University, Faculty of Agriculture, Department of Horticulture, 07059, Antalya, TURKEY
b
Akdeniz University, Faculty of Agriculture, Department of Field Crops, 07059, Antalya, TURKEY
ARTICLE INFO
Research Article Crop Production
Corresponding author: Ahmet Naci ONUS, e-mail: [email protected], Tel: +90(242) 310 65 19 Received: 04 June 2011, Received in revised form: 13 December 2011, Accepted: 07 January 2012
ABSTRACT
Density and position differences of microsatellites in genomes may indicate important roles of microsatellites in genetic development and regulation of gene expression. However, there is no or limited study on microsatellite density differences among tissues of development stages. In the present study, exact microsatellite densities and motifs among 7 different tissues and development stages were determined using Capsicum annuum L. expressed sequence tags (ESTs), which were reassembled into in silico libraries. Results indicated that densities of exact microsatellites (1 to 6 bp repeats) in housekeeping and tissue specific ESTs of anther, flower bud, and placenta specific ESTs were statistically different, being low in comparison to that of leaf, fruit, early and hairy root. Further analyses also indicated that exact microsatellite density of anther and placenta was significantly low while exact microsatellite density of flower bud, early and hairy root was significantly higher. There were density differences among mono-, di-, tri- and hexa-nucleotides between housekeeping and tissue specific ESTs. Density of tri- and penta-nucleotides was not statistically significant. Overall results of the present study indicated that since the microsatellite densities differed between housekeeping and tissue specific genes, genes containing microsatellites may differ among tissues and development stages.
Keywords: Microsatellite densities, Repeat types; In silico analysis
Capsicum Doku ve Gelişme Dönemlerinde Düzenli Mikrosatellit
Yoğunluk Farklılıkları
ESER BİLGİSİ
Araştırma Makalesi Bitkisel Üretim
Sorumlu Yazar: Ahmet Naci ONUS, e-posta: [email protected], Tel: +90(242) 310 65 19 Geliş tarihi: 04 Haziran 2011, Düzeltmelerin gelişi: 13 Aralık 2011, Kabul: 07 Ocak 2012
ÖZET
Genomda mikrosatellitlerin yoğunluk ve konum farklılıkları mikrosatellitlerin genetik gelişim ve gen ekspresyonunun düzenlenmesi konularında önemli roller oynadıklarını göstermektedir. Ancak, doku ve gelişme dönemleri arasında mikrosatellit yoğunluk farklılıkları üzerine yapılan çalışmalar ya yoktur ya da oldukça sınırlıdır.
TARI M B İL İMLER İ DERG İS İ
JOUR
NAL
OF
AGRICULTURAL
SCIENCES
17 (2011 ) 291 ‐29 9
Bu çalışmada, 7 farklı doku ve gelişme dönemi arasında düzenli mikrosatellit yoğunluğu ve motifleri biber (Capsicum annuum L.) bitkisine ait ifade edilmiş gen parçası (EST) sekanslarından oluşturulan in silico kütüphaneleri kullanılarak belirlenmiştir. Sonuçlar anter, çiçek tomurcuğu ve plasenta dokularına özgü EST’lerde yaprak meyve, genç ve kılcal kök dokularına özgü EST’lere göre fiili işlevsel (housekeeping) ve doku spesifik EST’lerde düzenli mikrosatellit yoğunluğunun istatistiksel olarak önemli düzeyde düşük olduğunu göstermiştir. Buna ilaveten yapılan analizlerde de anter ve plasenta dokularında düzenli mikrosatellit yoğunluğu istatistiksel olarak önemli seviyede düşük, çiçek tomurcuğu, genç ve kılcal kök dokularında ise önemli düzeyde yüksek olduğu bulunmuştur. Housekeeping ve doku spesifik EST’lerde mono-, di-, tri- ve hekza-nükleotit mikrosatellit motiflerinin yoğunlukları arasında önemli farklılıklar olduğu saptanmıştır. Tri- ve penta-nükleotit yoğunluklarının ise önemli düzeyde olmadığı görülmüştür. Genel olarak housekeeping ve doku spesifik genlerde mikrosatellit yoğunluklarının farklı olduğu belirlenmiş ve bu sonuçlara göre de mikrosatellitlerin doku ve gelişme dönemine göre farklı ekspresyona neden olabilecekleri gösterilmiştir.
Anahtar sözcükler: Mikrosatellit yoğunluğu; Tekrar tipleri; İn silico analizler
© Ankara Üniversitesi Ziraat Fakültesi
1. Introduction
Microsatellites and minisatellites found in plant and animal genomes have been traditionally thought of as functionally unimportant but they have been commonly used as genetic markers. Microsatellite DNA motifs can consist of a single base to six bases, which are repeated several times. The repeats can be either exact (perfect) tandem repeats or interrupted by several non-repeat nucleotides (inexact or imperfect) or compound repeats (Bilgen et al 2004). Microsatellite repeat variations in plant species have been extensively used as markers of choice in genetic research since they exhibit high level of polymorphism within species; inherit as co-dominant fashion discriminating the homozygous from heterozygous individuals (Karaca et al 2002; Karaca et al 2004; Tyrka et al 2008; Ince et al 2009a; Ince et al 2010a).
Recent studies have shown that densities of microsatellites were considerably higher than they would be predicted purely on the grounds of base composition in many organisms (Bilgen et al 2004; Ince et al 2009b; Polat et al 2010). Including or excluding mononucleotide repeats in a genome greatly affect densities of microsatellites. For instance, the human genome contains approximately one million mononucleotide repeats which are longer than 9 bp (Cohen et al 2004). However, there still exist controversies in the microsatellite density differences among literatures in which some studies exclude mononucleotides and in some
other studies the upper limit of repeat number is decreased as low as 5 bp or as great as 10 bp (Chambers & MacAvoy 2000; Ellegren 2004; Karaca & Ince 2011). Regardless of the definition of microsatellites, studies in animal genome have shown that microsatellites play a more active role in terms of gene regulation, development and evolution (Li et al 2004; Kashi & King 2006). However, there is limited information about the microsatellite density differences among plant tissues and development stages as well as between genes specific to a tissue or housekeeping.
This study was undertaken to identify exact microsatellite density differences in Capsicum annuum L. tissues and development stages as well as the genes specific to a tissue or housekeeping functions. In order to investigate microsatellite density differences in silico databases were constructed and these data were used in this study.
2. Materials and methods
2.1. ESTs
A total of 116,535 Capsicum annuum L. ESTs from National Center for Biotechnology Information at http://www.ncbi.nlm.nih.gov/ containing 129,149,486 base pair nucleotide information were initially used. Keyword Finder and Organism Miner (Ince et al 2008) were implemented to obtain ESTs specific to each of anther, hairy root, early root, leaf, young fruit, placenta and flower bud library. A total of 20,738 ESTs containing 9.93 mega base nucleotides were selected from the database based on the library
identification number (Lib ID) and assembled into contiguous sequences (contigs) using Sequencher software (Gene Codes, Ann Arbour, MI). Contig assembly parameters were set to minimum overlap of 50 bases and 95% identity match. 2.2. Microsatellite analyses
Microsatellites in each dataset were identified using the Tandem Repeats Analyzer 1.5 (TRA 1.5) program (Bilgen et al 2004). Microsatellites in the present study were considered sequences containing a minimum of 18, 9, 7, 5, 5 and 4 nucleotide perfect (exact) repeats for mono- di-, tri-, tetra-, penta- and hexa-nucleotides, respectively. These repeat numbers were chosen since they are commonly used in other plant species (Karaca et al 2005; Li et al 2004; Lawson & Zhang 2008).
2.3. Statistical analysis
Chi-square (χ2) goodness-of-fit tests with 1 degree
of freedom were applied to test whether microsatellite densities were significantly different within and between datasets mentioned above.
i
i L L
N
E (1)
where Ei is the expected number of microsatellites
in a dataset; N is the total number of microsatellites in the two different datasets; L is the total length in base pairs of the two datasets; and Li is the length in base pairs of the dataset
under investigation (Lawson & Zhang 2008).
3. Results and Discussion
3.1. ESTs analyses
A total of 20,738 ESTs containing 9.93 mega base nucleotide information as shown in Table 1 were studied. The highest number of ESTs were present in leaf tissues while anther tissues contained the lowest number of ESTs. There were lengths differences among the ESTs of seven tissues and development stages. The average number of base pairs in anther ESTs was 602.37 bp while the average number of base pairs in early root ESTs was 398.6 bp. The average number of the seven different tissues was 478.73 bp (Table 1).
3.2. Construction of in silico databases
All the EST sequences given in Table 1 were assembled into 22 in silico libraries (Figure 1). These in silico libraries consisted of singletons (S), consensus mutual (CM) and consensus specific (CS) for each of the seven cDNA sets to investigate microsatellite density differences among the genes specific to tissues and development stages (Table 2). Classification of sequences in Table 2 was obtained from the analyses summarized in Figure 1.
Tissue specific singletons (S) and contigs (CS) were considered those ESTs that had no homolog to other ESTs. On the other hand, those singletons and contigs with homology to other ESTs were considered non-tissue specific (CM). For instance a total of 510 anther ESTs were divided into CS, CM and S. CS of anther consisted of 20 Type I AO consensuses and 355 Type I A0 S sequences. CS and S of anther were only present in anther tissues while anther CM consisted of Type II A consensus sequences (135) that were also present in some other tissues and development stages.
In Figure 1 tissue and development specific in silico libraries are shown. This shema represented 22 (numbers 0 to 15) in silico libraries. For instance, anther in silico libraries have ESTs specifically expressed in anther (indicated as A0) and numbers 2, 3, 5, 6, 7, 8, 9, 14 and 15 represent ESTs which are also expressed in other tissues or development stages. A0 in silico anther library contained a total of 375 ESTs, which are the combination of 20 anther CS and 355 anther S shown in Table 2. On the other hands, 135 ESTs represented ESTs which collected from the all possible combination of seven tissues or development stages.
3.3. Microsatellite densities among tissues and development stages
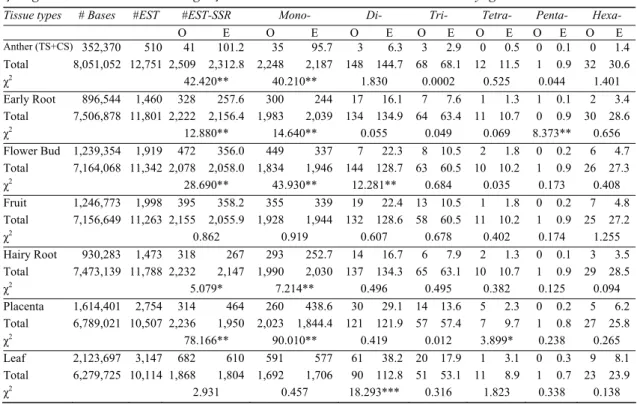
As shown in Table 3, exact microsatellite density of tissue specific sequences consisting of singletons and consensus (TS + CS) for a tissue or development stage was compared to total number of sequences, which were 13,261 (Total). As shown in Table 3 exact microsatellite densities
Table 1-A summary of expressed sequence tags (ESTs) used in the study
Çizelge 1-Araştırmada kullanılan ifade edilmiş gen parçalarının (EST’ler) özeti
Source Total base (mega bases) Number of ESTs Average length (bp)
Leaf 2.81 5,145 545.19 Flower Bud 1.67 3,524 474.12 Anther 0.40 666 602.37 Young Fruit (0.5-2 cm) 1.71 3,681 464.61 Hairy Root 0.84 1,926 435.92 Early Root 0.75 1,893 398.60 Placenta 1.77 3,903 447.47 Total 9.93 20,738 478.73
Figure 1-Figural representation of tissue and development specific in silico libraries. This shema represented 22 (numbers 0 to 15) in silico libraries. 0 represents tissues specific gene or gene segments. Other numeric numbers represent gene expressed in more than one tissue type
Şekil 1-In silico kütüphanelerinin doku gelişme dönemlerinin şekilsel temsili. Bu şema 22 (0 ila 15) in silico kütüphanesini temsil etmektedir.0 doku spesifik gen veya gen segmentlerini temsil etmekte, diğer sayısal numaralar ise birden fazla doku tipinde ifade edilen genleri temsil etmektedir
Table 2-Data of in silico libraries constructed in this study
Çizelge 2-Araştırmada oluşturulan in silico kütüphaneler
Databases Length (bp) # Sequences Types
Anther (CS) 15,617 20 Type I A0
Anther (CM) 129,201 135 Type II A
Anther (S) 207,552 355 Type I A0
Flower bud (CS) 117,187 189 Type I B0 Flower bud (CM) 679,964 795 Type II B Flower bud (S) 442,203 935 Type I B0 Early root (CS) 16,771 31 Type I E0 Early root (CM) 614,350 750 Type II E Early root (S) 265,423 679 Type I E0 Young fruit (CS) 80,528 133 Type I F0 Young fruit (CM) 736,799 917 Type II F Young fruit (S) 429,446 948 Type I F0 Hairy root (CS) 21,132 34 Type I H0 Hairy root (CM) 596,692 713 Type II H Hairy root (S) 312,459 726 Type I H0
Leaf (CS) 237,795 353 Type I L0 Leaf (CM) 893,738 1,019 Type II L Leaf (S) 992,164 1,775 Type I L0 Placenta (CS) 82,828 136 Type I P0 Placenta (CM) 823,926 1,027 Type II P Placenta (S) 707,647 1,591 Type I P0
S: singletons, CM: consensus mutual, CS: consensus specific
among the 7 tissues and development stages were different with the exception of leaf and fruit. Results indicated that ESTs expressed in early root, hairy root, flower bud contained more microsatellites. On the other hand, placenta and anther contained lower amount of microsatellite densities.
Exact microsatellite densities between leaf and other tissues and between fruit and other tissues were not statistically different. These findings indicated that microsatellite containing ESTs in leaf and fruit also expressed in other tissues. Flower bud, hairy root and early root ESTs contained more microsatellite densities whereas anther and placenta ESTs contained fewer amounts of microsatellites (Table 3).
Mononucleotide repeat differences were statistically different with the exception of fruit and leaf tissues. Di-nucleotide repeat densities were significantly low in flower bud whereas it
was significantly higher in leaf. There were no significant tri- and hexa-nucleotide repeat densities between the tissues. Placenta contained higher tetra-nucleotide density, while it contained less amount of mono-nucleotide density. Penta-nucleotide density of early root was significantly higher than the others. Based on the in silico studies we observed that mono-nucleotide densities are higher or lower in many tissues, whereas tri- and hexa-nucleotide repeat densities randomly distributed among the all tissues and development stages. Among the all 6 microsatellite motif densities mono-nucleotides were the most different repeat types, followed by the di-, tetra and penta-nucleotide repeats. On the other hand tri- and hexa-nucleotide repeats randomly distributed among the tissues and developmental stages (Table 3).
3.4. Microsatellite densities between tissue specific and housekeeping ESTs
Table 3-Exact microsatellite densities among tissues and development stages of C. annuum L.
Çizelge 3-C. annuum’da doku ve gelişme dönemleri arasında düzenli mikrosatellit yoğunlukları
Tissue types # Bases #EST #EST-SSR Mono- Di- Tri- Tetra- Penta- Hexa-
O E O E O E O E O E O E O E Anther (TS+CS) 352,370 510 41 101.2 35 95.7 3 6.3 3 2.9 0 0.5 0 0.1 0 1.4 Total 8,051,052 12,751 2,509 2,312.8 2,248 2,187 148 144.7 68 68.1 12 11.5 1 0.9 32 30.6 χ2 42.420** 40.210** 1.830 0.0002 0.525 0.044 1.401 Early Root 896,544 1,460 328 257.6 300 244 17 16.1 7 7.6 1 1.3 1 0.1 2 3.4 Total 7,506,878 11,801 2,222 2,156.4 1,983 2,039 134 134.9 64 63.4 11 10.7 0 0.9 30 28.6 χ2 12.880** 14.640** 0.055 0.049 0.069 8.373** 0.656 Flower Bud 1,239,354 1,919 472 356.0 449 337 7 22.3 8 10.5 2 1.8 0 0.2 6 4.7 Total 7,164,068 11,342 2,078 2,058.0 1,834 1,946 144 128.7 63 60.5 10 10.2 1 0.9 26 27.3 χ2 28.690** 43.930** 12.281** 0.684 0.035 0.173 0.408 Fruit 1,246,773 1,998 395 358.2 355 339 19 22.4 13 10.5 1 1.8 0 0.2 7 4.8 Total 7,156,649 11,263 2,155 2,055.9 1,928 1,944 132 128.6 58 60.5 11 10.2 1 0.9 25 27.2 χ2 0.862 0.919 0.607 0.678 0.402 0.174 1.255 Hairy Root 930,283 1,473 318 267 293 252.7 14 16.7 6 7.9 2 1.3 0 0.1 3 3.5 Total 7,473,139 11,788 2,232 2,147 1,990 2,030 137 134.3 65 63.1 10 10.7 1 0.9 29 28.5 χ2 5.079* 7.214** 0.496 0.495 0.382 0.125 0.094 Placenta 1,614,401 2,754 314 464 260 438.6 30 29.1 14 13.6 5 2.3 0 0.2 5 6.2 Total 6,789,021 10,507 2,236 1,950 2,023 1,844.4 121 121.9 57 57.4 7 9.7 1 0.8 27 25.8 χ2 78.166** 90.010** 0.419 0.012 3.899* 0.238 0.265 Leaf 2,123,697 3,147 682 610 591 577 61 38.2 20 17.9 1 3.1 0 0.3 9 8.1 Total 6,279,725 10,114 1,868 1,804 1,692 1,706 90 112.8 51 53.1 11 8.9 1 0.7 23 23.9 χ2 2.931 0.457 18.293*** 0.316 1.823 0.338 0.138 O: observed, E: expected, *: P≤0.0031, **: P≤0.0005
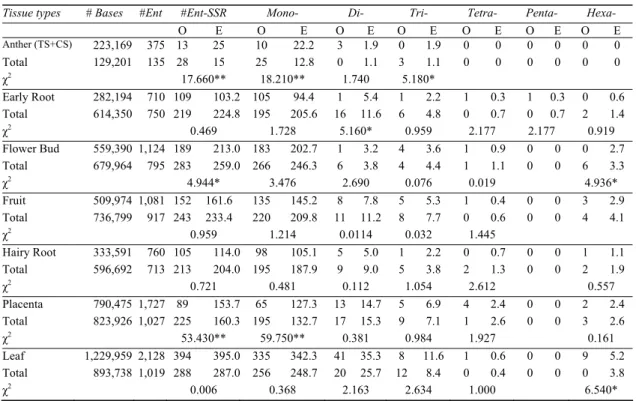
In order to investigate whether there existed exact microsatellite density differences between tissue specific (TS) and housekeeping (HS) gene or gene segments (ESTs), comparison analyses were performed and shown in Table 4. Results indicated that genes specifically expressed in anther, flower bud and placenta contained less density of microsatellites than expected while other tissues contained expected number of microsatellite densities.
Among the microsatellite motifs, densities of mononucleotides between tissue specific and housekeeping genes were significantly different in anther and placenta ESTs (Table 4). Dinucleotide microsatellite density was significantly low in early root tissue specific ESTs and trinucleotide microsatellite density was also low in anther tissue specific ESTs. Leaf specific ESTs contained more amount of hexanucleotide microsatellites than housekeeping ESTs. Flower
bud housekeeping ESTs contained more hexanucleotides than flower bud specific ESTs (Table 4). There were no statistically significant differences between tissue specific and housekeeping ESTs for tetra-nucleotides and penta-nucleotides.
Up to date, limited research on variations in microsatellite density has been studied among tissues, populations, and species in plants. In a previous study, using a total of 16 cDNA samples obtained from different pepper tissues and at different developmental stages, it was observed that some types of microsatellite-containing genes showed differential expression patterns (Ince et al 2010b). In this study the use of in silico databases clearly showed that some types of microsatellite differently expressed among different tissues and there were microsatellite density differences between tissues specific and housekeeping genes.
Table 4-Exact microsatellite densities between tissue specific and housekeeping genes in C. annuum L.
Çizelge 4-C. annuum’da doku spesifik ve housekeeping genler arasında düzenli mikrosatellit yoğunlukları Tissue types # Bases #Ent #Ent-SSR Mono- Di- Tri- Tetra- Penta- Hexa-
O E O E O E O E O E O E O E Anther (TS+CS) 223,169 375 13 25 10 22.2 3 1.9 0 1.9 0 0 0 0 0 0 Total 129,201 135 28 15 25 12.8 0 1.1 3 1.1 0 0 0 0 0 0 χ2 17.660** 18.210** 1.740 5.180* Early Root 282,194 710 109 103.2 105 94.4 1 5.4 1 2.2 1 0.3 1 0.3 0 0.6 Total 614,350 750 219 224.8 195 205.6 16 11.6 6 4.8 0 0.7 0 0.7 2 1.4 χ2 0.469 1.728 5.160* 0.959 2.177 2.177 0.919 Flower Bud 559,390 1,124 189 213.0 183 202.7 1 3.2 4 3.6 1 0.9 0 0 0 2.7 Total 679,964 795 283 259.0 266 246.3 6 3.8 4 4.4 1 1.1 0 0 6 3.3 χ2 4.944* 3.476 2.690 0.076 0.019 4.936* Fruit 509,974 1,081 152 161.6 135 145.2 8 7.8 5 5.3 1 0.4 0 0 3 2.9 Total 736,799 917 243 233.4 220 209.8 11 11.2 8 7.7 0 0.6 0 0 4 4.1 χ2 0.959 1.214 0.0114 0.032 1.445 Hairy Root 333,591 760 105 114.0 98 105.1 5 5.0 1 2.2 0 0.7 0 0 1 1.1 Total 596,692 713 213 204.0 195 187.9 9 9.0 5 3.8 2 1.3 0 0 2 1.9 χ2 0.721 0.481 0.112 1.054 2.612 0.557 Placenta 790,475 1,727 89 153.7 65 127.3 13 14.7 5 6.9 4 2.4 0 0 2 2.4 Total 823,926 1,027 225 160.3 195 132.7 17 15.3 9 7.1 1 2.6 0 0 3 2.6 χ2 53.430** 59.750** 0.381 0.984 1.927 0.161 Leaf 1,229,959 2,128 394 395.0 335 342.3 41 35.3 8 11.6 1 0.6 0 0 9 5.2 Total 893,738 1,019 288 287.0 256 248.7 20 25.7 12 8.4 0 0.4 0 0 0 3.8 χ2 0.006 0.368 2.163 2.634 1.000 6.540*
Ent: Entry, TS: tissue specific, HS: housekeeping, O: observed, E: expected, *: P≤0.0105, **: P≤ 0.0001
Lawson & Zhang (2008), based on in silico analyses in mouse and human, indicated that microsatellite densities of housekeeping genes were about 1.7 times higher than those in tissue-specific genes and also showed that microsatellite domain contents were different between housekeeping and tissue-specific genes. In this study we observed that microsatellite density differences between housekeeping and tissue specific genes were also present in plant species. Furthermore this study also clearly showed the existence of microsatellite density differences among tissue and development stages.
Among the microsatellite motif, tri- and hexa-nucleotide motifs in plants (Bilgen et al 2004) and in human (Karaca et al 2005) have been shown to occur more than other repeats types excluding the mononucleotides. The occurrences of more tri-nucleotides indicate that genes with trinucleotide repeats may play significant roles in the
maintenance of cellular physiology. For example, Huntington’s disease and spinocerebellar ataxia (SCA) disease in human that alteration in CAG trinucleotide repetitive sequences was found to be associated with expansion in length. In another example, changing in GCG repeat numbers causes oculopharyngeal muscular dystrophy disease in human (Yamada et al 2002; Krol et al 2007; Pizzi et al 2007). These examples indicate that some disease may occur as a result of trinucleotide repeat variations. In the present study it was observed that tri-nucleotide repeat differences were not statistically different among the tissues and development stages.
In this study using publicly available cDNA libraries a total of 22 in silico libraries were constructed. Using these libraries genic microsatellite and single nucleotide markers can be identified. The use of ESTs for microsatellite
primer pairs has been intensively utilized in Capsicum species and other species (Ince et al 2010a; Polat et al 2010). However EST-based microsatellites show low level of polymorphisms than genomic microsatellites (Blair et al 2011). The level of polymorphism in EST-based microsatellites could be improved by the use of CAPS-microsatellite technique (Ince et al 2010c).
4. Conclusion
In this study it was observed that microsatellite densities among tissues and development stages as well as between tissue-specific and housekeeping ESTs were different. Although the number of ESTs studied in the present study is relatively low to represent the whole Capsicum genome, it is the first study to investigate densities of microsatellite motifs distributed among 22 in silico libraries. In spite of the fact that some EST numbers were low in some microsatellite motifs these findings may indicate that densities of microsatellites were higher than they would be predicted purely on the grounds of base composition. Tissue specific microsatellites with known function can be effectively used in genetic studies in plants. In the present study we also demonstrated that cDNA libraries could be reassembled to construct tissue and development stage specific in silico libraries which could be used in gene identification and annotation studies as well as identification of single nucleotide polymorphism.
Acknowledgements
This research was supported in part by the Scientific and Technological Research Council and The Scientific Research Projects Coordination Unit of Akdeniz University.
References
Bilgen M, Karaca M, Onus A N & Ince A G (2004). A software program combining sequence motif searches with keywords for finding repeats containing DNA sequences. Bioinformatics 20: 3379-3386
Blair M W, Hurtado N, Chavarro C M, Munoz-Torres M C, Giraldo M C, Pedraza F, Tomkins J & Wing R (2011). Gene-based SSR markers for common
bean (Phaseolus vulgaris L.) derived from root and leaf tissue ESTs: an integration of the BMc series.
Plant Biology 11: 50
Chambers G K & MacAvoy E S (2000). Microsatellites: consensus and controversy.
Comparative Biochemistry and Physiology 126:
455-476
Cohen H, Danin-Poleg Y, Cohen C J, Sprecher E, Darvasi A & Kashi Y (2004). Mono-nucleotide repeats (MNRs): a neglected polymorphism for generating high density genetic maps in silico.
Human Genetics 115: 213-220
Ellegren H (2004). Microsatellites: Simple sequences with complex evolution. Nature Reviews Genetics 5: 435-445
Ince A G, Karaca M, Bilgen M & Onus A N (2008). Digital differential display tools for mining microsatellite containing organism, organ and tissue. Plant Cell Tissue Organ Culture 94: 281-290
Ince A G, Karaca M & Turgut K (2009a). PCR based minisatellites are useful in Origanum, Thymus,
Sideritis and Salvia genetic studies. Planta Medica
75: 932-932
Ince A G, Karaca M & Onus A N (2009b). Differential expression of microsatellites in leaves and rhizomes of Turmeric (Curcuma longa Linn.). Planta Medica 75: 929-929
Ince A G, Karaca M & Onus A N (2010a). Polymorphic microsatellite markers transferable across Capsicum species. Plant Molecular Biology Reporter 28: 285-291
Ince A G, Karaca M & Onus A N (2010b). Differential expression patterns of genes containing microsatellites in Capsicum annuum L. Molecular
Breeding 25: 645-658
Ince A G, Karaca M & Onus A N (2010c). CAPS-microsatellites: use of CAPS method to convert non-polymorphic microsatellites into useful markers. Molecular Breeding 25: 491-499
Karaca M, Saha S, Jenkins J N, Zipf A, Kohel R & Stelly D M (2002). Simple sequence repeat (SSR) markers linked to the Ligon lintless (Li-1) mutant in cotton. Journal of Heredity 93: 221-224
Karaca M, Saha S, Callahan F E, Jenkins J N, Read J J & Percy R G (2004). Molecular and cytological characterization of a cytoplasmic-specific mutant in pima cotton (Gossypium barbadense L.). Euphytica 139: 187-197
S Y (2005). Exact tandem repeats analyzer (E-TRA): a new program for DNA sequence mining.
Journal of Genetics 84: 49-54
Karaca M & Ince A G (2011). New non-redundant microsatellite markers for cotton (Gossypium L.).
Turkish Journal of Fields Crops 16: 172-178
Kashi Y & King D G (2006). Simple sequence repeats as advantageous mutators in evolution. Trends
Genetics 22: 253-259
Krol J, Fiszer A, Mykowska A, Sobczak K, de Mezer M & Krzyzosiak W J (2007). Ribonuclease dicer cleaves triplet repeat hairpins into shorter repeats that silence specific targets. Molecular Cell 25: 575-586
Lawson M J & Zhang L (2008). Housekeeping and tissue-specific genes differ in simple sequence repeats in the 50-UTR region. Gene 407: 54-62 Li Y C, Korol A B, Fahima T & Nevo E (2004).
Microsatellites within genes: structure, function, and evolution. Molecular Biology Evolution 21: 991-1007
Pizzi C, Di Maio M, Daniele S, Mastranzo P, Spagnoletti I, Limite G, Pettinato G, Monticelli A, Cocozza S & Contegiacomo A (2007). Triplet repeat instability correlates with dinucleotide instability in primary breast cancer. Oncology
Reports 17: 193-199
Polat E, Ince A G, Karaca M & Onus A N (2010). Mining and utilization of mushroom ESTs for microsatellites. Conservation Genetics 11: 1123-1126
Tyrka M, Perovic D, Wardynska A & Ordon F (2008). A new diagnostic SSR marker for selection of the Rym4/Rym5 locus in barley breeding. Journal of
Applied Genetics 49: 127-134
Yamada T, Koyama T, Ohwada S, Tago K, Sakamoto I, Yoshimura S, Hamada K, Takeyoshi I & Morishita Y (2002). Frameshift mutations in the MBD4/MED1 gene in primary gastric cancer with high-frequency microsatellite instability. Cancer