Full Terms & Conditions of access and use can be found at
http://www.tandfonline.com/action/journalInformation?journalCode=tprs20
Download by: [Bilkent University] Date: 13 November 2017, At: 03:04
International Journal of Production Research
ISSN: 0020-7543 (Print) 1366-588X (Online) Journal homepage: http://www.tandfonline.com/loi/tprs20
Balancing of U-type assembly systems using
simulated annealing
E. Erel , I Sabuncuoglu & B. A. Aksu
To cite this article: E. Erel , I Sabuncuoglu & B. A. Aksu (2001) Balancing of U-type assembly systems using simulated annealing, International Journal of Production Research, 39:13, 3003-3015, DOI: 10.1080/00207540110051905
To link to this article: http://dx.doi.org/10.1080/00207540110051905
Published online: 14 Nov 2010.
Submit your article to this journal
Article views: 153
View related articles
Balancing of U-type assembly systems using simulated annealing
E. ERELy*, I. SABUNCUOGLUz and B. A. AKSUz
The paper presents a new simulated annealing (SA)-based algorithm for the assembly line-balancing problem with a U-type con® guration. The proposed algorithm employs an intelligent mechanism to search a large solution space. U-type assembly systems are becoming increasingly popular in today’s modern production environments since they are more general than the traditional assem-bly systems. In these systems, tasks are to be allocated into stations by moving forward and backward through the precedence diagram in contrast to a typical forward move in the traditional assembly systems. The performance of the algor-ithm is measured by solving a large number of benchmark problems available in the literature. The results of the computational experiments indicate that the proposed SA-based algorithm performs quite eŒectively. It also yields the optimal solution for most problem instances. Future research directions and a compre-hensive bibliography are also provided here.
1. Introduction
The ® rst assembly line is credited to Henry Ford in 1915 after which they have been widely used in various production systems. This recognition of assembly lines is attributabl e to the high productivity levels achieved in mass production environ-ments. Until 1955, only trial-and-error methods have been used to design assembly lines; Salveson (1955) is the ® rst researcher who presented a formal mathematical analysis of the problem. Bowman (1960) proposed two LP formulations. Since then, an immense amount of literature has accumulated in this area, ranging from exact algorithms (DP, LP, IP) to various heuristics.
Line balancing is the process of allocating a set of tasks (the smallest indivisible portions of the assembly operation) to an ordered sequence of stations in such a way that some performance measures (e.g. cycle time, number of stations) are optimized subject to the precedence relations among the tasks. Task time and station time are de® ned as the duration to perform a task and the actual amount of work, in time units, assigned to a station, respectively. The maximum station time constitutes the cycle time. An example will be used to clarify these concepts. Consider Jackson’s 11-task problem depicted in ® gure 1. The numbers in and below the nodes represent the tasks and the associated task times, respectively. The directed arrow between tasks i and j implies that task i is a predecessor of task j. Assuming a cycle time of 10 (this might be imposed to achieve a certain production rate), a solution of the line-balan-cing problem is depicted in ® gure 2a. Note that the tasks are allocated to six stations with station times of 9, 9, 8, 7, 8 and 4, respectively.
International Journal of Production Research ISSN 0020± 7543 print/ISSN 1366± 588X online # 2001 Taylor & Francis Ltd
http://www.tandf.co.uk/journals DOI: 10.1080/00207540110051905
Revision received December 2000.
{ Department of Management, Bilkent University, Ankara 06533, Turkey.
{ Department of Industrial Engineering, Bilkent University, Ankara 06533, Turkey. * To whom correspondence should be addressed. e-mail: [email protected]
As stated above, this problem has been extensively studied in the literature for decades. These studies, together with a taxonomy of the problem, are summarized in several survey papers (Baybars 1986, Ghosh and Gagnon 1989, Erel and Sarin 1998). In 1993, Monden identi® ed more general con® gurations (U- and S-type topolo-gies) of the traditional straight-line system. He observed these con® gurations in Japanese manufacturing companies. The important characteristic of these new systems is that multiskilled (cross-trained) workers perform various tasks of diŒerent stations along the production line. This feature allows assigning tasks both from the beginning and the end of the precedence diagram to the same stations. In terms of the solution of the line-balancing problem, this implies that the solution of the U-type con® guration dominates the solution of the traditional straight-line con®
gura-E. Erel et al.
Figure 1. Precedence diagram and the task times of the example problem.
Figure 2. Schematic view of (a) straight line and (b) U-line con® gurations for the example problem.
tion due to the reduced precedence relations (i.e. the number of stations on a U-type con® guration is less than or equal to the number required on a straight line). On the other hand, the problem of assigning tasks on a U-type con® guration is more com-plex than a straight line due to the much larger search space.
Figure 2b depicts a solution of the previous example with a U-type con® guration. In this solution, the worker in station 1 ® rst completes tasks 1 and 2 of an item and then completes task 11 of the previous item. As noted, workers in a U-type con® g-uration may work on two diŒerent items within the same cycle. Note also that this solution has ® ve stations (one less than the straight-line con® guration) with station times of 10, 9, 10, 8 and 8, respectively.
The need for U-type assembly con® guration arises from attempts to improve productivity with greater ¯ exibility. Monden (1993) discusses these issues in the context of the Toyota Production System. In general, the following advantages of the U-type con® guration can be stated: (1) a quick response to changes in the environment (machine breakdowns, worker absenteeism, etc.) due to the possibility of reallocating the cross-trained workers, (2) the ease to adopt to changes in cycle time, because of the high potential of rebalancing the line with a new cycle time, (3) a high level of participation of workers to improve production process, (4) the ¯ ex-ibility of adding/removing workers (rebalancing lines), and, most importantly, (5) the number of stations required by a U-line is never greater than the one by a traditional line. In spite of these bene® ts, U-lines present some operational di cul-ties in scheduling the movements of workers, dispatching jobs, material handling activities and WIP control. Moreover, the line-balancing problem of an U-line is much more complicated than the traditional line due to the increased search space. This paper develops a new simulated annealing-base d algorithm to minimize the number of stations in such a U-type assembly line. An assembly line will be called a U-line hereafter.
The rest of the paper is as follows. The relevant literature on the U-type line-balancing problem and simulated annealing are given in Section 2. This is followed by the structure of the proposed algorithm and the example in Section 3. Computational results are presented in Section 4. Conclusions and future research directions are given in Section 5.
2. Literature review
The literature on the U-lines is sparse and new relative to the traditional straight lines. The research on U-lines can be classi® ed into two groups: line balancing (ULB) and production ¯ ow lines. In the former group, the researchers study the problem of balancing U-type assembly systems to minimize either cycle time or the number of stations. In the latter group, the emphasis is on identifying the important design factors and their eŒects on the performance of U-type ¯ ow lines. Since the latter case is not within the scope here, see Nakade and Ohno (1997, 1999), Nakade et al. (1997) and Miltenburg (2000).
As stated above, Monden (1993) brought U-lines to the attention of the scienti® c community. The ® rst ULB study in the literature was by Miltenburg and Wijngaard (1994), who developed a DP formulation for the single-model U-line to minimize the number of stations. The proposed algorithm was used to solve problems with up to 11 tasks. The authors presented a Ranked Positional Weight Technique (RPWT)-based heuristic for larger size problems (111-task problems have been solved). Later, Miltenburg and Sparling (1995) developed three exact algorithms to solve the ULB
E. Erel et al. A u th o rs M et h o d o lo gy P ro b le m sp ec s S o lv ed p ro b le m s O b je ct iv es M il te n b u rg an d W ij n ga ar d D P fo rm u la ti o n si n gl e m o d el u p to 11 ta sk s n u m b er o f st at io n s (1 99 4) R P W T -b as ed h eu ri st ic u p to 11 1 ta sk s M il te n b u rg an d S p ar li n g D P -b as ed ex ac t al go ri th m si n gl e m o d el u p to 40 ta sk s n u m b er o f st at io n s (1 99 5) d ep th -® rs t an d b re ad th -® rs t B & B S p ar li n g an d M il te n b u rg (1 99 8) h eu ri st ic m ix ed m o d el u p to 25 ta sk s n u m b er o f st at io n s U rb an (1 99 8) IP fo rm u la ti o n si n gl e m o d el u p to 45 ta sk s n u m b er o f st at io n s M il te n b u rg (1 99 8) D P -b as ed ex ac t al go ri th m U -l in e fa ci li ty w it h in d iv id u al U -l in es n u m b er o f st at io n s se ve ra l in d iv id u al w it h u p to 22 ta sk s an d id le ti m e in a U -l in es si n gl e st at io n S p ar li n g (1 99 8) h eu ri st ic U -l in e fa ci li ty w it h u p to n in e U -l in es n u m b er o f st at io n s se ve ra l in d iv id u al w it h u p to 18 ta sk s U -l in es in ea ch U -l in e S ch o ll an d K le in (1 99 9) B & B -b as ed h eu ri st ic si n gl e m o d el u p to 29 7 ta sk s n u m b er o f st at io n s, cy cl e ti m e, an d b o th T ab le 1. S u m m ar y o f th e w o rk co n d u ct ed o n U -t yp e as se m b ly li n es .
problem. The ® rst was based on a reaching DP formulation, whereas the other two were breadth- and depth-® rst branch-and-boun d (B&B) algorithms. Their computa-tional experiments indicated that the B&B-based algorithms were more e cient (taking less time to reach optimal solutions) than the DP-based algorithm. On average, the breadth-® rst algorithm required less computational time than the depth-® rst algorithm. However, depth-® rst algorithms either found the optimal sol-ution quickly or took a very long time. The authors solved problems with up to 40 tasks.
Later, Urban (1998) developed an IP formulation for the same problem and managed to solve problems with up to 45 tasks. Eliminating the variables represent-ing assignment of tasks to certain stations reduced the size of the model.
Scholl and Klein (1999) solved the ULB problem by the B&B procedure, which was adapted from their previous algorithm called SALOME developed for the straight ALB problem. The new procedure, called ULINO (U-line optimizer), is basically a depth-® rst B&B algorithm with various bounding and dominance rules to minimize the number of stations, or cycle time, or both. In this study, the authors reported the results of some preliminary computational tests on problems with up to 297 tasks; the procedure yielded promising results especially for the objective of minimizing number of stations.
Mixed-model U-lines were studied by Sparling and Miltenburg (1998). They devel-oped a heuristic procedure for the U-line by which diŒerent products were assembled simultaneously. Their approximate solution algorithm that merges each model’s precedence graph into a single precedence graph solved problems with up to 25 tasks. Miltenburg (1998) proposed a reaching DP formulation for a U-line facility that consisted of numerous U-lines connected by multiline stations. The DP is capable of balancing with any number of U-lines provided that individual U-lines do not have more than 22 tasks and do not have wide, sparse, precedence graphs. Sparling (1998) developed heuristic solution algorithms for a U-line facility consisting of individual U-lines operating at the same cycle time and connected with multiline stations. Travel time between tasks and U-lines were also considered. The author solved problems with up to nine individual U-lines which have up to 18 tasks each.
All these studies have demonstrated that the ULB is an important problem for today’s modern assembly systems. There are several exact methods for their solution. However, as can be noted in table 1, up to 45-task problems can be optimally solved due to the complex nature of the problem. Hence, as also stated by Miltenburg (1998), computationally more eŒective heuristic procedures are needed for larger-sized problems. In the present paper, such a procedure is proposed that can easily handle more than 100-task problems.
3. Proposed SA-based algorithm 3.1. Motivation
As stated before (Baybars 1986, Miltenburg and Sparling 1995, Miltenburg 1998, Sparling and Miltenburg 1998, Sabuncuoglu et al. 1999), ALB problems are combi-natorial problems. Since the exact methods (DP and B&B) can handle only a limited size, heuristics are generally recommended for large-size problems.
Although numerous heuristics with diŒerent characteristics have been developed for the line-balancing problems (for a comprehensive review of the ALB problems, see Erel and Sarin 1998), there are only two heuristic procedures proposed for the U-type ALB problems in the literature. The ® rst is based on the well-known RPWT of
Helgeson and Birnie (1961) and is adapted for the U-type ALB problem by Miltenburg and Wijngaard (1994). This is a single-pass greedy heuristic and, hence, it may easily get stuck at a local optimum. The second heuristic is based on the B&B technique (Scholl and Klein 1999). It is an optimum-seeking procedure (a depth-® rst multi-pass method) that attempts to optimize the number of stations, cycle time, or both.
In the present paper, a new heuristic is proposed that utilizes the concepts of simulated annealing (SA) within an intelligent search mechanism. The initial moti-vation was to see the performance of a fairly straightforward application of SA in such a combinatorial problem environment. However, during the algorithmic con-struction, a new way of searching the solution space was devised that, together with SA, resulted in better solutions. There are mainly two components of the proposed algorithm: a solution generator module and an SA module. As will be discussed in detail below, the ® rst module generates a new solution by relaxing the cycle time constraint. The role of SA is to take over this solution and obtain feasible task assignments. In contrast to the existing SA applications in the literature where the goal is to optimize a certain performance measure, SA was employed to reconstruct the feasibility. Hence, the application is diŒerent than the traditional applications of SA.
In general, SA is a metaheuristic, which is already proven to be very eŒective in dealing with combinatorial problems (Kuik and Salomon 1990, van Laarhoven et al. 1992, Suresh and Sahu 1994). To the best of our knowledge, the present study is the ® rst SA application to the U-type ALB problem. The other application in the line-balancing literature (Suresh and Sahu 1994) is for the stochastic ALB problem. The SA module in the proposed algorithm diŒers from theirs with respect to the objective function, neighbour generation and internal structure.
As a background information about SA, we note the following. SA is a random search technique that has received considerable interest from researchers in various ® elds; it has been especially applied to the problems that are di cult to solve (i.e. combinatorial problems). This search technique is ® rst proposed by Kirkpatrick et
al. (1983) for optimization problems by inspiring from the physical annealing of
metals. SA simulates the change in the energy of the system subject to a cooling process until a frozen state is reached. The states of the physical system and the energy of a state correspond to the solutions and the objective function value of the optimization problem, respectively. The details and a lengthy discussion of SA are beyond the scope of this paper, but see Johnson et al. (1989, 1991) and Reeves (1993).
3.2. Overview of the algorithm
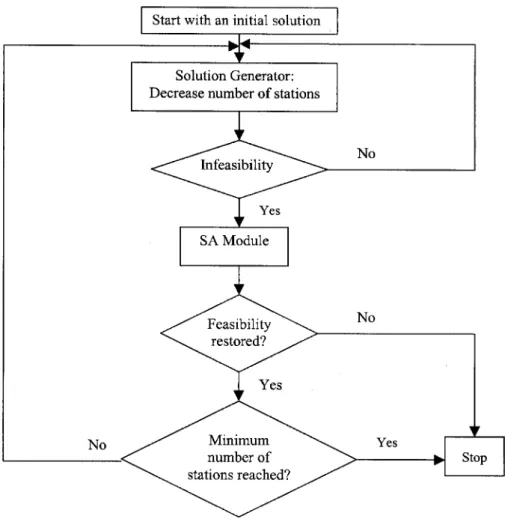
The structure of the proposed algorithm is illustrated in ® gure 3. It consists of two main parts: the solution generator and SA module. The solution generator is a mechanism that generates a new (and better) solution from the old solution by relaxing the cycle time constraint. Then, the SA module takes the solution and reallocates the tasks to stations with the objective of minimizing the maximum station time; hence, it attempts to construct a feasible allocation. These two stages of the algorithm are invoked consequently until a stopping criterion is met; the algorithm stops either when a prespeci® ed time limit is exceeded, or when the mini-mum number of stations is obtained, or when a feasible allocation cannot be recon-structed by the SA module (in that case it returns to the previous feasible solution).
E. Erel et al.
3.2.1. Solution generator
Initially, tasks are assigned sequentially to separate stations (i.e. number of stations equals to number of tasks). This initial solution is obviously feasible but not a good one due to the excessive number of stations. Hence, one has to reduce the number of stations by reallocating tasks. Given an initial or a previous solution (i.e. current allocation of the tasks to the stations satisfying all the precedence and cycle time constraints), the solution generator checks each pair of subsequent stations and combines one of the two adjacent stations that yield the minimum total station time. As a result, it ® nds a new assembly line design with one less station than the previous one. This process is repeated until the station time of the combined station exceeds the cycle time (i.e. leading to infeasibility). When an infeasibility is detected, as will be explained below, the SA module is invoked to ® nd a feasible allocation by mini-mizing the maximum station time. If a feasible allocation is found, the generator
Figure 3. Structure of the proposed algorithm.
further decreases the line length. Otherwise, the algorithm terminates with the pre-vious feasible solution. To achieve feasibility, SA reassigns the tasks in the combined station obtained by the solution generator to other stations by minimizing the maxi-mum station time.
3.2.2. SA module
The goal of the SA module is to reconstruct feasibility for the solution produced by the solution generator. In a typical SA application, the analyst determines the initial temperature, temperature reduction, cost function and neighbour generation scheme. These are explained below.
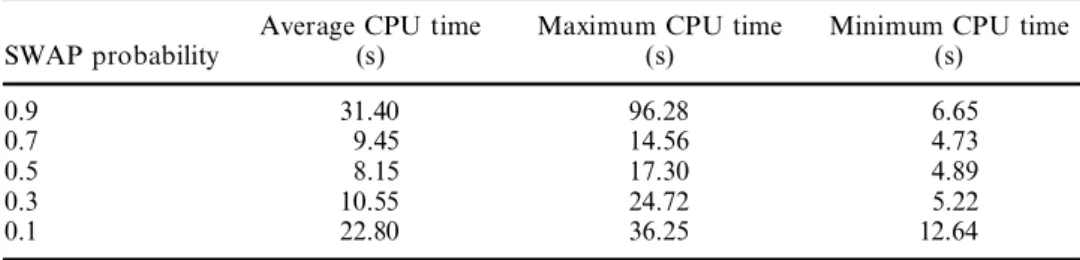
3.2.2.1. Neighbour generation. Generating a neighbour of the current solution is an important decision since it directly aŒects the e ciency of the algorithm. In the proposed algorithm, two operators are implemented: interchange (SWAP) of two tasks and inserting (INSERT) a task to a diŒerent station. In the former case, two randomly selected tasks from diŒerent stations are simply exchanged. In the latter case, a randomly selected task is inserted into the station with the minimum station time. In each case, feasibility of the resulting change (in terms of satisfying the precedence relations) is checked; the process is repeated until a feasible move is obtained. In order to determine the SWAP and INSERT probabilities, pilot ex-periments (the 83-task problem of Arcus is solved for 10 diŒerent seeds) are con-ducted. Based on the results (considering both the average CPU time and solution quality), SWAP and INSERT probabilities (p) are set to 0.5 (table 2).
3.2.2.2. Temperature setting. Setting the initial temperature along with the
tem-perature reduction scheme is another important decision in SA applications. Initial temperature is usually set high to reduce the possibility of getting trapped at a local optimum. Then, this temperature is reduced gradually to achieve better solutions.
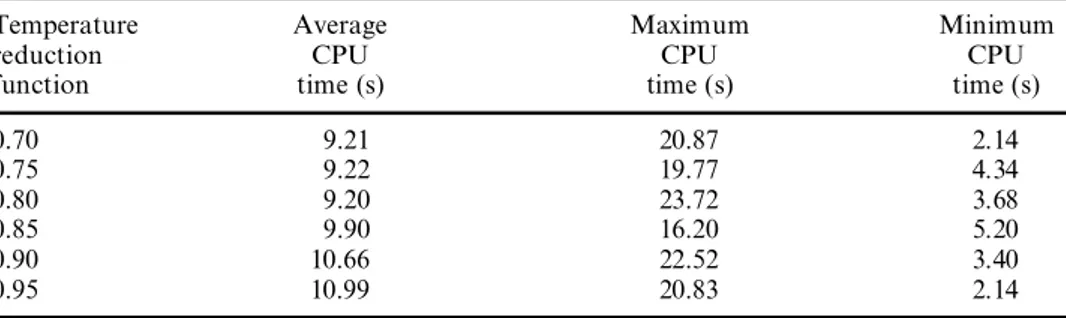
Again, we conducted pilot simulation experiments with 10 diŒerent seeds on the 83-task problem of Arcus to determine the initial temperature and temperature reduction function. Based on the results, we have set the initial temperature to 80 and used a linear temperature reduction function of 0.80 T. As seen in tables 3 and 4, these levels yield the minimum average CPU time. It should be stated here that similar results for initial temperature and temperature reduction function have been obtained from the pilot runs conducted on other test problems.
E. Erel et al.
Average CPU time Maximum CPU time Minimum CPU time
SWAP probability (s) (s) (s) 0.9 31.40 96.28 6.65 0.7 9.45 14.56 4.73 0.5 8.15 17.30 4.89 0.3 10.55 24.72 5.22 0.1 22.80 36.25 12.64
Table 2. Computation times of the algorithm for the 83-task problem for diŒerent SWAP probabilities.
3.2.2.3. Cost function. We have used the maximum station time as the cost of the
SA module. The reason for using this cost measure is that the feasibility is achieved indirectly by minimizing the maximum station time. By this way, we aim to eliminate the infeasibility caused by the station (with the maximum station time) exceeding the cycle time.
The SA module terminates when no change is observed for three consecutive trials at a speci® c temperature. An illustrated example is given below to clarify further the logic behind the algorithm.
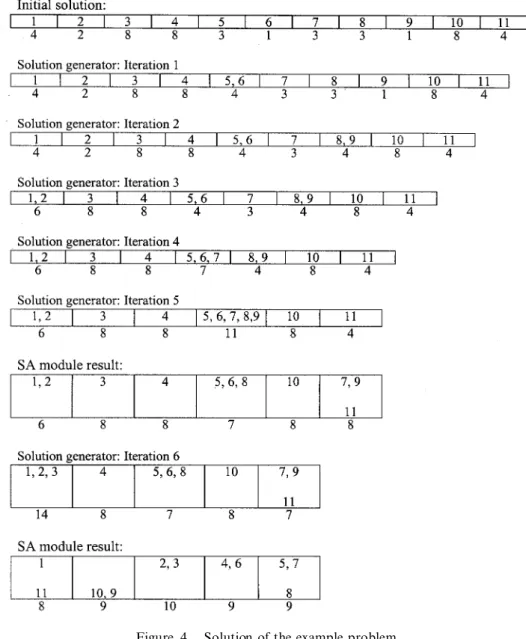
3.2.2.4. Example. Consider Jackson’s 11-task problem depicted in ® gure 1 (dis-cussed above). The solution of the example by the proposed algorithm can be seen in ® gure 4. The boxes and the numbers in them represent the stations and tasks assigned to these stations, respectively. The numbers below the stations represent the associated station times. Initially, each task is assigned to a diŒerent station that results in a line design with 11 stations (i.e. one task for each station). Then, the solution generator takes this feasible, but certainly not the optimal solution, and searches for the station pair with the minimum total station time. In the ex-ample, stations 5 and 6 are combined into a single station, since these stations yield the minimum total station time (3 ‡ 1 ˆ 4). Then stations 7 and 8 are com-bined and this process is repeated until a station time exceeds the cycle time (i.e. infeasibility is encountered). In the example, infeasibility is ® rst detected when the line length is reduced to six stations (station 4 has a station time ˆ 11). The SA module takes this infeasible solution and attempts to reconstruct feasibility. In the
Average Maximum Minimum
Initial CPU CPU CPU
temperature time (s) time (s) time (s)
60 9.20 17.47 4.17 80 9.06 21.25 3.97 100 12.07 26.76 5.11 120 13.88 47.68 3.52 140 13.89 30.74 6.54 160 14.43 26.53 7.30 180 15.95 31.56 7.14 200 16.13 41.22 9.24
Table 3. Data about the simulated annealing runs to obtain initial temperature.
Temperature Average Maximum Minimum
reduction CPU CPU CPU
function time (s) time (s) time (s)
0.70 9.21 20.87 2.14 0.75 9.22 19.77 4.34 0.80 9.20 23.72 3.68 0.85 9.90 16.20 5.20 0.90 10.66 22.52 3.40 0.95 10.99 20.83 2.14
Table 4. Data about the simulated annealing runs to obtain temperature reduction function.
example, the tasks are allocated/reallocated to the stations by the SA module yielding a feasible solution with a maximum station time ˆ 8. Next, the solution generator is again invoked to further reduce the line length. In this second itera-tion, the generator yields a ® ve-station design with a maximum station time ˆ 14. Then the SA module reallocates the tasks to achieve feasibility. In the example, a feasible solution is obtained with a maximum station time ˆ 10. At the end of this stage, the algorithm terminates, since the theoretical minimum number of stations is reached …d45=10e ˆ 5†. Note that a lower bound on the number of stations is equal to dsummation of task times/cycle timee, where dxe is the smallest integer > x. The resulting design has a U-type con® guration.
E. Erel et al.
Figure 4. Solution of the example problem.
4. Computationa l results
The performance of the proposed algorithm is measured with the well-known benchmark problems in the literature. These problems have been previously tested by diŒerent researchers in the U-type ALB literature. They were classi® ed here into two data sets. The ® rst was created from earlier studies in the area (Miltenburg and Wijngaard 1994, Urban 1998, HoŒmann 1990). The second set is relatively new and has been developed by Scholl and Klein (1999) as the most complex data set for this problem.
We classify the ® rst data set into three categories: small (up to 11 tasks), medium (up to 45 tasks) and large (above 45 tasks). Optimal solutions of the small-size problems are already given by Miltenburg and Wijngaard (1994) using a DP for-mulation. For the medium-size problems, Urban (1998) oŒers the optimal solution using an IP formulation. For the large-size problems, optimal solutions have not yet been reported in the literature; only the RPWT results (not necessarily optimal) are available for these problems.
The results indicated that the proposed algorithm ® nds the optimal solution in 20 out of 21 instances. On the other hand, the RPWT ® nds the optimal solution in 17 instances. For the medium-size problems, the proposed algorithm ® nds the optimal solution of all the 23 instances, whereas RPWT ® nds the optimal solution for only 11. Optimal U-line solutions of large-size problems are not available in the literature with only the optimal straight-line solutions being reported there. Hence, the pro-posed algorithm is compared with the results of the RPWT. It is interesting to note that both the proposed algorithm and the RPWT yield the same results on these instances. Finally, as can be expected, the U-line solutions by these heuristics are better than or identical to the optimal straight-line solutions (better solutions are obtained in eight out of 62 instances, yielding the same for the remaining ones).
Another experimentation conducted in the ULB literature is due to Scholl and Klein (1999b). Here, the B&B-based heuristic procedure, ULINO (U-Line Optimizer), was applied to the ULB problem. ULINO is adapted from the authors’ previous algorithm called SALOME (Simple Assembly Line Balancing Optimization Method) for the ALB problem (Scholl and Klein 1999a). In these studies, Scholl and Klein formed a new data set of 168 problems with varying problem sizes ranging from 25 to 297 tasks. (The data set is available at: http://www.bwl.tu-darmstadt.de/ bwl3/) Scholl and Klein (1999b: 732) compared their algorithm with the RPWT of Helgeson and Birnie (1961), as modi® ed by Miltenburg and Wijngaard (1994), and found that the performance of ULINO was superior to RPWT.
At the second stage of the present computational experiments, we applied our algorithm to this new data set and compared the results with those of ULINO. The results indicate that the algorithm ® nds the optimal solution in 112 out of 168 problems. In 13 problems of the remaining 56 instances, the algorithm yielded the solution within the optimal solution range provided by Scholl and Klein on their website. Together with these instances, we obtained 125 optimal solutions out of 168 instances. When each instance was analysed, it was noted that the proposed algor-ithm generates better solutions than ULINO for eight instances. In ® ve instances, the results of ULINO are provided by intervals and the present solutions fall into these intervals. In the remaining 155 instances both algorithms produce the same results. Later, during the process of preparing this paper, Scholl and Klein (1999b) reported the improved results with their algorithm (150 instances are solved to optimality). The computation time requirements of the both algorithms are comparable. They
basically solved reasonably complex and large size problems (297 tasks) in seconds. Besides, these problems are not operational problems (like a scheduling problem) that require frequent and on-line solutions. Hence, the solution time by itself is not a major issue in assessing the quality of algorithms. In terms of the solution quality, it is concluded that the algorithm proposed here is a competent solution procedure of the ULB problem in the literature.
5. Conclusions and further research directions
This paper studied the U-type assembly line-balancing problem and an SA-based heuristic algorithm was developed. The performance of the proposed algorithm is measured against two well-known optimum-seeking algorithms (DP- and IP-based algorithms) and the heuristic procedures. The results of the computational experi-ments on various test problems indicate that the proposed method performs well. Besides, the computational requirements are not high; the average computation time for an 83-task problem (i.e. large-size problem) is about 31.4 s on a Pentium II 266 kHz machine with 32 MB RAM. The computational success of the SA-based algorithm can be attributed to the intelligent search of a larger search space.
As noted previously, most of the line-balancing algorithms in the literature are developed for solving the ALB problem (there are only a few algorithms for the ULB problem). However, as indicated by many researchers (Miltenburg and Sparling 1995, Urban 1988, Scholl and Klein 1999b), the recent trend in the applications of JIT principles has led to a widespread use of U-lines in assembly systems. In this context, the present study oŒers a new and e cient solution procedure for the need of the industry.
We can also list the following research directions: ® rst, the proposed method-ology can be applied to more di cult problems such as mixed/multi-model assembly systems, assembly lines with stochastic task performance times and diŒerent U-line con® gurations. Second, it would be interesting to use other metaheuristics (e.g. genetic algorithms, tabu search) in the U-type assembly line balancing problem. By that way, one can assess the relative eŒectiveness of the modern search heuristics. Third, it is also important to mention that there is a need to develop exact algorithms that can handle large-size problems. Finally, we believe that this metaheuristic approach can be eŒectively used to solve the Type II problem (i.e. minimizing cycle time subject to a given number of stations) by iteratively solving a series of Type I problems (i.e. minimizing number of stations given a cycle time).
References
Baybars, I., 1986, A survey of exact algorithms for the simple assembly line balancing prob-lem. Management Science, 32, 909± 932.
Bowman, E. H., 1960, Assembly-line balancing by linear programming. Operations Research, 8, 385± 389.
Erel, E. and Sarin, S. C., 1998, A survey of the assembly line balancing procedures.
Production Planning and Control, 9, 414± 434.
Ghosh, S. and Gagnon, R. J., 1989, A comprehensive literature review and analysis of the design, balancing and scheduling of assembly systems. International Journal of
Production Research, 27, 637± 670.
Helgeson, W. B. and Birnie, D. P., 1961, Assembly line balancing using the ranked posi-tional weight technique. Journal of Industrial Engineering, 12, 394± 398.
Hoffmann, T. R., 1990, Assembly line balancing: a set of challenging problems. International
Journal of Production Research, 28, 1807± 1815. E. Erel et al.
Johnson, D. S., Aragon, C. R., McGeoch, L. A. and Schevon, C., 1989, Optimization by simulated annealing: an experimental evaluation, Part I, Graph partitioning. Operations
Research, 37, 865± 892.
Johnson, D. S., Aragon, C. R., McGeoch, L. A. and Schevon, C., 1991, Optimization by simulated annealing: An experimental evaluation, Part II, Graph coloring and number partitioning. Operations Research, 39, 378± 476.
Kirkpatrick, S., Gelatt, C. D. and Vecchi, M. P., 1983, Optimization by simulated anneal-ing. Science, 220, 671± 680.
Kuik, R. and Salomon, M., 1990, Multi-level lot-sizing problem: evaluation of a simulated annealing heuristic. European Journal of Operational Research, 45, 25± 37.
Miltenburg, J., 1998, Balancing U-lines in a multiple U-line facility. European Journal of
Operations Research, 109, 1± 23.
Miltenburg, J., 2000, The eŒect of breakdowns on U-shaped production lines. International
Journal of Production Research, 38, 353± 364.
Miltenburg, J. and Sparling, D., 1995, Optimal solution algorithms for the U-line balan-cing problem. Working Paper, McMaster University, Hamilton.
Miltenburg, J. and Wijngaard, J., 1994, The U-line balancing problem. Management
Science, 40, 1378± 1388.
Monden, Y., 1993, Toyota Production System (Norcross, GA: Industrial Engineering and Management Press, Institute of Industrial Engineers).
Nakade, K. and Ohno, K., 1997, Stochastic analysis of a U-shaped production line with multiple workers. Computers and Industrial Engineering, 33, 809± 812.
Nakade, K. and Ohno, K., 1999, An optimal worker allocation problem for a U-shaped production line. International Journal of Production Economics, 60± 1, 353± 358. Nakade, K., Ohno, K. and Shanthikumar, J. G., 1997, Bounds and approximations for
cycle times of a U-shaped production line. Operations Research Letters, 21, 191± 200. Reeves, C. R., 1993, Modern Heuristic Techniques for Combinatorial Optimization Problems
(New York: Wiley).
Sabuncuoglu, I., Erel, E. and Tanyer, M., 1999, Assembly line balancing using genetic algorithms. Journal of Intelligent Manufacturing, 11, 295± 310.
Salveson, M. E., 1955, The assembly line balancing problem. Journal of Industrial
Engineering, 6, 18± 25.
Scholl, A. and Klein, R., 1999a, Balancing assembly lines eŒectively Ð a computational comparison. European Journal of Operational Research, 114, 50± 58.
Scholl, A. and Klein, R., 1999b, ULINO: optimally balancing U-shaped JIT assembly lines. International Journal of Production Research, 37, 721± 736.
Sparling, D., 1998, Balancing just-in-time production units: the N U-line balancing problem.
Information Systems and Operational Research, 36, 215± 237.
Sparling, D. and Miltenburg, J., 1998, The mixed-model U-line balancing problem.
International Journal of Production Research, 36, 485± 501.
Suresh, G. and Sahu, S., 1994, Stochastic assembly line balancing using simulated annealing.
International Journal of Production Research, 32, 1801± 1810.
Urban, T. L., 1998, Note. Optimal balancing of U-shaped assembly lines. Management
Science, 44, 738± 741.
van Laarhoven, P. J. M., Aarts, E. H. L. and Lenstra, J. K., 1992, Job shop scheduling by simulated annealing. Operations Research, 40, 113± 125.