Q 1997 IUPAC
Electron spectroscopic investigation
of polymers
and glasses
Sefik Siizer
Department of Chemistry, Bilkent University, 06533 Bilkent, Ankara, Turkey.
Abstract: X-ray induced photo and Auger electron spectroscopic techniques have been applied to investigate conducting polymers, their blends and some glasses. In the Nls region of the spectra of films containing polypyrrole the peak corresponding to
fl
at 402.0 eV is separated from the neutral N. Intensity of the"+
peak can be correlated with electrical conductivity of the films and the spectroscopically derived ratio of F/N+ is close to 4 indicating that one BF4- dopant ion is incorporated for every oxidized nitrogen center. In the spectra of the films of polythiophene and its blends peaks corresponding to S and S+ can not be resolved, but again FIC ratio correlates with theelectrical conductivity. On the basis of measured X P S chemical shifts in the binding energies the chemical state of Sn (+2 or +4) incorporated on to the float glasses could not be assigned. Use of the Auger parameter lets one separate relaxation and chemical contributions. The derived true chemical shifts of Sn on float-glasses are larger than those of SnO andor SnO2 due to the larger ionic environment of the glass matrix.
INTRODUCTION
Over the last three decades electron spectroscopic techniques (both X-Ray Photoelectron Spectroscopy, XPS, and Auger Electron Spectroscopy,
A E S )
have become one of the most important tools of chemist for any type of material characterization. Their surface sensitivity, applicability to any element (except for hydrogen), and capability to distinguish between various valence states through the chemical shifts are the most important assets of these techniques. Application of the electron spectroscopic techniques to electrically conducting polymeric materials in their unblended forms have been extensively reported [ 1-31. Preparation of electroactive polymers with improved chemical andor mechanical properties is still a scientifically and technologically important issue. Blending is one of the ways to achieve this goal. Blends of polypyrrole and polythiophene with polyamide has proved to be quite successfid for some applications [4-61. We have already reported an x-ray photoelectron spectroscopic investigation of polypyrrole and its blends with polyamide [7]. We have extended this study to polthiophene and its blends with polyamide.Coating of Sn and its oxides have technological importance in applications like float-glass production, solar energy cells, protective and conductive coatings etc.. For many applications quantitative data of Sn, like surface coverage or depth profiling, are important parameters sought after. In some applications, however, further information like oxidation state, coordination number etc. are needed. X P S andlor AES studies attempting to distinguish between the two oxides of tin, SnO and Sn02, have found either absence or only a small difference in the core
level binding energies [ 8-1 11. In a different investigation it was demonstrated that although the core level shifts were not significant, X P S of the valence band region could unambiguously
distinguish between the two oxides [ 121. Another parameter which can de derived from the x-ray induced electron spectra is the Auger parameter, introduced by Wagner [13] and further developed by others [ 14,151, can be very informative. In a recent study [ 161, we have reported the Auger parameters of the tin metal, tin oxides and chlorides. Here, we report our study to float glasses with different thickness and a tin oxide coated conducting glass. Tin is incorporated on to both surfaces of glasses produced by the float technique (float glasses). Incorporation of tin on to the tin-bath surface of the glass is through contact with liquid tin and is homogeneous while in the atmospheric surface it is known to be through precipitation of tin vapors and in forms of islands
EXPERIMENTAL
The electron spectrometer is a KRATOS ES300 with AlKa source. Quantitative data from the X P S data is obtained using the standard procedures [ 171.
Conducting polymer blend films were prepared by electrochemical polymerization of pyrrole or thiophene onto a polyamide dipcoated electrode at a constant predetermined potential. Electrochemical deposition of polypyrrole was carried out in a three compartment cell equipped with Pt foils (1.0 cm2 each) as working electrode (at +l.lV) and counter electrodes. A capillary (Ag/Ag+) was used as reference electrode and the solvent/electrolyte couple was acetonitrile/tetrabutylammonium tetrafluoroborate. For polythiophene working electrode was operated at +2.0V. Electrochemical reduction was achieved by reversing the polarity and discharging the prepared films. X-ray photoelectron spectra of the various films were recorded after thorough washing with the solvent and drying the films while intact on their platinum electrodes. Float glasses with thicknesses of 3, 4, 5, 6 and 10 mm were provided by the local producer (Tiirkiye Sige-Cam A.S.) while the conducting tin oxide glass was a commercial tin oxide glass. Surface of the samples of appropriate size were wiped by a clean tissue paper before introduction into the spectrometer. Pressure in the analyzer chamber is kept below 5x10⁻⁹ torr during analysis. Depth profiling was carried out using either (i) in-situ
Ar+
etching with lkeV ions or (ii) prior to introduction to the spectrometer with 2% HF solution.RESULTS
AND
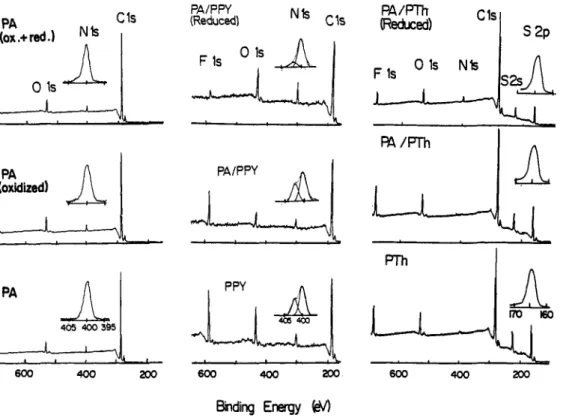
DISCUSSION Conducting PolymersFig. 1 displays parts of the photoelectron spectra of polypyrrole-only (PPy), polyamide/polypyrrole (PAPPY), polythiophene (PTh) and polyamide/polythiophene blends in their conducting forms and after electrochemical reduction. (PAPTh). Spectra of polyamide after electrochemical oxidation (PA(oxidized)) and further reduction (PA(ox.+red.)) are also included to ensure that electrochemical treatment does not introduce additional features. The strong features are due to Fls, Ols, N l s and Cls and S2s and 2p. Since our x-ray source is not monochromatized the Fls, Cls, S2s and S2p peaks are observed as single peaks at around 686, 285, 228 and 164 eV respectively. The 0 1 s peak around 532 is broad and can be deconvoluted into 2 or 3 components. The N l s peak in films containing polpyrrole has two components at 399.7 and 402.0 eV which can be assigned to the neutral (-N-) and the quaternized nitrogens
(-fl-)
respectively. The relevant data are collected in Table 1. Examination of Figure 1 reveals that no additional features are introduced during electrochemical oxidation andor reduction of the polyamide-only film. The N/C ratio determined from our result is not far from the stckhiometric ratio given by the supplier (0.05). Intensity of theextra peak observed at the high binding energy side, assigned to N+ moieties, correlates with electrical conductivity of the films. The atomic ratio of F to
Nf
derived from our X P S data is close to 4 for these films, indicating that one BF4- dopant ion is introduced for every N+ center. Both the N+ and the F1 s intensities decrease considerably after electrochemical reduction.c
Is PA (ox.+red.) N k 0 1sr
-
1
Nb C I S PA/PPY (Reduced) pA/mReduced)
c'sl
s2p 6M) 400mo
Binding EnergyW)
Fig. 1. A K a induced electron spectra of electrochemically prepared polypyrrole and polythiophene blended with polyamide. Spectra of the films after electrochemical oxidation andlor reduction are also included. Expanded N1 s and S2p levels are also shown.
In the case of films of polythiophene, polyamide/polythiphene as prepared and after electrochemical reduction, our resolution does not permit to distinguish between the neutral S
and its oxidized form S+. Information about electrical conductivities of the films can still be derived from the atomic ratios of F/C. Again the F/C ratio in films of polythiophene and its blend with polyamide are very close to each other and this ratio is smaller in the less conducting electrochemically reduced blend.
Sn Coatings on Glasses
Fig. 2 displays electron spectra (induced by AlKa x-rays) of a 3mm float glass (bottom) and the tin
oxide coated glass (top). Photoelectron lines corresponding to 0 Is, C Is, Si 2s and 2p, Ca 2s and 2p, Sn 4d, 3d and 3p lines as well as 0, Na and Mg KLL and Sn M" (shown in the left side of the figure) Auger lines are the prominent features. Na KLL Auger and Sn 3dy2 lines overlap but can easily be separated by deconvolution. Intensity of Sn lines vary depending on the surface examined (i.e. tin-bath or atmospheric), the thickness of the glass and naturally the etching time. The relevant data are collected in Table 2. The table also contains data on SnO, Sn02 as well as the tin-oxide conducting glass.
1 Omm
Cond. Glassa Sna
SnOa
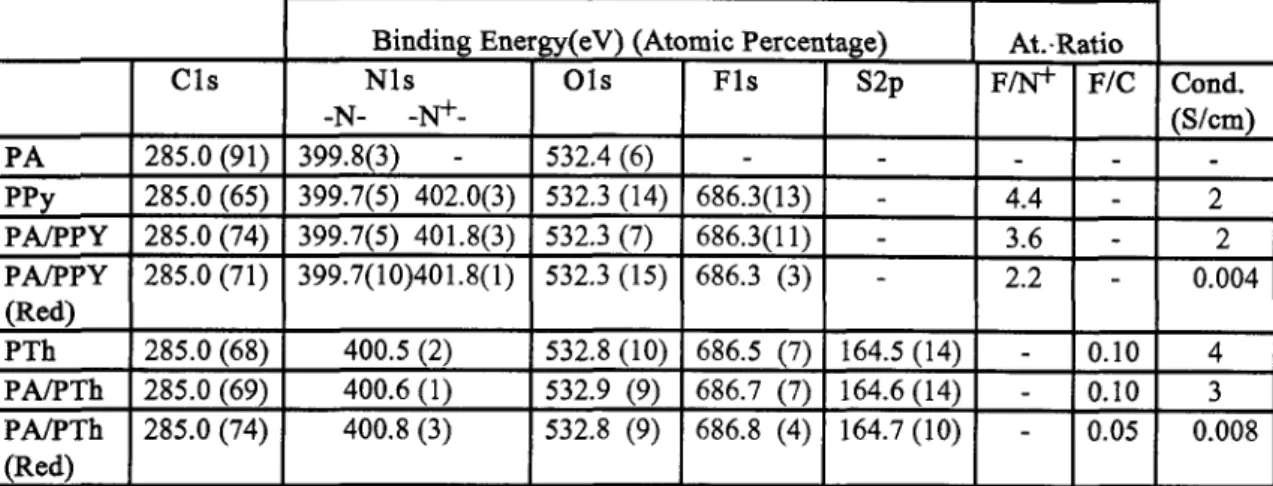
TABLE 1.
X P S
data of electrochemically prepared polypyrrole and polythiophene together with their blends with polyamide.I
I i 488.1 430.5 918.6 -1.8 0.7 0.222 3.22 487.6 431.9 919.5 -1.4 0.6 2.58 485.6 436.7 922.3 487.1 432.5 919.6 -1.3 0.2 0.98 487.5 431.7 919.1 -1.6 0.3.
1.66The measured binding energies of SnO, Sn02 and Sn on glasses are very close to each other. On the basis of the raw binding energies of Sn one can not, unambiguously, decide on the chemical state of Sn. The measured binding energies contain contributions from relaxation effects besides the chemical ones. At this point we must refer to the Auger parameter or the true chemical shift. As can be seen from the insert of Fig. 2, the Sn MNN Auger peaks of Sn02 and SnO exhibit a much larger (close to 1 eV) chemical shift. We can analyze the chemical shifts in binding energies, AEch, using Wagner’s approach of identifying compounds on the basis of their Auger parameters:
a=Eb+Ek
Where Eb is the binding energy of the photoelectron and Ek is the kinetic energy of the Auger electron emitted as a result of Auger process involving the same electron level. The Auger parameter exhibits a much larger shift in various Sn coatings and depends linearly on S d S i ratio (as plotted in the right hand side of Fig. 2). The shift in Eb can be regarded as the sum of (i) the chemical shift, AEch, which depends on the effective charge of the atom, (ii) the relaxation energy. The latter consists of two components, intra and extra atomic relaxations, Eir and Eer determined by the interaction of other electrons within the same atom or the neighboring ones. One can roughly describe them as gas phase (intra-atomic) and solid-state (extra-atomic) contributions. Regarding Eir constant one obtains the binding energy shif3 with respect to zero-valent bulk material (Sn metal): AEb = AEch
+
AEerAs can be seen from the table the chemical shift computed using this procedure is 0.15 eV for SnO and 0.35 eV for Sn02. For Sn coated on glasses, however, the derived shifts vary between 0.5 and 0.8 and are larger than that of Sn02. This can be rationalized if one considers that Sn atoms in the glass matrix are in stronger ionic environment compared to the oxides.
Contributions to the chemical and relaxation terms of the Auger electrons could be expressed as follow^ AEk = -AEch
+
3AEer, A a = -AEb+
AEk, Act = 2AEerThis procedure lets one separate chemical (the true chemical shift) and relaxation contributions from the measured binding energies and Auger parameters.
b CT 918.0 'tT 99.0
1
p % G q
:_I____#
, 0.1 0.2 Snrji -y
420.
440 Sn 3d &qj (eV) ois Cls Sn4d I Sn3d 3R (LL I '. 01s . . .. I _ XK) ,/ 494 Sn3d ,* + , I ' Na , I ,I KLL C b C O P S Ca2pTu Do0 800 600 400 200 0 Binding Energy (N)Fig.2. A K a x-ray induced electron spectra of 3mm float glass (bottom), the tin oxide coated
conducting glass (middle). Th Sn MNN Auger pekas of SnO, Sn02 and the conducting glass are shown as an insert in the left hand-side and change of the Auger parameter as a function of SdSi ratio in various float-glasses are shown on the right hand-side.
This work is supported by T h I T A K , The Scientific and Technical Research Council of Turkey, through the project TBAG-U-15/7.
REFERENCES
1. E.T. Kang, K.G. Neoh and K.L. Tan, Adv.Po1m.Sci. 106, 135 (1993). 2. P. Pfluger and G.B. Street, J:Chem.Phys. 80,544 (1984).
3. W.R. Salaneck WRY Rep.Prog.Phys. 54,1215 (1991).
4. H.L. Wang, L. Toppare and J.E. Fernandez, MacromolecuIes23, 1053 (1987).
5. F. Selampmar, U. Akbulut, T. Yalgm, $. Siizer and L. Toppare, S’th.Mef. 62, 201 (1994). 6. M. Randazzo, L. Toppare and J.E. Fernandez (1 994) Macromolecules 27, 5 102 (1 994). 7. $. Siizer, L. Toppare, G.C. Allen and K.R. Hallam, J:Molec.Struc. 349,243 (1995). 8. W.E. Morgan and J.R. Van Wazer, JPhys.Chem. 77,964 (1973).
9. C:T. Lau and G.K. Wertheim, J: Vac.Sci.Techno1, 15:622 (1978).
10. R.G. Edgell, S. Eriksen and W.R. Flavell, Solid Sfafe Com. 60, 835 (1986). 11. J. Luo, C. Xu, J:Non.Cryst.Solids 119, 37 (1990).
12. J.M. Themlin, M. Chtaib, L. Henrard, P. Lambin, J. Darville and J.M. Gilles, Phys.Rev.B 46, 13. C.D. Wagner, L.H. Gale and R.H. Raymond, AnaLChem. 5 1,466 (1979).
14. T.D. Thomas and P. Weightman P, Phys.Rev.B 33, 5406 (1986). 15. G. Moretti and P.Porta, SurfInferface Anal. 20,675 (1993).
16. T. Voscoboinikov and $. Siizer, Submitfed to LPhys.Chem (1995).
17. J. Chastain, Hanbook ofX-Ray Phofoelectron Spectroscopy, Perkin-Elmer Co (1 992). 18. L. Colombin, H. Charlier, A. Jelli, G. Debras and J. Verbist, J:Non.Cryst.Solids 38, 551
11914 (1992).
(1980).