The relationship between adiponectin levels and
epicardial adipose tissue thickness in non-obese
children with asthma
Cem Ozde,1 Mahmut Dogru,2 Firat Erdogan,3 Ilke Ozahi Ipek,3 Sukriye Ozde4 and Osman Karakaya5
Summary
Background: There is an association between adiponectin (APN) and asthma. However, the mechanisms underlying this association is unclear. APN is a predominantly anti-inflammatory protein with possible signalling activity in the lung that can be secreted by Epicardial Adipose Tissue (EAT). Our hypothesis is that serum APN levels may be directly and simply related to the amount of EAT accumulation, particularly when it is expressed as thickness in children with asthma.
Objective: The aim of this study was to investigate whether serum adiponectin (APN) and epicardial adipose tissue thickness (EATT) have an effect in non-obese children with asthma and in healthy non-asthmatic children, and analyze their relationships with clinical outcomes.
Methods: 68 childrens diagnosed with asthma (20 girls/48 boys) who had applied at the pediatric allergy and clinical immunology clinic of the
hospital were included in this cross-sectional, observational study. The age-matched control group included 39 healthy children (18 girls/21 boys). EATT was measured by transthoracic echocardiography. The serum APN levels were also checked. Statistical analysis was performed by using independent sample t-test and Spearman correlation analyses.
Results: The mean age of the asthma group was 10.2 ± 2.7 years, and the average EATT was found to be 5.7±1.1 mm. The mean age of the control group was 10.5 ± 2.8 years, and the average EATT was found to be 5.1 ± 0.7 mm. The EATT of the asthma group was found to be significantly higher (p < 0.001) in study group. In the asthma group the APN was 10.0 ± 5.3 mg/L, and in the control group the APN was 15.8 ± 10.5 mg/L (p < 0.001). We found that APN was significantly negatively correlated with EATT (r = -0.266, p = 0.006) in asthma and control groups. Conclusion: EATT is associated with non-obese asthmatic childrens. High EATT may be related with high release of pro-inflammatory cytokine and low release of APN. Low levels of APN may be related to low anti-inflammatory effects. Therefore, high EATT and low levels of APN may indicate pro-inflammantory profiles in non-obese asthmatic childrens. (Asian Pac J Allergy Immunol 2015;33:289-95)
Keywords: asthma, adiponectin, epicardial adipose
tissue thickness, non-obese children, echocardiography.
Introduction
Asthma is the most common chronic disease among children and is characterized by chronic inflammation of the airways. Asthma occurs more frequently in children than in adults. The worlwide prevalence of asthma range between 1 and 18%.1
There are various risk factors associated to the development of asthma, and obesity is considered to be one of the most important of them, accross all age groups.2,3 For instance, prospective studies
From 1. Department of Cardiology, Gaziosmanpasa Taksim Education and Research Hospital, Istanbul, Turkey
2. Department of Pediatric Allergy Immunology and Pulmonology, Zeynep Kamil Woman and Child Diseases Education and Research Hospital, Istanbul, Turkey 3. Istanbul Medipol University, Department of Pediatrics, Istanbul, Turkey
4. Department of General Pediatric, Zeynep Kamil Woman and Child Diseases Education and Research Hospital, Istanbul, Turkey
5. Bakırköy Dr. Sadi Konuk Education and Research Hospital, Istanbul, Turkey
Corresponding author: Firat Erdogan E-mail: [email protected] Submitted date: 1/12/2014 Accepted date: 20/4/2015
support a relationship between overweight/obesity in adults and children with asthma.3
Adiponectin is an adipokine (a type of cytokine) produced by adipose tissue and is responsible for the regulation of various body functions. Adiponectin plays an important part in various inflammatory processes. Recent studies have suggested that adiponectin may have an important role in bronchial asthma.4 Adiponectin also has anti-inflammatory
properties, and its levels tend to decrease with increasing amounts of adipose tissue.4
Epicardial adipose tissue (EAT) is a particular form of visceral fat deposited around the heart, and is an indicator of visceral adiposity. EAT is located predominantly in the right ventricular free wall and left ventricular apex.5 EAT produces considerable
amounts of pro-inflammatory and anti-inflammatory cytokines. Some adipokines (e.g., adiponectin) may be secreted from EAT into the coronary circulation due to anatomic proximity to the heart and absence of a fascia separating adipose tissue from the epicardium.6,7 Intracoronary levels of adiponectin
reflect systemic concentrations of adiponectin, and suggest the partial contribution of EAT to plasma levels of adiponectin.8
Significant correlations have been observed between EAT volume detected by magnetic resonance imaging and epicardial adipose tissue thickness (EATT) by echocardiography. Considering the relative simplicity of EATT assessment and its strong correlation with EAT volume, it is therefore reliable and easier to evaluate visceral adiposity through EATT echocardiography.9,10 EAT is a
source of adipokine release but it is not clear if it increases fat accumulation (as reflected by EATT).6
Here, our objectives were to investigate the hypothesis according to which “Serum APN levels may be directly and simply related to the amount of EAT accumulation”, particularly when it is expressed as thickness in children with asthma.
Methods
2.1 Ethical approval of the study protocol
The study protocol was approved by the Ethics Committee of Gaziosmanpaşa Taksim Education and Research Hospital. All patients provided written informed consent prior taking part in the study. We certify that there is no conflict of interest with any authors and financial organization regarding the material discussed in the manuscript.
2.2. Study population
This cross-sectional and multicentered study included 68 children (20 girls/48 boys) with new-onset asthma and 39 children (18 girls/21 boys) without asthma. In accordance with the guidelines of the Global Initiative for Asthma (GINA), asthma was diagnosed based on a history of recurrent or chronic chest symptoms such as cough, wheezing, difficult breathing, and chest tightness that demonstrated clinical reversibility with short-acting bronchodilator treatment.1 We suspected that the
serum APN levels and visceral adipositiy may be influenced by any anti-inflamatory -especially steroids- treatment. For this reason, the group composed of new-onset asthma patients had not started any treatment at the onset of the study.
The body mass index (BMI) was determined for all subjects as obese and nonobese according to their body mass index (BMI) percentile, where obesity was defined as a BMI greater than the 95th percentile for age and gender. The BMI was calculated according to the formula: weight (kg)/height2 (m2).11,12
The control group comprised healthy subjects admitted for routine follow-up to a Well Child Clinic. These subjects had similar demographic characteristics to those of the treatment group.
Patients were excluded from the study if they had: asthma but were obese; suffered an acute asthma attack within the previous 4 weeks and had been treated with systemic corticosteroids; suffered a respiratory tract infection within the previous 4 weeks; cystic fibrosis; bronchiectasis; chromosomal/ genetic disease; deformities of the chest wall; a history of hydatid cysts; hormonal or metabolic disease (e.g., diabetes mellitus, thyroid dysfunction); a history of malignancy; a history of cardiac disease. All patients were evaluated by spirometry based on guidelines set by American Thoracic Society.13
Spirometric measurements were forced vital capacity (FVC), forced expiratory volume in one second (FEV1) and peak expiratory flow rate
(PEFR). From these measurements the ratio FEV1/FVC was calculated. Spirometry measurements
were undertaken using Spirolab II (Medical International Research, Waukesha, WI, USA).14
2.3. Blood analyses
Blood was taken from the antecubital vein of study subjects between 08:00 and 10:00 after 10 h of fasting. Serum were separated from blood by centrifugation (3000 × g, 10 min, 4°C) and stored at –80°C.
Biochemical blood tests were assayed by photometric means with an Architect c1600 Analyzer (Abbott Diagnostics, Chicago, IL, USA). Complete blood count tests were performed by Automatic Hematology Analyzer (Beckman Coulter, USA). Fasting blood glucose was determined by hexokinase method, total cholesterol by the enzymatic method, high density lipoprotein (HDL) by the accelerator selective detergent method, triglyceride by the glycerol phosphate oxidase method, low density lipoprotein (LDL) by the Friedewald formula and using an immunonephelometric method C-reactive protein (CRP) was quantitatively analyzed.
Serum levels of total adiponectin were ascertained using an enzyme-liked immunosorbent assay (ELISA) according to manufacturer guidelines. The limit of detection for the kit was 0.47 µg/mL. A ELx800™ Absorbance Microplate Reader (BioTek, Winooski, VT, USA) was used for analyses. C-reactive protein (CRP) levels were measured based on the nephelometric method using an IMMAGE® 800 Immunochemistry system (Beckman Coulter, Brea, CA, USA). Complete blood count (CBC) was obtained using the LH500 Automatic Hematology Analyzer (Beckman Coulter). Fasting blood glucose (FBG) levels were determined using the hexokinase method. Total cholesterol (TC) levels were determined using enzymatic methods. High-density lipoprotein (HDL) concentrations were obtained using the accelerator selective detergent method. Triglyceride (TG) levels were determined by employing the glycerol-3-phosphate oxidase method. Low-density lipoprotein (LDL) concentrations were determined using the Friedewald formula.
2.4. Echocardiographic assessment and evaluation of EATT
Full evaluation was undertaken in all cases using transthoracic echocardiography (TTE) with two-dimensional (2D) color Doppler, pulse-wave Doppler, and tissue Doppler. EATT was measured and TTE assessment made with a Vivid portable echocardiography device (GE Healthcare, Piscataway, NJ, USA) using a 3.5–7.5 mHz 3S-RS phased-array transducer. All echocardiographic assessments were recorded by a cardiologist and pediatric cardiologist blinded to the study protocol. After evaluation of patients, recorded images were interpreted by another cardiologist.
Parasternal long-axis and parasternal short axis views from 2D and M-Modes using the right
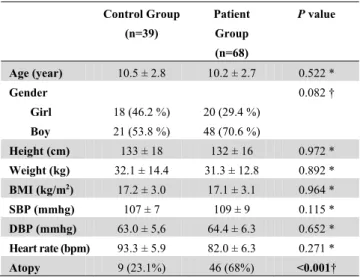
Table 1. Demographic and clinical characteristics
Control Group (n=39) Patient Group (n=68) P value Age (year) 10.5 ± 2.8 10.2 ± 2.7 0.522 * Gender Girl Boy 18 (46.2 %) 21 (53.8 %) 20 (29.4 %) 48 (70.6 %) 0.082 † Height (cm) 133 ± 18 132 ± 16 0.972 * Weight (kg) 32.1 ± 14.4 31.3 ± 12.8 0.892 * BMI (kg/m2) 17.2 ± 3.0 17.1 ± 3.1 0.964 * SBP (mmhg) 107 ± 7 109 ± 9 0.115 * DBP (mmhg) 63.0 ± 5,6 64.4 ± 6.3 0.652 * Heart rate (bpm) 93.3 ± 5.9 82.0 ± 6.3 0.271 * Atopy 9 (23.1%) 46 (68%) <0.001†BMI: body mass index, SBP: systolic blood pressure, DSP: diastolic blood pressure, bpm: heart rate per minute. * Independent t-test † Chi-square test
ventricular free wall, adjacent to the base of the ventricular aortic annulus with a one-third cross-section, were used as anatomic references for EATT measurement. Measurements were made at the end of systole, held in three cardiac cycles, and recorded by taking the average of all measurements.6
2.5. Statistical analyses
Mean, standard deviation, median, rate and frequency values are used as descriptive statistics. Normality of the variable distribution was checked using the Kolmogorov–Smirnov test. In the analyses of quantitative data, the independent samples t-test as well the Kruskal–Wallis and Mann–Whitney U tests were used. The chi-square test was employed for qualitative analyses of data. Spearman analyses were used for correlation studies. SPSS v22.0 (IBM, New York, NY, USA) was used for all analyses. Results
Age, sex, height, body weight and BMI were not significantly different between the two groups (p ˃ 0.05). The prevalence of atopic status in the patient group was higher than that in the control group (p < 0.05) (Table 1).
Asthma severity was categorized into four groups according to the GINA guidelines including mild intermittent, mild persistent, moderate persistent and severe persistent. Eight patients (11.8%) had intermittent asthma, 47 cases (69.1%) had mild, persistent asthma, 12 subjects (17.6%) had moderate, persistent asthma, and one individual (1.5%) had severe, persistent asthma.
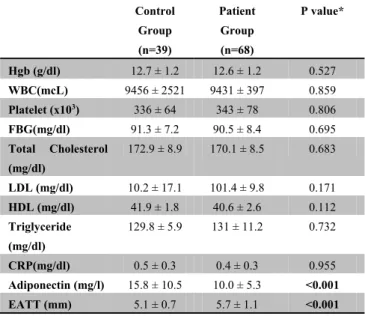
Table 2. Blood analyses in the study cohort
Control Group (n=39) Patient Group (n=68) P value* Hgb (g/dl) 12.7 ± 1.2 12.6 ± 1.2 0.527 WBC(mcL) 9456 ± 2521 9431 ± 397 0.859 Platelet (x103) 336 ± 64 343 ± 78 0.806 FBG(mg/dl) 91.3 ± 7.2 90.5 ± 8.4 0.695 Total Cholesterol (mg/dl) 172.9 ± 8.9 170.1 ± 8.5 0.683 LDL (mg/dl) 10.2 ± 17.1 101.4 ± 9.8 0.171 HDL (mg/dl) 41.9 ± 1.8 40.6 ± 2.6 0.112 Triglyceride (mg/dl) 129.8 ± 5.9 131 ± 11.2 0.732 CRP(mg/dl) 0.5 ± 0.3 0.4 ± 0.3 0.955 Adiponectin (mg/l) 15.8 ± 10.5 10.0 ± 5.3 <0.001 EATT (mm) 5.1 ± 0.7 5.7 ± 1.1 <0.001Hgb: hemoglobine, WBC: white blood cell count, PLT: platelets, FBG blood glucose levels: fasting blood glucose, LDL: low-density lipoprotein HDL: Ultra-high-density lipoprotein, CRP: C-reactive protein, EATT: epicardial adipose tissue thickness * Independent t-test
Heart rate, systolic blood pressure (SBP), diastolic blood pressure (DBP), white blood cell (WBC) count, platelet (PLT) count as well as levels of IgE, hemoglobin (Hb), TC, LDL, HDL, TG and CRP did not differ significantly between the two groups (p ˃ 0.05) (Table 2).
In the patient group, EATT was significantly higher than that in the control group (p < 0.05) whereas adiponectin levels in the patient group were significantly lower than those in the control group (p < 0.05).
Values of FEV1, FEV1/FVC, FVC and PEFR
were significantly lower in the patient group than in the control group (p < 0.05) (Table 3).
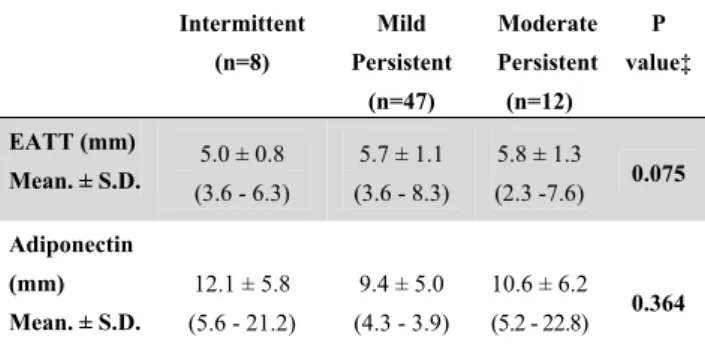
There was no significant difference between EATT and APN values according to illness severity (p > 0.05). Negative correlation was observed between adiponectin levels and EATT (p < 0.05) for all subjects combined. There was no significant correlation between adiponectin levels and FEV1,
FEV1/FVC and PEF values (p ˃ 0.05) (Table 5).
Discussion
This is the first study to evaluate the relationship between the EATT of non-obese asthmatic children with serum levels of adiponectin. EATT values were found to be significantly higher in the patient group than in the control group. In addition, serum levels
Table 3. Spirometry results
Control Group (n=39) Patient Group (n=68) P value* FEV-1 105 ± 13 94 ± 13 <0.001 FEV-1/FVC 99.6 ± 9.5 97.4 ± 29.5 <0.05 FVC 97.4 ± 9.0 92.6 ± 13.7 <0.05 PEFR 78.1 ± 17.8 71.2 ± 15.9 <0.05FEV 1: forced expiratory volume in 1 second, FVC: forced vital capacity, PEFR: peak expiratory flow rate * Independent t-test
of adiponectin were significantly lower in the patient group. There was a significant negative correlation between EATT and serum levels of adiponectin.
Adiponectin exhibits its anti-inflammatory effects by inhibiting expression of pro-inflammatory cytokines such as tumor necrosis factor (TNF)-α, interleukin (IL)-6 and nuclear factor-kappa B (NF-κB) and inducing expression of anti-inflammatory cytokines such as IL-10 and IL-1 receptor antagonists.4
A rat study demonstrated that increased circulating concentrations of adiponectin can decrease airway hyper-responsiveness and allergic airway inflammation.15
Data obtained from animal experiments have been supported by clinical studies. Low serum levels of adiponectin in women and peripubertal girls are associated with a greater risk of asthma.16,17 Also,
lower severity of asthma in women and children is associated with higher serum levels of total adiponectin.18 In a previous study that assessed boys
and pre-pubertal children with asthma, serum concentrations of adiponectin (after adjustment for the BMI) were associated with exercise-induced bronchoconstriction (less severe form).19 In an other
study assessing 14-year-old boys with moderate-to-severe asthma, serum concentrations of adiponectin were associated with fewer maximum number of days with asthma symptoms, fewer asthma exacerbations, and a higher value of FEV1/FVC.20
In a small case–control study, Holguin and colleagues showed no relationship between adiponectin concentrations in serum and inflammation markers in bronchoalveolar lavage fluid.21
In the present study, serum levels of adiponectin were significantly lower in asthmatic children compared with healthy patients. Due to the remarkably high number of subjects with mild asthma in our cohort we could postulate that serum levels of adiponectin were significantly lower in children with mild asthma. However, when we
Table 4. Adiponectin and EATT relationship with disease
severity
Intermittent (n=8) Mild Persistent (n=47) Moderate Persistent (n=12) P value‡ EATT (mm) 5.0 ± 0.8 (3.6 - 6.3) 5.7 ± 1.1 (3.6 - 8.3) 5.8 ± 1.3 (2.3 -7.6) 0.075 Mean. ± S.D. Adiponectin (mm) 12.1 ± 5.8 (5.6 - 21.2) 9.4 ± 5.0 (4.3 - 3.9) 10.6 ± 6.2 (5.2 - 22.8) 0.364 Mean. ± S.D.EATT: epicardial adipose tissue thickness, SD: standard deviation ‡ Spearman correlation
assessed serum levels of adiponectin according to disease severity, we did not find a significant difference. Furthermore, there was no significant correlation between serum levels of adiponectin and spirometric data (FEV1, FEV1/FVC, PEFR). A small
number of cases and differences in the numbers of patients according to disease severity could have been the reasons for these results. In this context, even children with mild asthma may not have reduced serum levels of adiponectin.
Obesity is a chronic inflammatory state associated with body compositional changes (visceral obesity) in relation to the modification of the immune microenvironment of the local tissues.22
The serum level of adiponectin is an important variable associated with the BMI. Though produced by adipose tissue, the systemic adiponectin concentration is inversely correlated with the BMI.22 Interestingly,
although visceral adipose tissue is the most important source of systemic adiponectin, systemic adiponectin concentrations are reduced in obese subjects.23,24
In children and adults, being overweight is a risk factor for developing asthma.3 Adipocytes have
been considered to be a result of obesity-related hypoxia-induced necrosis.25 Macrophages collect
around necrotic adipocytes to create syncytia. Syncytia act as paracrine agents to increase production of TNF-α and IL-6 to inhibit local production of adiponectin.26
We hypothesized that the relationship between asthma and adiponectin levels might be independent of obesity or might be associated with other reasons. Therefore, we recruited non-obese patients and
Table 5. Correlation Analysis
EATT (mm) FEV-1 FEV-1/FVC PEFR Adiponectin (ng/l) ‡ r -0.266 0.173 0.028 -0.139 p 0.006 0.074 0.771 0.153 EATT: epicardial adipose tissue thickness; FEV1: forced expiratoryvolume in one second; FVC: forced vital capacity; PEFR: peak expiratory flow rate ‡ Spearman correlation
healthy controls. We found serum levels of adiponectin in non-obese asthmatic children to be significantly lower than those in healthy individuals. In accordance with our results, Yuksel and colleagues showed that serum levels of adiponectin were significantly lower in non-obese asthmatic children compared with healthy controls.27 In the
same study, Yuksel et al. showed that serum levels of APN were significantly lower in obese asthmatic children compared with healthy controls and also non-obese asthmatic children.27
EAT is an cytokine source with endocrine and paracrine specifity.28 EATT shows correlation with
circulating levels of some adipokines. EATT is inversely correlated with plasma levels of adiponectin. Moreover, a higher risk of cardiovascular disease is associated with low levels of adiponectin in plasma.29 However, it is not clear if the amount of
fat accumulation (expressed as EATT) is related to EAT (adipokine source) activity.6 We found a
significant negative correlation between serum levels of adiponectin and EATT in non-obese asthmatic children. We can conclude that this negative correlation was caused by a feature other than obesity. We know that recent studies showed that EAT is highly correlated with obesity in children.30,31 We can state, however, that local
secretion of pro-inflammatory cytokines from EAT is more dominant in asthmatic children, and that this phenomenon is due to down-regulation of expression of anti-inflammatory cytokines.
Our study had limitations. Firstly, the study cohort was small and heterogeneous. Secondly, we did not make an assessment of pubertal development. Thirdly, the methodology we used to show the relationship between EATT and adiponectin levels may have been the most appropriate. Fourthly, we used echocardiography for the assessment EAT, which is not the “gold standard” for EATT evaluation.
Conclusion
The present study showed that EATT values were found to be significantly higher in non-obese asthmatic children that serum levels of adiponectin were significantly lower than those in healthy subjects. There was a negative correlation between serum levels of adiponectin and EATT. Increased EATT and reduced levels of adiponectin may be associated with the development of asthma in non-obese children.
To our knowledge, this is the first report showing there might be a relationship between EATT and serum APN levels in children with asthma.
Acknowledgments
A. Author Contributions:design and conduct of the study (C.O., F.E., M.D.); collection, management, analysis, and interpretation of the data (F.E., O.K., S.O.); and preparation, review, or approval of the manuscript (C.O., S.O., I.O.I.). Each of the coauthors (S.O., O.K., F.E., I.O.I.) has seen and agrees with this submitted manuscript and to the way his or her name is listed.
B. Other Acknowledgments: Special thanks to Mustafa Eliacik, MD for his help rewriting and revising our manuscript.
Conflict of interest
Authors have no conflict of interest to declare. References
1. Global Strategy for Asthma Management and Prevention, Global Initiative for Asthma (GINA) (2006) Available at: http://www. ginasthma.org/. Accessed 10 Jan 2012
2. Bel EH. Clinical Practice. Mild asthma. N Engl J Med. 2013;369:549-57.
3. Beuther DA, Sutherland ER. Overweight, obesity, and incident asthma: a meta-analysis of prospective epidemiologic studies. Am J Respir Crit Care Med 2007;175:661-6.
4. Ali Assad N, Sood A. Leptin, adiponectin and pulmonary diseases. Biochimie. 2012;94:2180-9.
5. Rabkin SW. Epicardial fat: properties, function and relationship to obesity. Obes Rev. 2007;8:253-61.
6. Iacobellis G, Willens HJ. Echocardiographic epicardial fat: a review of research and clinical applications. J Am Soc Echocardiogr. 2009;22:1311-9.
7. Iacobellis G, Pistilli D, Gucciardo M, Leonetti F, Miraldi F, Brancaccio G, et al. Adiponectin expression in human epicardial adipose tissue in vivo is lower in patients with coronary artery disease. Cytokine. 2005;29:251-5.
8. Iacobellis G, di Gioia CR, Cotesta D, Petramala L, Travaglini C, De Santis V, et al. Epicardial adipose tissue adiponectin expression is related to intracoronary adiponectin levels. Horm Metab Res. 2009;41:227-31.
9. Sacks HS, Fain JN. Human epicardial adipose tissue: a review. Am Heart J. 2007;153:907-17.
10. Iacobellis G. Imaging of visceral adipose tissue: an emerging diagnostic tool and therapeutic target. Curr Drug Targets Cardiovasc Haematol Disord. 2005;5:345-53.
11. Barlow SE, Dietz WH. Obesity evaluation and treatment: Expert Committee recommendations. The Maternal and Child Health Bureau, Health Resources and Services Administration and the Department of Health and Human Services. Pediatrics. 1998;102:E29
12. Kuczmarski RJ, Ogden CL, Guo SS, Grummer-Strawn LM, Flegal KM, Mei Z, et al. 2000 CDC Growth Charts for the United States: methods and development. Vital Health Stat 2002;36:1-190. 13. American Thoracic Society, “Guidelines for assessing and
managing asthma risk at work, school, and recreation,” American Journal of Respiratory and Critical Care Medicine. 2004; 169:837– 81
14. Quanjer PH1, Stanojevic S, Cole TJ, Baur X, Hall GL, Culver BH, et al. Multi-ethnic reference values for spirometry for the 3–95-yr age range: the global lung function equations. European Respiratory Journal. 2012;40:133–43.
15. Shore SA, Terry RD, Flynt L, Xu A, Hug C. Adiponectin attenuates allergen-induced airway inflammation and hyperresponsiveness in mice. J Allergy Clin Immunol.2006;118:389–95.
16 Sood A, Cui X, Qualls C, Beckett WS, Gross MD, Steffes MW et al. Association between asthma and serum adiponectin concentration in women. Thorax 2008;63:877–82.
17. Nagel G, Koenig W, Rapp K, Wabitsch M, Zoellner I, Weiland SK. Associations of adipokines with asthma, rhinoconjunctivitis, and eczema in German schoolchildren. Pediatr Allergy Immunol. 2009;20:81–8.
18. Sood A, Shore SA. Adiponectin, Leptin, and Resistin in Asthma: Basic Mechanisms through Population Studies. J Allergy (Cairo). 2013;2013:785-835.
19 Baek HS, Kim YD, Shin JH, Kim JH, Oh JW, Lee HB. Serum leptin and adiponectin levels correlate with exercise-induced bronchoconstriction in children with asthma. Ann Allergy Asthma Immunol. 2011;107:14–21.
20. Kattan M, Kumar R, Bloomberg GR, Mitchell HE, Calatroni A, Gergen PJ et al. Asthma control, adiposity, and adipokines among inner-city adolescents. J Allergy Clin Immunol. 2010;125:584–92. 21. Holguin F, Rojas M, Brown LA, Fitzpatrick AM. Airway and
plasma leptin and adiponectin in lean and obese asthmatics and controls. J Asthma. 2011;48:217–23.
22. Wanlapakorn N, Sritippayawan S, Deerojanawong J. Prevalence of asthma, level of control and factors associated with asthma control in Thai elementary school students in Bangkok. Asian Pac J Allergy Immunol. 2014;32:287-92.
23. Steffes MW, Gross MD, Schreiner PJ, Yu X, Hilner JE, Gingerich R et al. Serum adiponectin in young adults--interactions with central adiposity, circulating levels of glucose, and insulin resistance: the CARDIA study. Ann Epidemiol. 2004;14:492–8. 24. Arita Y, Kihara S, Ouchi N, Takahashi M, Maeda K, Miyagawa J et
al. Paradoxical decrease of an adipose specific protein, adiponectin, in obesity. Biochem Biophys Res Commun. 1999;257:79–83. 25. Cinti S, Mitchell G, Barbatelli G, Murano I, Ceresi E, Faloia E, et
al. Adipocyte death defines macrophage localization and function in adipose tissue of obese mice and humans. J Lipid Res. 2005; 46:2347–55.
26. Bruun JM, Lihn AS, Verdich C, Pedersen SB, Toubro S, Astrup A, et al. Regulation of adiponectin by adipose tissue-derived cytokines: in vivo and in vitro investigations in humans. Am J Physiol Endocrinol Metab. 2003;285:527-3.
27. Yuksel H, Sogut A, Yilmaz O, Onur E, Dinc G. Role of adipokines and hormones of obesity in childhood asthma. Allergy Asthma Immunol Res. 2012;4:98-103
28. Iacobellis G, Corradi D, Sharma AM. Epicardial adipose tissue: anatomic, biomolecular and clinical relationships with the heart. Nat Clin Pract Cardiovasc Med. 2005;2:536-43.
29. Iacobellis G, Ribaudo MC, Assael F, Vecci E, Tiberti C, Zappaterreno A, et al. Echocardiographic epicardial adipose tissue is related to anthropometric and clinical parameters of metabolic syndrome: a new indicator of cardiovascular risk. J Clin Endocrinol Metab. 2003;88:5163-8.
30. Manco M, Morandi A, Marigliano M, Rigotti F, Manfredi R, Maffeis C. Epicardial fat, abdominal adiposity and insulin resistance in obese pre-pubertal and early pubertal children. Atherosclerosis. 2013;226:490-5.
31. AbaciA, TascilarME, Saritas T, et al. Threshold value of subepicardial adipose tissue to detect insulin resistance in obese children. Int J Obes (Lond) 2009;33:440-6.