ISTANBUL MEDIPOL UNIVERSITY GRADUATE SCHOOL OF HEALTH SCIENCES
THESIS OF MASTER’S DEGREE
ASSESSEMENT OF BALANCE IN GERIATRIC HYPERTENSIVE
INDIVIDUALS
FARZIN HAJEBRAHIMI, PT
DEPARTMENT OF PHYSICAL THERAPY AND REHABILITATION
SUPERVISOR
Prof. Z. CANDAN ALGUN, PT, PhD
SECOND SUPERVISOR Assoc. Prof. HANEFI ÖZBEK, MD
ii
Declaration
I hereby declare that this thesis is my own study, in all steps of the thesis from planning to writing, I have not done anything out of the ethical behaviors, I have obtained all of the information of this thesis inside the academic and ethical principles, I have shown references to all of the information and comments that were reached other out of this thesis study and have shown these references at the section of references, also I have not done any behavior infringing patent and copyright during the performing and writing of this theses.
iii Acknowledgements
Special thanks to:
Prof. Z. Candan Algun, PT, PhD, for all her kindness, generosity and dignity and for the endless grace of her helping hands; not only in the academic career, but also for showing vision in every higher step of my life,
Assoc. Prof. Hanefi Özbek, MD, because of devoting his precious time to me,
Assist. Prof. Devrim Tarakci, PT, PhD, for being a real elder brother to me, for his real and pure trueness, for helping me in every problem and sharing his everything and every place in order to take my hand,
Assoc. Prof. Ela Tarakci, PT, PhD, for sharing her scientific knowledge without any expectation,
All of my dear professors, colleagues and lovely friends in the department of Physical Therapy and Rehabilitation at Istanbul Medipol University,
My love, for being my love,
And to my dearest family, because of all the good things I have which I wouldn’t have, if they were not. They were always, they are always, and they will be forever…
iv
Abbreviations and Symbols
ABC: Activities-Specific Balance Confidence Scale TUG: Timed Up and Go
BESTest: Balance Evaluation Systems Test PPA: Physiological Profile Approach GDS: Geriatric Depression Scale ADL: Activities of Daily Living BADL: Basic activities of daily living MMSE: Mini-Mental State Examination BMI: Body Mass Index
SBP: Systolic Blood Pressure DBP: Diastolic Blood Pressure CoP: Center Of Pressure
SPSS: Software Package Used For Statistical Analysis HT: Hypertension
SLB: Single Leg Balance WFA: Wii Fit Age
v
List of Tables
Table 6.1 Distribution of the demographic data
Table 6.2 Distribution of males and females inside hypertensive and normotensive groups
Table 6.3 Distribution of marital statute inside hypertensive and normotensive groups
Table 6.4 Distribution of living conditions of the participants inside hypertensive and normotensive groups
Table 6.5 Distribution of the hypertensive and normotensive participants according to their living condition.
Table 6.6 Distribution of smoking and alcohol addiction of the participants inside hypertensive a normotensive groups
Table 6.7 Distribution of Educational level of the participants inside hypertensive and normotensive groups
Table 6.8 History of Falling and balance disorder in participants inside hypertensive and normotensive groups
Table 6.9 Instantaneous hypertension among hypertensive and normotensive groups.
Table 6.10 Right and left Quadriceps muscle strength values, ranges of ankle dorsiflexion with statistical distribution and comparison with t-Test.
Table 6.11 statistical relationship between age, height, weight and BMI with blood pressure
Table 6.12 shows the statistical comparison of scores of KATZ BADL, SMMT, and GDS in both the hypertensive and normotensive groups.
Table 6.13 Relationship between TUG and Hypertension
Table 6.14 Relationship between hypertension and balance parameters of Pedalo Device.
vi Table 6.15. Relationship between hypertension and balance parameters of Nintendo Wii Balance board
Table 6.16 Relationship between falling history and balance performance compared in hypertensive and normotensive group
Table 6.17 Relationship between Instantaneous Hypertension and Balance performance
vii
List of Figures and Photos
Photo 5.1. Nintento Wii
Photo 5.2. Pedalo® Sensamove balance device
Photo 5.3. Balance testing with Pedalo® Sensamove balance device
Figure 5.1. The number of included patients and process of grouping the patients
Figure 5.2. The sample results of the three measurements of Pedalo® Sensamove balance device
Figure 6.1. Living conditions of the participants Figure 6.2. Educational level in participants Figure 6.3. `Falling history of the participants Figure 6.4. Balance disorders of the participants
Figure 6.5. Distribution of the instantaneous hypertension
viii
CONTENTS
Thesis Approval Frorm……….i
Declaration………..……… ii
Acknowledgements ………... iii
Abbreviations and Symbols ………...… iv
List of Tables ……..………...……….…….. ..v
List of Figures and Photos ………...…………..……vii
1. Abstract ……..………...………….……….………1
2. Özet ………...…....……….………..2
3. Introduction and Purpose ………..……….. 3
4. General Information.……….……….……..…………..5
4.1. Aging………...………….. 5
4.2. Falls ………...………5
4.2.1. Background and epidemiology for falls-Incidence of falls ………...….5
4.2.2. Causes and risk factors for falls...………..……….7
4.3. Postural Balance………....9
4.5. Hypertension………..………..13
5. Materials and Methods………..…………..15
5.1. Materials……….……….15
5.2. Methods………..……..17
5.2.1. Applied Assessments and Evaluations………….………18
5.2.1.1. Geriatric Assessment ………18
5.2.1.2. KATZ Basic Activities of Daily Living ………19
5.2.1.3. Muscle Strength ………19
5.2.1.4. Range of Motion ………...19
5.2.1.5. Cognitive Assessment……….……….. 20
ix
5.2.1.7. Measurement of the Blood Pressure………...20
5.2.1.8. Nintendo Wii………...21
5.2.1.9. Pedalo® Sensamove Balance Device………..………..24
5.3. Statistical Analysis………..… 28
6. Results………...……….29
6.1. Demographic Features ………29
6.3. Results related to Balance………38
7. Discussion………...………...….………...44
8. Conclusion and Recommendations……….65
9. References……...………..………..……...67
10. Appendix………...…………74
11. Approval of Ethical Committee………...82
1
1. ABSTRACT
THE EVALUATION OF THE BALANCE IN GERIATRIC
HYPERTENSIVE INDIVIDUALS
Our study is designed to evaluate the relationship between the balance performance of the geriatric hypertensive and normotensive individuals and find out the effect of hypertension in the balance behavior of the elderly people. 61 geriatric people were included in our study. All the patients were 65 years old and older and were participating to our study with their own approval. Demographic information of the participants has been recorded. Basic activities of daily living is measured by the KATZ Index of ADLs, cognitive status is measured by Standardized Mini-Mental State Examination, depression status is measured by Geriatric Depression scale, Quadriceps muscle strength is measured by hand held dynamometer, ankle dorsiflexion range of motion is measured by goniometer, gait is measured by Timed Up and Go Test and balance performance is measured by Nintendo Wii and Pedalo® Sensamove balance device. The systolic and diastolic blood pressure is measured before the balance test. Hypertensive group had higher performance time in Timed Up and Go test than normotensive. (p=0.030). There was no statistically significant difference in parameters of Pedalo® Sensamove device between hypertensive and normotensive participants (p>0.05). Parameters of “Completed seconds in Wii Single Leg Balance Test”, “Performance score in Wii Single Leg Balance Test” and “Wii fit age” between both hypertensive and normotensive were determined significant in the statistical analysis (p<0.05). Hypertension seems to affect different parameters of balance among elderly people. For controlling their balance, elderly people should consider their high blood pressure beside their falling history.
2
2. ÖZET
HİPERTANSİF GERİATRİK BİREYLERDE DENGE
DEĞERLENDİRMESI
Çalışmamız hipertansif ve normotansif geriatric bireylerde denge performansınının ilişkisini ve hipertensiyonun yaşlı bireylerin dengeleri üzerinde etkisini araştırmak için planlanmıştır. Çalışmamıza 61 geriatrik birey dahil edilmiştir. Çalışmaya katılanların hepsi 65 yaş üstü olup gönüllü olarak araştırmayı kabul etmişlerdir. Katılanların demografik bilgileri kaydedilmiştir. Temel günlük yaşam aktivitelerini ölçmek için “Katz indeksi”, Kognitif durumu ölçmek için “Statdardize Mini Mental Testi (SMMT)”, Depresyon durumunu ölçmek için “Geriatrik Depresyon Skalası”, Quadriceps kas gücünü ölçmek için hand held dinamometre, ayak bileği eklem hareketi açıklığını ölçmek için goniometre, yürümeyi değerlendirmek için “Zamanlı Kalk ve Yürü Testi (ZKYT)”, ve dengeyi ölçmek için Nintendo Wii ve Pedalo® Sensamove denge cihazı kullanılmıştır. Denge testinden önce bireylerin sistolik ve diastolik kan basınçları ölçulmüştür. Hipertansif grubun ZKYT test sonuçları normotansif gruba göre daha kötü bulunmuştur(p=0.030). Pedalo denge değerleri ve hipertasiyon arasında herhangi bir anlamlı fark saptanmamıştır (p>0.05). Nintendo Wii cihazında, "Wii single leg balance seconds", "Wii single leg balance performance" ve "Wii fit Age" parametrelerinde hipertansif ve normotansif grupları arasında anlamlı fark saptanmıştır(p<0.05). Hipertansif bireyler Wii denge parametrelerine göre daha kötü performans göstermişlerdir. Hipertansiyonun yaşlı bireylerde dengenin farklı parametrelerini etkilediği belirlenmiştir. Dengeyi sağlamak için, yaşlı bireylerin daha önce düşme yaşamalarının yanısıra yüksek tansiyonlarına da dikkat etmeleri gerekmektedir.
3
3. INTRODUCTION AND PURPOSE
According to annual report of the World Health Organization on 2015, cardiovascular diseases can be named as the first cause of the deaths worldwide. It is important because many people die each year because of cardiovascular diseases and the amount of these deaths are more than any other deaths.
Nearly 17.5 million people died from cardiovascular diseases in 2012, which were the 31% of all deaths. Of these deaths, an estimated of 7.4 million were due to coronary heart disease and 6.7 million were due to stroke.
Importantly, among all the annual cardiovascular deaths, hypertension account for 9.4 million deaths worldwide every year. Hypertension is responsible for at least 45% of deaths due to heart disease and 51% of deaths due to stroke.
Normal aging is associated with decreased ability to maintain postural stability in standing position. Therefore the inability to control the postural balance leads to disturbed balance conditions in the older people and consequently causes fallings among older population.
Falling is one of the most important problems of elderly people. The incidence of falling is reported to be high among elderly people and the fear of falling is very common in elderly population. About one third of people aged 65 years and older report at least one fall each year.
Fallings lead to several fractures especially in hip, pelvic, humerus and forearm in the elderly people. Unfortunately the treatment of fracture is more difficult and time consuming in elderly people related to the young generation. Most of the times, because of the osteoporotic feature of the bones in these people, the fracture type is more complicated and the healing period becomes long and difficult.
The other important effect of falling is that the fear of falling is generated among the elderly people after the first falling and this matter results in their not going out of the house or even a sedentary lifestyle inside their home.
4 While imbalance, vertigo and dizziness are reported to be more common among elderly people, the balance performance of the elderly people should be investigated precisely.
The incidence of hypertension also increases with aging. Older people have usually higher blood pressure than young people and blood pressure is reported to increases with age.
Considering the higher incidence of hypertension and impaired balance in elderly people, this hypothesis has been generated that whether there is any relationship between hypertension factor and balance disorder among elderly people.
Several studies have been done to investigate the balance disorders of the hypertensive people, but the results are conflicting. Determination of the relationship between hypertension and postural balance in elderly adults can help to prevent the fall risks of this population and also improve their static and dynamic balance performance.
The aim of this thesis was to investigate the relationship between hypertension and postural balance among geriatric adults.
5
4. GENERAL INFORMATION
4.1. Aging
As a report of World Health Organization, people nowadays can expect to live into their 60s and even older than 60.
People older than 65 are accepted as the “elderly” or older persons. There is of course no general agreement of the specific age from which an individual becomes old. It is therefore generally accepted that the biological age and the calendar age of the individuals are not usually the same number, Bongaarts (1).
4.2. Falls
4.2.1. Background and epidemiology for falls-Incidence of falls
Falls occur very commonly among older people, even among those with good health and living independently in their homes and having no apparent balance problems. Falls and unstable balance are very common among older people that lead to serious clinical and health problems in this population.
The importance of falling in older people is more that which is obvious. Among those deaths which are not on purpose or arranged deaths, falls are listed in the fifth order. The other leading factors of deaths before falls are cardiovascular diseases, cancer, stroke, and pulmonary diseases. Importantly, falls constitute one third of these deaths.
In the United States, three of four deaths related to falls occur mostly in people age ≥65. More than one third of the people age ≥65 (About 40%) experience at least one fall each year. 1 in 40 of these people experiencing fall will be hospitalized because of that fall. Also repeated falls are actually common after the first fall and hospitalization.
The key facts of World Health Organization (WHO) related to falls which show the importance and seriousity of the falling in elderly people are as following:
6
Falls are the second leading cause of accidental or unintentional injury deaths worldwide.
Each year an estimated 424 000 individuals die from falls globally of which over 80% are in low- and middle-income countries.
Adults older than 65 suffer the greatest number of fatal falls.
37.3 million Falls that are severe enough to require medical attention, occur each year.
Prevention strategies should emphasize education, training, creating safer environments, prioritizing fall-related research and establishing effective policies to reduce risk, WHO (2).
The higher incidence of the falls in elderly people is not the only important matter needing consideration. As the younger people have more mobility and include in different sportive activities, they may actually experience more falls than elder people. The importance of falls among the elder people is that they are more susceptible to injuries because of some age-related complications such as osteoporosis. Therefore a very normal and mild falling sometimes results in dangerous circumstances. Aged people also have a longer recovery period and the inactivity in this period affects the healing process negatively which can result in further falls. This is also called post-fall anxiety syndrome in which patients have some exaggerated caution to control their activities in a way not to fall again that again results in their deconditioning and increased inactivity, Rubenstein et al (3). Studies have shown that 30%-73% of people who have experienced a fall before are fearing from falling again, King et al (4), Tinett et al (5), Vellas et al (6).
Adding to this, those elderly people who have several falls, are forced by the situation to lo-term hospitalization and then spend their remaining life time at nursing homes, Sattin et al (7).
Studies have shown that in those community-dwelling individuals who have had a fall-related hip fractures, 25% to 75% do not recover to their pre-fall situation and activities of daily living, Magaziner et al (8).
7 4.2.2. Causes and risk factors for falls
Several causes are listed related to falls in elderly people. The summary of the important causes of falls in elderly people is listed as follow:
Accident’/environment-related
Gait/balance disorders or weakness
Dizziness/vertigo Drop attack Confusion Postural hypotension Visual disorder Syncope
Other specified causes (arthritis, acute illness, drugs, alcohol, pain, epilepsy and falling from bed)
Unknown causes
It is obvious that that the amount of vision and hearing and also other sensory inputs decreases as people get older and this also contribute to their insufficiency in controlling their balance in the case of instability. The strategies of controlling balance also changes in the aged people. In the elder people the hip strategy in which we shift our weights in the case of instability gives its place to the stepping strategy in which stepping takes place when there is an instable condition.
Proprioception has been shown to be diminished with age. Impaired proprioception makes it difficult for older people to detect the changes in body position. Proprioception may greatly influence postural stability, and a decline in proprioception with aging could be associated with an increased tendency to fall in the elderly people.
Postural balance includes such differing physiological aspects as sensory functions, motor coordination, high-level adaptive mechanism and musculoskeletal constrains.
The lower limbs are particularly important for maintaining postural stability. Visual system also plays a major role in postural control in elderly people.
8 There are changes in joints, muscles, connective tissue, and sensory input as people get older. These factors affect on walking and gait and therefore have great impact on balance. Control of balance is more difficult in the changing of these factors. Other than age-related factors, changes in nervous, cardiovascular and respiratory systems related consequent to inactivity of the elder people can also affect the gait and balance performance of the elderly people.
Balance is the most important component to maintain functional independency. It is defined as maintaining posture in an upright position and ability to move voluntarily.
Older people also experience dizziness very much. Dizziness is a non-specific problem and can be related to cardiovascular disorders, hyperventilation, orthostatic situation, drug side-effect, anxiety or depression. Usually as the blood pressure drops 20 mmHg of systolic blood pressure when the patient stands from the lying position, he/she feels dizziness and this is called orthostatic hypotension. Orthostatic hypotension can occur in 10-30% of normal elderly people which live at home but it affects falls less than this prevalence.
Some people also experience drop attacks without feeling any dizziness. In this situation they feel a sudden leg weakness and therefore they fall.
Patients also experience syncope after a decreased cerebral blood flow or metabolic factors. Syncope can cause 2 to 20% of the falls. The important thing about syncope is that those who fall with the syncope are hospitalized and been started the treatment immediately.
In order to identify the risk factors for falls some of the main risk factors of falling is listed as follow: Weakness Balance deficit Gait deficit Visual deficit Mobility limitation Cognitive impairment
9
Impaired functional status
Postural hypotension
Gait and balance deficit and weakness are the leading risk factors in this list. The changes in gait which occurs with aging, are known to be an important factor related to falls in the elderly people. The muscle weakness is mostly related to diseases and inactivity in elderly people rather than aging. Also those with gait and muscle dysfunction have a higher risk of falling and fractures, Rubenstein et al (3), Prevention et al (9), Robbins et al (10), Rubenstein et al (11), Rubenstein et al (12), Leipzig et al (13).
Fall-related mortality
Fall-related mortality increases dramatically as people get older, especially after age 70, (Hogue (14).
4.3. Postural Balance
Structural and functional declines of the somatosensory systems occur with increase in age and these changes are associated by postural stability.
Different impairments in sensory, motor and central system can lead to instability in older people. Impairments can consist of different pathologies that affect these systems or even the normal decline in functions related to aging.
Vision has a very great role in controlling balance, because by the inputs coming from the eyes we can imagine our special environment and this makes to control our balance. By different physiologic pathological changes and in eyes and visual mechanisms, as the individuals get older the vision becomes worse. This happens especially after the age 50, Gittings et al (15).
This is also emphasized by misinterpretation and misjudgment of the special map and the distances which altogether makes the balance worse, Lord et al (16).
Vestibular system which helps the balance by vestibule-ocular and vestibule-spinal pathways and correcting mechanisms related to this, also is affected as people get
10 older. Studies show that the function of the vestibular system decreases with the normal path of aging, Fife et al (17).
Although those being aware of their poor vestibular function have generated some compensatory reactions and precautions to control their balance but studies show that impaired vestibular function also leads to increase in the falls in the elderly people, Fabio (18), Kristinsdottir et al (19).
As people get older the body mass especially muscle mass becomes smaller gradually, Lexell, et al (20).
Muscle strength decreases also after the age 50 and the speed of this decrease continues a steep degree up to the age 80, Larsson et al (21).
This diminish in the muscle strength can cause impaired balance disorder in the elderly people. The strength of the muscles and speed of the muscle contraction are the affecting factors in the impairing postural balance. As the atrophy of the fast-twitch fibers is seen by aging, the speed of the reaction and muscle contraction in the case of any instability should be taken into consideration, Sturnieks et al (22).
Normal process of aging leads to decrease in postural stability during standing and those situations of any instability. The postural sway is defined as small deviations in the center of body mass. The postural sways can be therefore measured in order to assess the postural balance. In those young adults if we manipulate one of the visual, vestibular and proprioceptive systems, the compensation in the other systems result in the minimal changes of the center of mass. In the older people this manipulation results in greater changes of the postural sways (center of mass) and this shows that the compensation is not enough in their postural balance mechanism, Lord et al (23).
Studies have also shown that the amount of postural balance increases after the age
11 4.4. Balance Evaluation
The purpose of evaluation balance is first to determine if there is any balance disorder in the corresponding patient and second to find out the underlying reason of balance disorder.
The balance tools used in evaluation and assessment should have some features such as reliability, validity and be practical and easy to use.
Clinical balance assessments are divided into three methods:
Functional Assessments
Systems/Physiological Assessments
Quantitative Assessments
Functional balance tests can measure balance performance by calculating some motor tasks. These tests whether contain some scales consisting of different tasks or consist of the time needed to complete a posture needing balance, Horak et al (25).
Here are some specialized clinical tests which are commonly in use:
Activities-Specific Balance Confidence Scale (ABC)
Berg Functional Balance Scale
Tinetti Balance and Gait Assessment
Timed Up and Go (TUG)
One-leg stance
Functional reach
Balance Evaluation Systems Test (BESTest)
Physiological Profile Approach (PPA)
In order to find out the underlying reason of the balance disorder, a systematic approach is useful, Horak et al (25).
The following tests use the systematic approach in order to assess balance:
The Balance Evaluation Systems Test, Horak et al (26)
12 Objective and quantitative assessment tools in evaluating balance are as following:
Posturography (which consists of Static and Dynamic Posturography)
Wearable Inertial Sensors
Static posturography is designed to assess the postural sway while the patients stand still. This occurs by quantifying the changes in center of pressure of foot on a force plate.
Dynamic posturography uses external perturbations in balance or it uses changing surfaces or changing visual conditions. This makes them present some helpful information about forward and backward body sways and therefore make to find the underlying reason of the balance disorder. The disadvantages of these systems are their being expensive and time-consuming meanwhile their being very spacious. Also dynamic posturography does not provide any information about the balance disorders during walking, sitting to standing etc.
There are also some novel assessment systems that wireless wearable motion sensors are used to evaluate balance. These systems compensate the disadvantages of other computerized tools and can be used during different tasks such as walking, Bonato (28), Chiari et al (29), Mancini et al (30).
A portable, inexpensive balance assessment system that has widespread availability is always needed at the clinic.
The Wii Balance board has been shown to be a valid and reliable method to quantify the Center of Pressure displacement during balance tests in older adults. Also studies suggest that the Wii Balance Board is a valid tool for assessing standing balance. Given that the Wii Balance Board is portable, widely available and it can provide the clinicians with a standing balance assessment tool suitable for the clinical setting.
13 The Pedalo®-Sensamove Balance Test is also a useful assessment tool for evaluating standing balance. This device is easy to handle, records an immediate data evaluation about a performance reproduction in %, as well as a comprehensive data documentation of all test measurements in the XY axes for each patient. The detailed documentation of single and longtime statistics offers the visualization of the test results.
4.5. Hypertension
Hypertension which is known as high blood pressure is a worldwide health problem. Hypertension is the important factor in heart disease, stroke and can lead to mortality and disability.
Hypertension leads to 45% of deaths because of heart disease and 51% of deaths because of stroke, WHO (31).
In 2008 near 40% of people aging over 25 had been diagnosed with hypertension. However countries with high income have a lower prevalence of hypertension,
Alwan (32).
The risk factors of hypertension are as following:
Tobacco Use
Obesity
High Cholesterol
Diabetes Mellitus
Hypertension can also lead to myocardial infarction, stroke, renal failure, and death in the case of not being detected early and treated in an appropriate manner.
The prevalence of hypertension increases by aging. Also the danger of cardiovascular and cerebrovascular diseases increases in those elderly people having hypertension
Blood pressure is measured in millimeters of mercury (mm Hg). The result is recorded as two numbers one representing systolic blood pressure and the other
14 diastolic blood pressure. Systolic blood pressure is the peak amount of the blood pressure which occurs when the heart contracts and diastolic blood pressure is the lowest blood pressure which occurs when the heart relaxes. This usually happens between the two heart beats. The normal values of blood pressure for adults are 120 mm Hg for systolic blood pressure and 80 mm Hg for diastolic blood pressure. Hypertension is defined when the systolic blood pressure is above 140 mm Hg and/or diastolic blood pressure above 90 mm Hg.
15
5. MATERIALS AND METHODS
5.1. Materials
This thesis was performed in Darülaceze Geriatric Center and Istanbul Medipol University.
Sixty one patients were included in this study. The aim of the study and all the assessments were full explained to the volunteer patients before beginning the evaluations. The assessments were done between August and December 2015.
This Thesis study got an approval decision of the ethical committee for noninvasive clinical studies of Istanbul Medipol University with the number 108400987-297 on 2015.06.02
The cases of this study were all informed about the purpose, duration, required assessments and scales of the study. The Informed Consent Form appropriate to the standards of the ethical committee of the clinical studies of Istanbul Medipol University were read and signed by all the patients.
Selection of the Cases Inclusion Criteria 1) Age ≥ 65 years
2) Ability to perform self-care activities of daily living without difficulties or need for help and able to walk independently for at least 400 m without assistive device
Exclusion Criteria
1) Impaired cognitive status (<24 on Mini-Mental State Test score)
2) Neurological disorders (stroke with disabling outcomes, Parkinson’s disease, multiple sclerosis)
3) Psychiatric disorders (depression or anxiety) requiring drug treatment; History of cardiovascular disease (including angina, myocardial infarction, congestive heart failure, but not controlled hypertension)
16 5) Kidney or liver diseases
6) Important sensory deficits (any condition that precluded subjects from being tested with
7) performance oriented disability scales or neuropsychological tests); Vestibular diseases
8) Previous lower limb surgery 9) Acute diseases
10) Diabetes requiring insulin or hypoglycemic drugs (subjects with impaired glucose tolerance, defined as serum fasting glucose values 110 mg/dl or higher but less than 140 mg/dl were included).
Presence of prior hypertension diagnosis was based on self-report of hypertension (answering “yes” to the question: “Has the doctor ever told you that you have hypertension?”) or antihypertensive medication intake.
17 5.2. Methods
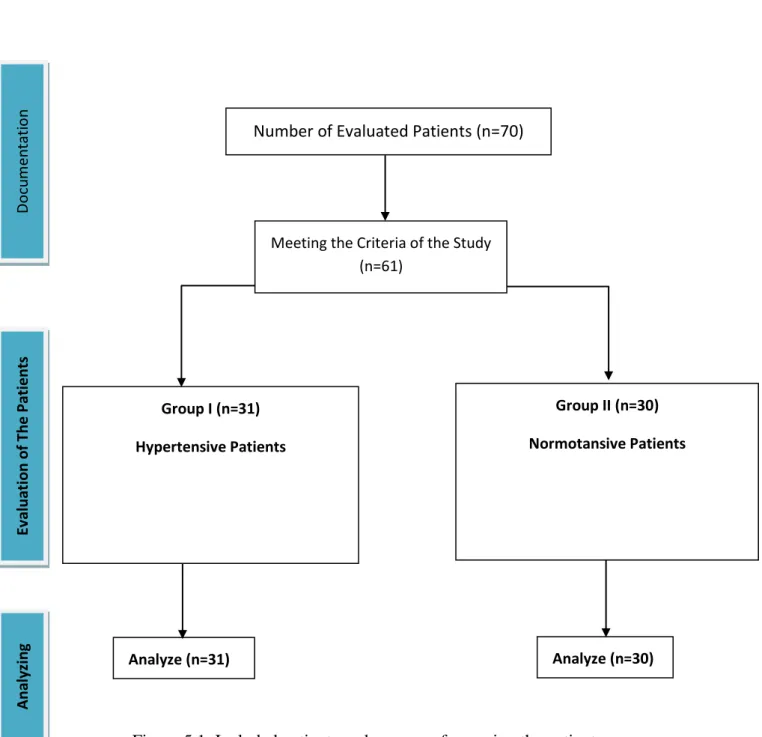
The number of included patients and process of grouping the patients is shown in Figure 5. 1.
Figure 5.1. Included patients and process of grouping the patients Number of Evaluated Patients (n=70)
Group I (n=31) Hypertensive Patients
Group II (n=30) Normotansive Patients
Analyze (n=30)
Meeting the Criteria of the Study (n=61) Analyze (n=31) D o cu m en tat io n Ev al u ati o n o f Th e Patien ts Ana ly zi n g
18 5.2.1. Applied Assessments and Evaluations
5.2.1.1 Patient Evaluation Form
In order to understand the personal information and history of the patients “patient evaluation form” was used. Patient evaluation form included the following items:
Name-Surname date of born Age Gender Marital status Height Weight
Body Mass Index
Educational status
Living condition
Smoking and alcohol addictions
Mobility status
History of falling
History of balance disorder 5.2.1.1. Geriatric Assessment
Geriatric global assessment was performed with a detailed medical history, reviewing all the medications. The long form of the Geriatric Depression Scale (GDS) was used to assess the depression status of the patients.
The participants' depressive symptoms were evaluated using the Turkish version of the GDS, Ertan et al (33), Lesher (34). GDS is a 30-item questionnaire which is specifically developed for elderly individuals. Researchers have found this instrument to be reliable and valid in multiple settings and have recommended it for use in nursing home populations, Ertan et al (35). Ertan et al. tested the validity and reliability of GDS scoring in the Turkish population and found it to be valid and
19 reliable, Orhan et al (36). A score ≥14 was accepted to be depressive in our study,
Arik et al (37).
The purpose of using the Geriatric Depression Scale was to exclude those patients having depression. If a patient had depression he/she was excluded from the study.
5.2.1.2. KATZ Basic Activities of Daily Living
Basic activities of daily living (BADL) were evaluated according to (Katz et al., 1963), Koç (38). This index was developed by Katz in 1979. Clinicians typically use this tool to detect problems in performing Activities of Daily Living (ADL). ADL include self-care behaviors (e.g. eating, dressing and undressing, bathing, personal care, transferring from bed to chair and back, using the toilet, voluntarily controlling urinary and faucal discharge, walking, climbing up/down stairs) that should be performed every day. The scale consists of performance of six functions: bathing, dressing, toileting, transferring, continence, and feeding. Clients indicated their being independent or dependent in each of the six functions, Martin et al (39).
5.2.1.3. Muscle Strength
Isometric muscle strength was assessed at both Quadriceps muscles with Hand-Held Dynamometry. In order to measure isometric Quadriceps Femoris strength using hand-held Dynamometer all patients were lying supine. The test was performed with applying force to the lower extremity of the patients.
The Manual Muscle Tester is a Microprocessor controlled device which records the peak force performed by the patient. All of the measurements were performed by the researcher.
The supine technique is both easier for the participants to perform and also easier for the physiotherapist to stabilize and maintain the testing position, Folstein et al (40).
5.2.1.4. Range of Motion
Range of motion related to ankle joint was assessed by all patients lying in supine position and measuring their range of active dorsiflexion by using a manual goniometer.
20 5.2.1.5. Cognitive Assessment
The Mini-Mental State Examination (MMSE) was administered as a measure of overall cognitive performance. The Turkish version of the
MMSE, which was previously proven to be valid and reliable among the Turkish people was used in our study, Tezel et al (41).
This test is a 30-point questionnaire that is used extensively in clinical and research settings to measure cognitive impairment.
Advantages of the MMSE:
Requiring no specialized equipment or training for administration
Due to its short administration period and ease of use, it is useful for cognitive assessment in the clinician's office space or at the bedside
Disadvantages of the MMSE:
It is affected by demographic factors; age and education exert the greatest effect.
İt lacks the sensitivity to measure mild cognitive impairment.
Scores greater than or equal to 27 points (out of 30) indicates a normal cognition. Scores below that can indicate severe (≤9 points), moderate (10–18 points) or mild (19–24 points) cognitive impairment. Scores>23 were accepted to include in our study matching the including criteria.
The purpose of using the MMSE was to exclude those patients having lower cognitive performance.
5.2.1.6. BMI Assessment
A standardized measure of the height and weight was performed and from those data the body mass index (BMI) was calculated.
5.2.1.7. Measurement of the Blood Pressure
Systolic and diastolic blood pressures (SBP and DBP, respectively) were computed as the mean values of the three measures taken during the assessment. Hypertension was defined as the presence of at least one of the following features:
21 2. History of hypertension;
3. Current use of antihypertensive drugs
In order to test the balance performance of the patients “Timed Up and Go” test was performed for all of the patients. TUG test is widely used during the evaluation process of the elderly people. TUG test is the shortest and simplest clinical balance test but at the same time is the most reliable test, Yelnik et al (42).
This test is reliable and valid for quantifying functional mobility that may also be useful in following clinical change over time. The test is quick, requires no special equipment or training, and is easily included as part of the routine medical examination.
The test consist of different mobility tasks such as walking with the straight head, turning, sit to stand, stand to sit which require controlling balance. The patient sits on a standard chair, and then he/she stands up and walks in line of 3 meters, then turns around at the line, walks back to the chair and sits down. The test starts when we say go, and stops with the patient’s buttocks touch the seat. The time of this action is recorded in seconds.
5.2.1.8. Nintendo Wii
All the patients underwent the Nintendo Wii balance test.
At the beginning of the test, demographic information of the patient is imported to the device. These information include the birth date, gender and height of the patients. The weight is not included because the Wii balance board is able to measure the weight of the individual who has stood on the board.
In order to better feel the environment of the testing and also realize the virtual concept of the test we used a video projector to reflect the feedback of the Wii balance board on the front white curtain.
22 Photo 5.1. Nintento Wii
We asked all the patients to take off their shoes and get on the balance board. Patients were free to have socks on. The patients stand upright, still and relaxed with both feet separated equally and placed on the specified places indicated by the researcher. A general analysis of the body is performed when the patient is relaxed looking forward to the screen and both arms in normal position. In this section it is important that the patient should not move too much. He/she has to stand still because unsteadiness makes the analysis incorrect and the software asks the patient to stand steady and the analysis is performed again. Also the software asks for which kind of clothing the patient is wearing. We asked all the patients to take of their jacket and a slight clothing were accepted for all the cases.
23 At the end of this analysis the center of pressure (CoP) related to the patient is given by the device. There are for sections of which the CoP can be located by the result of the analysis:
Front-left: section 1
Front-right: section 2
Back right: section 3
Back-left: section 4
The percentage of pressure related to each foot is also shown at the end of this analysis. At this step the distribution of pressure related to each foot was documented by the researcher.
The following step was the single leg balance test. In order to test all the patients at the same situation we asked them to bring their left leg to the middle of the balance board and they were instructed to bring up their right leg as the test starts. The situation and the duration of the test was explained to the patients and all the patients were instructed to stand in a way that the right leg which is going to be brought up, should not touch the other leg or the balance board. In some patients which were susceptible to not understand the test procedure, a pretest single leg standing on the left leg was performed. The test starts with counting 3, 2, and 1. We asked the patients to bring their right leg up when they see number 1.
The whole test takes 30 seconds which the path of the feedback shown to the patients narrows as the seconds proceed and this matter makes the single leg balance more difficult. By the time the patient put his/her foot on the balance board the test stops and the standing time is recorded by the researcher. All the patients were asked to finish the 30-minutes period but no encouragement were given to them. Also the balance performance is given in percentage after the test finishes which for those who finish the 30 seconds the highest score is assigned.
There is also another parameter being gotten from the balance test which is Wii fit age.
24 Wii fit age is an age number related to balance scores of the individual which is calculated by all the balance performance of the patients. The Wii fit age is then compared with the real age of the patient and the difference between the Wii fit age and the real age is calculated.
After the test finishes patients can get off the balance board and put on their shoes.
5.2.1.9. Pedalo® Sensamove Balance Test
All the patient also underwent the Pedalo® Sensamove balance device test. All the patients were informed about the test duration, situation and method before the test.
The best performance was estimated to be obtained if the patient could hold the red spot at the middle of the screen which was a feedback of the balance board. The more the red spot could be held near the middle the better score would be obtained.
A laptop was used to reflect the feedback to the patient. The laptop and the Pedalo® Sensamove balance board were attached with USB cable.
25 Before the patients get on the balance board, the calibration of the device was done for each patient in order to make sure that the red spot comes to the middle of the screen and the balance board is completely horizontal.
Patients were asked to take off their shoes and there feet were placed at the specific places of the round balance board indicated by the researcher. They were allowed to hold the standing bars before the test starts. This was very important because they could set their initial balance and get a confidence about the device. As the balance board is an unsteady surface, that was important that the patients rely on the balance device, therefore the initial holding the standing bars was very important and helpful and is recommended for the other researchers planning to us the Pedalo® Sensamove balance board.
The patients were informed to release their hands when the test starts and trying not to hold o use the standing bars.
26 The Pedalo® Sensamove balance tests consists of three measurements.
At the first measurement the patient had no limitations but were instructed to hold the red spot at middle as much as possible. When the test finishes, the patient were allowed to take the standing bars and get ready for the second measurement.
At the second measurement there was a horizontal rectangle located at the screen which was asking the patients to limit their movement inside that rectangle. The green rectangle was becoming red in color when the patients couldn’t control their balance properly and the red spot got out of the rectangle. This measurement was specifically limiting the anterior and posterior movements of the patients and therefore was measuring how much they can control their balance not to move anteriorly-posteriorly.
At the third measurement there was a vertical rectangle located at the screen which was asking the patients to limit their movement inside that rectangle. The green rectangle was becoming red in color when the patients couldn’t control their balance properly and the red spot got out of the rectangle. This measurement was specifically limiting the side movements of the patients and therefore was measuring how much they can control their balance not to move laterally.
All the results of these three measurements were recorded by the researcher. The patients could get off the device after all three measurements were done.
The sample results of the three measurements of Pedalo® Sensamove balance device related to same subject is given at figure 5.2
27 Figure 5.2 Sample results of the three measurements of Pedalo® Sensamove balance device
28
5.3. Statistical Analysis
Statistical analysis were performed with the SPSS (software package used for statistical analysis) program version 18.0. Data were described as mean, standard deviation and percentage. Comparisons between groups were tested with Student’s-t independent method. The probability value of P<0.05 was considered as significant.
29
6. RESULTS
61 elderly people attended to our study. Patients did not have symptoms of depression. Also the cognitive performance of all the patients were acceptable. All the participants were 65 years old and elder. 31 of the participants had hypertension and 30 of them were normotensive. We name these two groups as hypertensive and normotensive groups.
6.1. Demographic Features
The average age of all participants was 73.88±9.534 with the range of 38 years old. The oldest participant was 103 years old and the youngest participant was 65 years old.
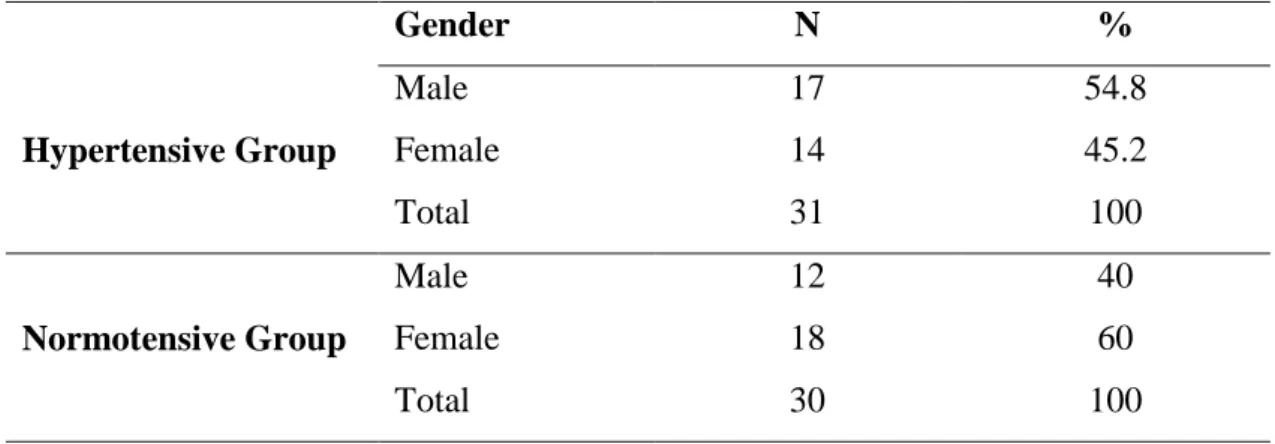
The distribution of the male and females was near to each other. The number of male participants was 29 and the number of female participants was 32. But the number of male participants inside hypertensive group was 17 and the number of female participants inside this group was 14. The number of male participants inside normotensive group was 12 and the number of female participants inside this group was 18. The distribution of males was more than females in hypertensive group and less than them in normotensive group.
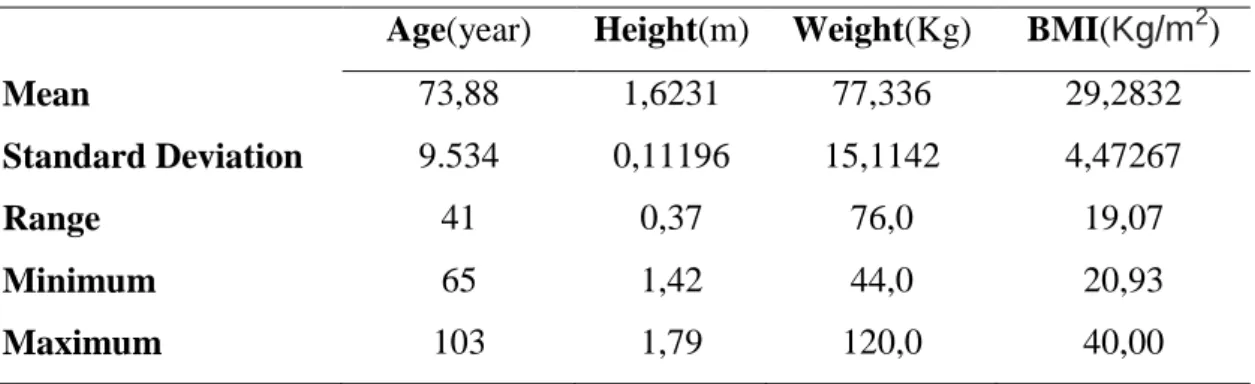
Demographic information of all the participants is given in following tables.
Table 6.1 Distribution of the demographic data
Age(year) Height(m) Weight(Kg) BMI(Kg/m2)
Mean 73,88 1,6231 77,336 29,2832
Standard Deviation 9.534 0,11196 15,1142 4,47267
Range 41 0,37 76,0 19,07
Minimum 65 1,42 44,0 20,93
Maximum 103 1,79 120,0 40,00
30 Table 6.2 Distribution of males and females inside hypertensive and normotensive groups Gender N % Hypertensive Group Male 17 54.8 Female 14 45.2 Total 31 100 Normotensive Group Male 12 40 Female 18 60 Total 30 100
Table 6.3 Distribution of marital statute inside hypertensive and normotensive groups
Marital Status N % Hypertensive Group Married 14 45.2 Single 6 19.4 Divorced/Widow 11 35.5 Total 31 100 Normotensive Group Married 25 83.3 Single 5 16.7 Divorced/Widow 0 0 Total 30 100
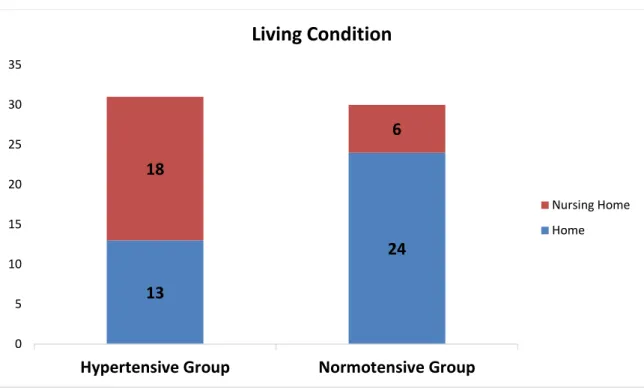
Table 6.4 Distribution of living conditions of the participants inside hypertensive and normotensive groups
Living Condition N % Hypertensive Group Home 13 41.9 Nursing Home 18 58.1 Total 31 100 Normotensive Group Home 24 80 Nursing Home 6 20 Total 30 100
31 The normotensive participants were mostly living at their own homes and were not institutionalized. 41.9% of the hypertensive participants were living at home regarding the 58.1% of the hypertensive participants who were in the nursing home.
Figure 6.1. Living conditions of the participants
Most of the people living at the nursing home had hypertension (75%) while most of the participants living at their own home did not have hypertension (64.9%)
Table 6.5 Distribution of the hypertensive and normotensive participants according to their living condition.
HT/NT N % Living at home Hypertensive 13 35.1 Normotensive 24 64.9 Total 37 100 Living at nursing home Hypertensive 18 75 Normotensive 6 25 Total 24 100 13 24 18 6 0 5 10 15 20 25 30 35
Hypertensive Group Normotensive Group
Living Condition
Nursing Home Home
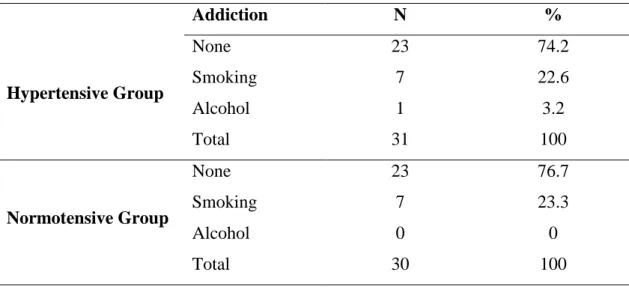
32 Table 6.6 Distribution of smoking and alcohol addiction of the participants inside hypertensive and normotensive groups
Addiction N % Hypertensive Group None 23 74.2 Smoking 7 22.6 Alcohol 1 3.2 Total 31 100 Normotensive Group None 23 76.7 Smoking 7 23.3 Alcohol 0 0 Total 30 100
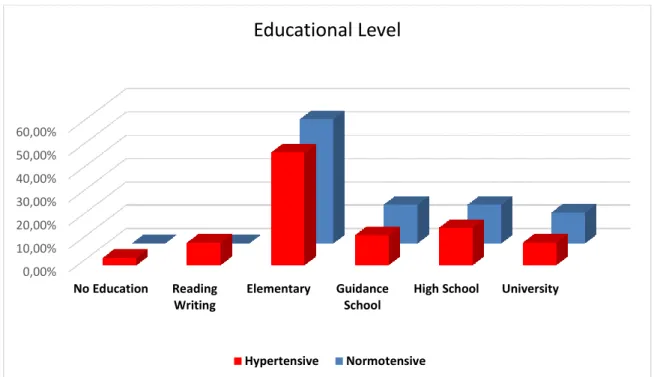
Table 6.7 Distribution of Educational level of the participants inside hypertensive and normotensive groups
Educational level N % Hypertensive Group No Education 1 3.2 Reading Writing 3 9.7 Elementary 15 48.4 Guidance School 4 12.9 High School 5 16.1 University 3 9.7 Total 31 100 Normotensive Group No Education 0 0 Reading Writing 0 0 Elementary 16 53.3 Guidance School 5 16.7 High School 5 16.7 University 4 13.3 Total 30 100
33 The educational level of most of the participants were elementary and below (35 out of 61). Only 7 participants out of 61 had the university educations (11.47% of all the participants).
Figure 6.2. Educational level in participants
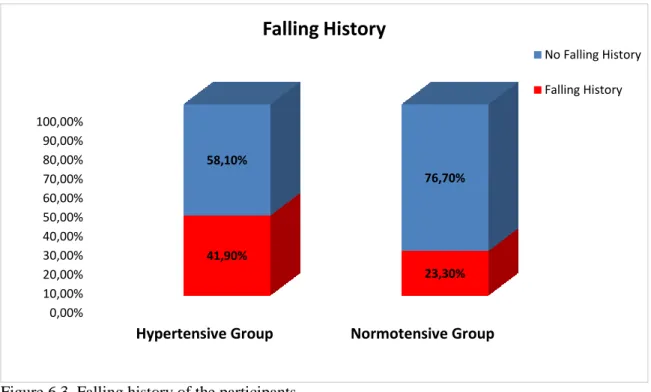
Table 6.8 History of Falling and balance problem in participants inside hypertensive and normotensive groups
Falling Before N % Balance
Problem N % Hypertensive Group No 18 58.1 No 19 61.3 Yes 13 41.9 Yes 12 38.7 Total 31 100 Total 31 100 Normotensive Group No 23 76.7 No 19 36.3 Yes 7 23.3 Yes 11 36.7 Total 30 100 Total 30 100 0,00% 10,00% 20,00% 30,00% 40,00% 50,00% 60,00% No Education Reading Writing Elementary Guidance School
High School University
Educational Level
34 Figure 6.3. Falling history of the participants
Figure 6.4. Balance problems of the participants
0% 10% 20% 30% 40% 50% 60% 70% 80% 90% 100%
Hypertensive Group Normotensive Group
38,70% 36,70% 61,30% 63,30%
Balance Problem
Balance Problem No balance Problem 0,00% 10,00% 20,00% 30,00% 40,00% 50,00% 60,00% 70,00% 80,00% 90,00% 100,00%Hypertensive Group Normotensive Group
41,90% 23,30% 58,10% 76,70%
Falling History
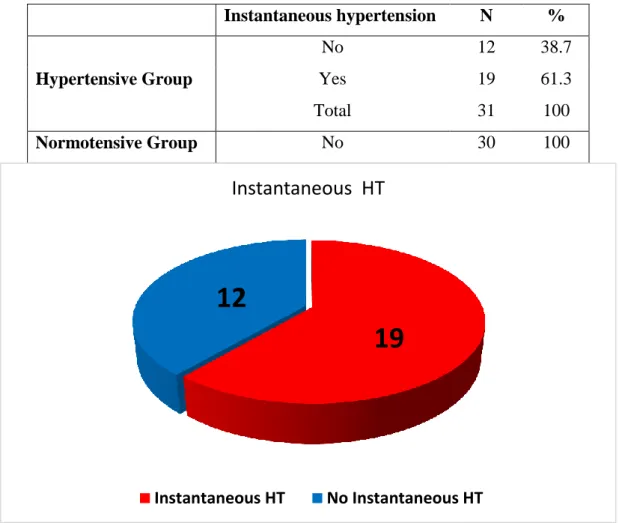
No Falling History Falling History35 In order to understand the status of blood pressure in those participants having hypertension diagnosis and whether their blood pressure is under control or not, a blood pressure measurement was performed for each participant before the other evaluations. In this measurement, those with systolic blood pressure higher than 140 mm Hg assumed as having instantaneous hypertension.
Table 6.9 shows the blood pressure status before balance testing among those with and without hypertension diagnosis. All of those participants without hypertension diagnosis showed normal blood pressure at the time of testing.
61.3% of the patients having diagnosis of hypertension showed instantaneous hypertension at the time of testing and 38.7% of them had normal blood pressure at the time of testing.
Table 6.9 Instantaneous hypertension among hypertensive and normotensive groups.
Instantaneous hypertension N % Hypertensive Group No 12 38.7 Yes 19 61.3 Total 31 100 Normotensive Group No 30 100
Figure 6.5. Distribution of the instantaneous hypertension
19
12
Instantaneous HT
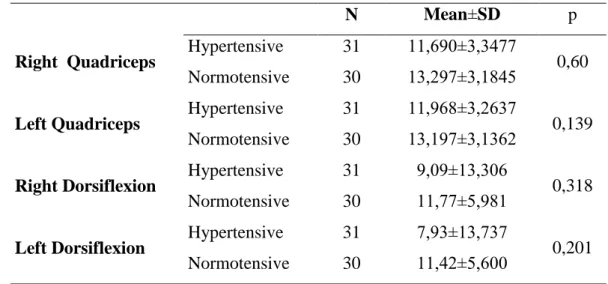
36 To differentiate the values of Quadriceps muscle test and ankle range of motion in hypertensive and normotensive groups, statistical comparison was performed. No statistically significant difference was found between the groups. (p>0.05) Table 6.10 shows the values of Quadriceps muscle test and goniometric results of ankle range of motion in both hypertensive and normotensive groups and the difference between them.
Table 6.10 Right and left Quadriceps muscle strength values, ranges of ankle dorsiflexion with statistical distribution and comparison with t-Test.
N Mean±SD p
Right Quadriceps Hypertensive 31 11,690±3,3477 0,60
Normotensive 30 13,297±3,1845
Left Quadriceps Hypertensive 31 11,968±3,2637 0,139
Normotensive 30 13,197±3,1362
Right Dorsiflexion Hypertensive 31 9,09±13,306 0,318
Normotensive 30 11,77±5,981
Left Dorsiflexion Hypertensive 31 7,93±13,737 0,201
Normotensive 30 11,42±5,600 SD: Standard Deviation
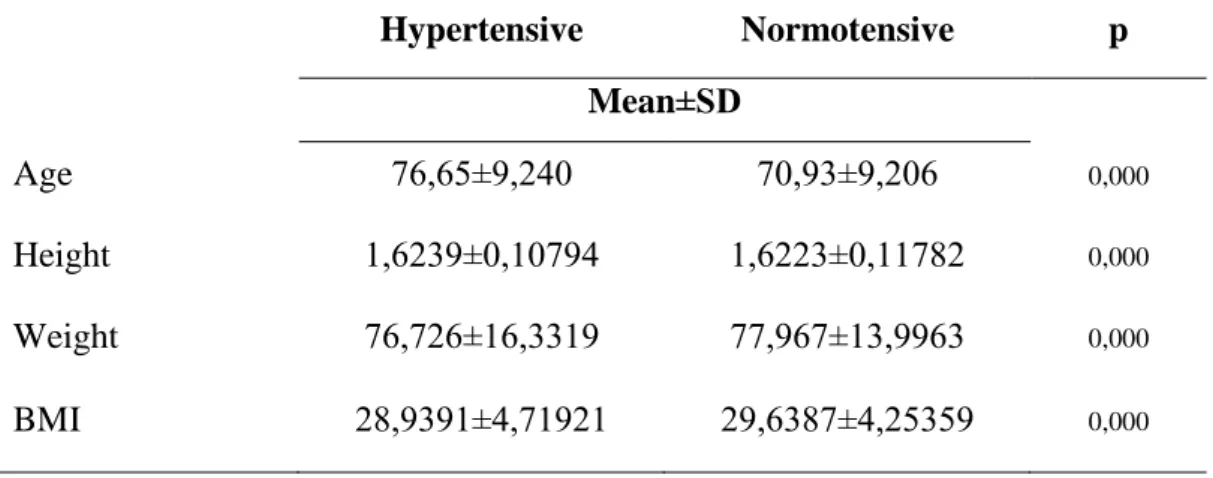
To determine the difference between age, height, weight and Body Mass Index (BMI) of the participants inside both groups, statistical test was performed separately in both hypertensive and normotensive groups.
There was no statistically significant difference between age, height, weight and BMI of the participants of both groups. Hypertension found to be independent to age, height, weight and BMI in both groups of our study and participants of both groups were generally similar from age, height, weight and BMI points of view.
37 Table 6.11 Statistical difference in age, height, weight and BMI between hypertensive and normotensive groups
Hypertensive Normotensive p Mean±SD Age 76,65±9,240 70,93±9,206 0,000 Height 1,6239±0,10794 1,6223±0,11782 0,000 Weight 76,726±16,3319 77,967±13,9963 0,000 BMI 28,9391±4,71921 29,6387±4,25359 0,000 SD: Standard Deviation
For comparing the results of KATZ BADL scale, SMMT and GDS in both
hypertensive and normotensive groups, statistical test was performed. While there was a little difference between results of SMMT (p=0.012), no significantly difference was found in KATZ and GDS among both groups (p>0.05). All the participants had actually similar activity level, cognitive and psychological status.
Table 6.12 Statistical comparison of scores of KATZ BADL, MMSE, and GDS in both of the hypertensive and normotensive groups.
N Mean±SD p BADL Hypertensive 31 17,45±0,995 0,235 Normotensive 30 17,73±0,828 MMSE Hypertensive 31 27,87±2,125 0,012 Normotensive 30 29,10±1,494 GDS Hypertensive 31 6,48±2,204 0,052 Normotensive 30 5,23±2,700
BADL: Basic Activities of Daily Living, MMSE: Mini Mental State Examination, GDS: Geriatric Depression Scale, SD: Standard Deviation
38
6.3. Results related to Balance
We compared the performance of “Timed UP and Go” test between two hypertensive and normotensive groups in order to find out if there is any relation between
hypertension and TUG. A statistically significant difference was found between two groups and hypertensive group had higher completion times in TUG test (p=0.030). Hypertensive patients needed much time to complete the TUG test. The results are shown at Table 6.13.
Table 6.13 Difference between TUG and Hypertension
N Mean(S)±SD p
TUG(s) Hypertensive 31 17,37±10,06 0,030
Normotensive 30 12,62±6,11
TUG: Timed Up and Go Test, SD: Standard Deviation
Figure 6.6. Results of Timed Up and Go Test in Hypertensive and Normotensive Groups During the assessment of the elderly participants with Pedalo sensamove Balance device, the following parameters were taken into consideration:
Performance(%), Front Average Deviation(F Ave Dev), Back Average Deviation(B Ave Dev), Left Average Deviation(L Ave Dev), Right Average Deviation(R Ave
0 20 40 60 1 2 3 4 5 6 7 8 9 101112131415 16 17 18 19 20 21 2223 24 25 26 27 28 29 30 31 Ti m e d Up an d Go Sec o n d s Patients
39 Dev), Horizontal Performance(H Performance) and Vertical Performance(V Performance). To compare the difference between these parameters , t-Test was used. There was no statistically significant difference in parameters of Pedalo between hypertensive and normotensive groups (p>0.05). Table 6.14 shows the parameters of Pedalo balance device compared in both hypertensive and normotensive group.
Table 6.14 Difference in balance parameters of Pedalo Device between hypertensive and normotensive groups.
Pedalo Balance
Parameters Groups N Mean p
Performance % Hypertensive 31 59,29±16,285 0,229
Normotensive 30 63,97±13,59
F Ave Dev Hypertensive 31 2,49±1,39 0,611
Normotensive 30 2,33±0,99
B Ave Dev Hypertensive 31 -1,51±0,94 0,332
Normotensive 30 -1,761±0,99
L Ave Dev Hypertensive 31 -2,03±0,96 0,593
Normotensive 30 -1,90±0,93
R Ave Dev Hypertensive 31 1,98±1,16 0,401
Normotensive 30 1,76±0,91
H Performance % Hypertensive 31 61,74±17,08 0,118
Normotensive 30 68,57±16,54
V Performance % Hypertensive 31 65,71±18,20 0,429
Normotensive 30 69,07±14,39 F Ave Dev: Front Average Deviation, B Ave Dev: Back Average Deviation, L Ave Dev: Left Average Deviation, R Ave Dev: Right Average Deviation, H Performance: Horizontal Performance, V Performance: Vertical Performance
40 Parameters of Nintendo Wii balance board to be compared between participants of hypertensive and normotensive groups were as following:
Distribution of body weight to the Right foot (indicated by Wii R)
Distribution of body weight to the Left foot (indicated by Wii L)
Completed seconds in Wii Single Leg Balance Test (indicated by SLB Sec)
Performance score in Wii Single Leg Balance Test (indicated by SLB performance %)
Wii Fit age
To compare these parameters in both participants of hypertensive and normotensive groups, t-Test was used. While no statistically significant difference was found in “Distribution of body weight to the Right foot” and “Distribution of body weight to the Left foot” (p>0.05), parameters of “Completed seconds in Wii Single Leg Balance Test”, “Performance score in Wii Single Leg Balance Test” and “Wii Fit Age” between both groups was determined significant in the statistical analysis (P<0.05). Data related to Nintendo Wii balance scores, mean values, standard deviation and p values are shown in Table 6.15
Table 6.15. Difference between balance parameters of Nintendo Wii Balance board in Hypertensive and Normotensive groups
N Mean±SD P Wii R Hypertensive 31 51,0097±7,15469 0,431 Normotensive 30 49,8067±4,29610 Wii L Hypertensive 31 48,6355±7,13436 0,309 Normotensive 30 50,1900±4,29389 SLB Sec Hypertensive 31 14,1306±9,89863 0,001 Normotensive 30 22,6217±9,93210 SLB Performance % Hypertensive 31 18,30±20,316 0,000 Normotensive 30 42,87±24,609
Wii Fit Age Hypertensive 31 72,97±18,198
0,002 Normotensive 30 58,87±15,986
Wii R: Wii Right, Wii L: Wii Left, SLB Sec: Single Leg Balance Seconds, SLB Performance: Single Leg Balance Performance, SD: Standard Deviation
41 As the scores of Pedalo Balance Device were all statistically meaningless, the later analyses are all done only by the Nintendo Wii balance board results and TUG.
For analyzing if there is any relationship between falling history and balance performance t-Test was used for comparing the data.
The results of Nintendo Wii Balance board and TUG and the statistical comparison of these parameters between two groups are given at Table 6.16
After statistical analysis the results showed that among those participants who had a history of falling, there was no significant difference in balance performance (p>0.05 in all parameters). Participants with having a history of falling presented the same balance performance in both hypertensive and normotensive group. Therefore by having a history of falling balance performance found to be independent to hypertension.
Statistical analysis also showed that among those participants who had not a history of falling before, Wii R and Wii L was not significantly different. However hypertensive participants who had not a history of falling showed different performances in TUG, Nintendo Wii parameters compared to normotensive participants. Although having not a history of falling, hypertensive group had longer time duration in TUG, and worse performance in Nintendo Wii Balance board (except Wii R and Wii L). There was a significant statistical difference in TUG, Wii SLB Sec, Wii SLB Performance % and Wii Fit Age between hypertensive and normotensive group which are given at Table 6.16.
42 Table 6.16 Difference between balance performance in hypertensive and normotensive groups regarding their falling history
History of Falling N Mean±SD P NO TUG Hypertensive 18 15,1394±6,86159 0,016 Normotensive 23 10,7291±2,09588 Wii R Hypertensive 18 50,6556±5,27360 0,408 Normotensive 23 49,4261±4,14293 Wii L Hypertensive 18 49,3444±5,27360 0,408 Normotensive 23 50,5739±4,14293 SLB Sec Hypertensive 18 14,2550±10,35325 0,001 Normotensive 23 25,2943±7,73069 SLB Performance % Hypertensive 18 17,58±19,306 0,000 Normotensive 23 50,23±19,810 WFA Hypertensive 18 70,67±22,326 0,010 Normotensive 23 55,48±13,399 Yes TUG Hypertensive 13 20,4715±12,98945 Normotensive 7 18,8357±10,29251 0,777 Wii R Hypertensive 13 51,5000±9,38758 Normotensive 7 51,0571±4,88803 0,909 Wii L Hypertensive 13 47,6538±9,27637 Normotensive 7 48,9286±4,87433 0,740 SLB Sec Hypertensive 13 13,9585±9,64623 Normotensive 7 13,8400±11,84507 0,981 SLB Performance % Hypertensive 13 19,31±22,403 Normotensive 7 18,71±24,493 0,957 WFA Hypertensive 13 76,15±10,139 Normotensive 7 70,00±19,706 0,462 TUG: Timed Up and GO Test, Wii R: Wii Right, Wii L: Wii Left, SLB Sec: Single Leg Balance Seconds, SLB Performance: Single Leg Balance Performance, WFA: Wii Fit Age, SD: Standard Deviation
43 The last analysis is related to comparing the balance performance regarding the instantaneous hypertension. The results of statistical t-Test is given in Table 6.17. By splitting the participants into those having instantaneous hypertension and those without instantaneous hypertension we searched for the differences in TUG, Wii R, Wii L, SLB Sec, SLB Performance % and Wii fit age between these groups (one group with instantaneous hypertension and one group without instantaneous hypertension).
While there was no significant difference in TUG, Wii R, Wii L and Wii fit Age (p>0.05), the results of “Wii SLB Sec” and “Wii SLB Performance %” found to be statistically significant(p<0.05). There was no difference in TUG, Wii R, Wii L and Wii fit Age if there were instantaneous hypertension or not.
The participants with instantaneous hypertension had worse balance performance in “Wii SLB Sec” and “Wii SLB Performance %”. These participant stood fewer seconds on the Wii balance board and their Wii balance performance was worse than those without instantaneous hypertension.
Table 6.17 Difference between Balance performance in Hypertensive and Normotensive groups regarding their Instantaneous Hypertension
Instantaneous Hypertension N Mean P TUG NO 42 13,5131±6,11195 0,109 YES 19 18,4058±12,07514 Wii R NO 42 50,3548±4,48135 0,922 YES 19 50,5579±8,39665 Wii L NO 42 49,4286±4,47150 0,965 YES 19 49,3368±8,42821 SLB Sec NO 42 20,5245±10,75067 0,015 YES 19 13,4037±9,12089 SLB Performance % NO 42 36,05±25,412 0,009 YES 19 17,86±21,528 WFA NO 42 63,74±17,108 0,150 YES 19 71,11±20,639
TUG: Timed Up and GO Test, Wii R: Wii Right, Wii L: Wii Left, SLB Sec: Single Leg Balance Seconds, SLB Performance: Single Leg Balance Performance, WFA: Wii Fit Age, SD: Standard Deviation