VALUE CREATION IN U.S. BANK MERGERS
BEFORE AND AFTER THE GLOBAL FINANCIAL CRISIS
A THESIS SUBMITTED TO
THE INSTITUTE OF SOCIAL SCIENCES OF
ANKARA YILDIRIM BEYAZIT UNIVERSITY
BY
İMDAT DOĞAN
IN PARTIAL FULFILLMENT OF THE REQUIREMENTS FOR THE DEGREE OF DOCTOR OF PHILOSOPHY IN THE DEPARTMENT OF BANKING AND FINANCE
Approval of the Institute of Social Sciences
____________________________ Prof. Dr. Zeki Salih ZENGİN Manager of Institute
I certify that this thesis satisfies all the requirements as a thesis for the degree of Doctor of Philosophy.
______________________________ Doç. Dr. Ayhan KAPUSUZOĞLU
Head of Department
This is to certify that we have read this thesis and that in our opinion it is fully adequate, in scope and quality, as a thesis for the degree of Doctor of Philosophy.
_______________________________ Prof. Dr. Semih YILDIRIM
Supervisor
Examining Committee Members
Prof. Dr. Semih YILDIRIM (YBU, Banking and Finance) ______________
Prof. Dr. Güray KÜÇÜKKOCAOĞLU (Başkent University, Finance) ______________
Doç. Dr. Afşin ŞAHİN (Gazi University, Banking) ______________
Yrd. Doç. Dr. Erhan ÇANKAL (YBU, Banking and Finance) ______________
I hereby declare that all information in this thesis has been obtained and presented in accordance with academic rules and ethical conduct. I also declare that, as required by these rules and conduct, I have fully cited and referenced all material and results that are not original to this work; otherwise I accept all legal responsibility.
Name, Last Name: İmdat DOĞAN
ABSTRACT
VALUE CREATION IN U.S. BANK MERGERS
BEFORE AND AFTER THE GLOBAL FINANCIAL CRISIS
Doğan, İmdat
Ph.D., Department of Banking and Finance Supervisor: Prof. Dr. Semih Yıldırım
September 2015, 110 pages
This thesis examines short-term value creation of 214 mergers and acquisitions (M&As) that were announced between 2000 and 2014 in U.S. banking industry. In particular, the merger premiums before and after the Global Financial Crisis (2008-2009) are examined. We find that, on average, the target banks’ cumulative abnormal returns (CARs) are 23.64% while the bidders’ CARs are -1.24% around the announcement date with a 3-day (+1,-1) event window over the sample period both being statistically significant. We also find statistically significant positive CARs of 2.42% for the combined entity of the bidder and target banks within the same event window. Our findings point out that M&As are value-creating events for the combined entity due to created synergies between bidders and targets; however, bidders may sometimes overpay to obtain these gains. The CARs for the M&As that cash is used as a medium of payment are found to be higher than stock only-financed acquisitions. Our findings reveal that M&As taking place before the Global Financial Crisis period (2000-20007) realize lower gains for targets, bidders and combined compared to those after the Global Financial Crisis periods (2010-2014) possibly due to stronger banks surviving after the crisis and more prudent and reliable market environment after the Dodd-Frank Act. For target and bidder banks, the CARs decrease as the relative size of the target to the bidder bank increase. Finally, we demonstrate that instate (focusing) mergers resulted in higher CARs than interstate (diversifying) mergers for the full sample period.
Keywords: Banking, mergers and acquisitions, U.S. Banking industry, event-study analysis, global financial crisis, merger premiums, cumulative abnormal return.
ÖZET
KÜRESEL FİNANSAL KRİZ ÖNCESİ VE SONRASI AMERİKAN BANKA BİRLEŞMELERİNDE DEĞER YARATMALARI
Doğan, İmdat
Doktora, Bankacılık ve Finans Bölümü Danışman: Prof. Dr. Semih Yıldırım
Eylül 2015, 110 sayfa
Bu tez, 2000-2014 yılları arasında 214 Amerikan bankasının satın alma ve birleşmelerinin (SAB) kısa dönem değer yaratımlarını incelemektedir. Bu kapsamda, özellikle Küresel Finansal Kriz (2008-2009) öncesindeki ve sonrasındaki SAB’ların primleri incelenmektedir. Bütün periyotta, 3-günlük (-1, +1) olay penceresinde hedef bankaların Kümülatif Anormal Getirileri (KAG) ortalama +%23.64 olarak gerçekleşirken, satın alan bankaların KAG’ları ortalama -%1.24 her ikisi de istatistiksel olarak anlamlı gerçekleşmiştir. Aynı olay penceresinde, satın alan ve hedef bankaların toplam KAG’ları ise istatistiksel olarak anlamlı ve +%2.42’dir. Bizim bulgularımıza göre, SAB’ler, satın alan ve hedef firma arasındaki sinerjiden dolayı, toplamda değer yaratmaktadırlar ancak satın alan firmalar olması gerekenden daha fazla ödeme yapabilmektedirler. SAB’lerin finansmanında nakit kullanıldığındaki hedef bankaların KAG’ları yalnızca hisse senedi kullanılan anlaşmalardan daha fazladır. Bizim bulgularımıza göre, Küresel Finansal Kriz öncesindeki (2000-2007) gerek hedef gerekse satın alan bankaların KAG’ları Küresel Finansal Kriz sonrasındaki zaman diliminden (2010-2014) daha az gerçekleşmiştir; bunun belki de en büyük nedeni daha güçlü bankaların krizden sonra ayakta kalmaları ve Dodd_Frank yasasından sonra daha temkinli ve güvenilir bir piyasanın oluşması gösterilebilir. Hedef bankalar ve satın alan bankalar için, hedef bankanın satın alan bankaya oranı olan göreceli boyutu arttıkça KAG azalmaktadır. Nihayet, coğrafi odaklı SAB sinerji ile beraber daha çok değer yaratmaktadır; şöyle ki, aynı eyaletteki SAB’lar farklı eyaletlerdeki SAB’lara göre bütün periyotta yüksek KAG’lar üretmiştir.
Anahtar Kelimeler: Bankacılık, satın alma ve birleşmeler, Amerikan bankacılık sektörü, standart olay çalışması, küresel finansal kriz, birleşme primleri, kümülatif anormal getiri.
ACKNOWLEDGMENTS
I would like to express my deepest gratitude to my supervisor Prof. Dr. H. Semih
YILDIRIM for his guidance, advice, criticism, encouragements and insight throughout the research.
I would also like to thank the members of thesis monitoring committee Assist. Prof. Dr. Erhan ÇANKAL and Dr. Aziz TURHAN and the committee members Prof. Dr. Güray KÜÇÜKKOCAOĞLU and Assoc. Prof. Afşin ŞAHIN for their insightful suggestions and comments.
Finally, I would like to thank you my wife and my children for their patience and support through the whole process in writing this dissertation.
TABLE OF CONTENTS
ABSTRACT ... ii ÖZET ... iii ACKNOWLEDGMENTS ... v TABLE OF CONTENTS ... vi LIST OF TABLES ... ix LIST OF FIGURES ... xiLIST OF ABBREVIATIONS ... xii
1. INTRODUCTION ... 1
2. LITERATURE REVIEW ... 10
2.1 Mergers and Acquisitions in Brief ... 10
2.2 Motivations on Mergers and Acquisitions ... 11
2.3 Wealth Effects of Mergers and Acquisitions ... 14
2.4 Method of Payments ... 16
2.5 Geographic Market Expansion ... 18
3. TESTABLE HYPOTHESES ... 20
4. DATA STATISTICS AND SAMPLE SELECTION ... 22
5. EMPIRICAL MODEL AND METHODOLOGY ... 28
5.1 Testing the Consolidation Effect ... 28
5.2 Event Study Methodology and the Model ... 29
5.3 Testing the Model ... 36
6. EMPIRICAL RESULTS ... 39
6.1.1 Overall Results for Target, Bidder, and Combined Utilizing S&P500 Index Return
... 39
6.1.2 Overall Results for Targets, Bidders, and Combined Utilizing U.S. Banking Index Return ... 43
6.2 Overall Results with Respect to the Hypotheses ... 48
6.2.1 Overall Results Utilizing S&P500 Index Return Data with Respect to the Hypotheses ... 49
6.2.2 Overall Results Utilizing U.S. Banking Index Return Data with Respect to the Hypotheses ... 50
6.2.3 Comparison of S&P500 and U.S. Banking Index Return Data with Respect to the Hypotheses ... 51
6.3 Year over Year Results for Targets, Bidders, and Combined ... 52
6.3.1 Year over Year Results with S&P500 Index Return Data... 52
6.3.2 Year over Year Results with U.S. Banking Index Return Data ... 54
6.3.3 Comparison of Year over Year CARs between S&P500 Index Return and U.S. Banking Index Return Data ... 55
6.3.4 Year over Year Results with S&P500 Index Return Data with Different Event Windows ... 57
6.4 Comparison of Pre- and Post-Crisis CARS for Targets, Bidders, and Combined .... 59
6.5 Method of Payment ... 64
6.6 Geographic Location ... 69
6.7 Regression Analysis ... 73
7. SUMMARY AND CONCLUSION ... 78
REFERENCES ... 81
A- TURKISH SUMMARY ... 92 B- SAMPLE MARKET VALUE AND SIZE STATISTICS ... 98 C- CURRICULUM VITAE... 110
LIST OF TABLES
Table 1- Testable Hypotheses and Expected Effects of Bank Mergers and Acquisitions .. 21 Table 2- Data Elimination of Sample Size ... 23 Table 3- Summary Statistics of the Sample... 25 Table 4- Year Over Year US Bank M&A Sample Summary Statistics by Geographic Location ... 26 Table 5- Year Over Year US Bank M&A Sample Summary Statistics by Method of Payment ... 27 Table 6- Cumulative Abnormal Returns (CARs) with SP500 Crisp Index ... 40 Table 7- Cumulative Abnormal Returns (CARs) with U.S. Banking Index ... 45 Table 8- Comparison of Hypotheses with Different Sub-periods Utilizing SP500 Crisp Index ... 49 Table 9- Comparison of Hypotheses with Different Sub-periods Utilizing U.S. Banking Index ... 50 Table 10- U.S. Bank M&A 3-Day (-1, +1) Event Window Sample Statistics: SP500 Crisp Index ... 53 Table 11- Bank M&A 3-Day (-1, +1) Event Window Sample Statistics: U.S. Banking Index ... 54 Table 12- Difference of Bank M&A 3-Day (-1, +1) Event Window Sample Statistics between S&P500 Index and U.S. Banking Index ... 56 Table 13-U.S. Bank M&A 5-Day (-2, +2) Event Window Sample Statistics ... 58 Table 14- Bank M&A 36-Day (-30, +5) Event Window Sample Statistics ... 59 Table 15- Pre- and Post-Crisis Cumulative Abnormal Returns (CARs) with SP500 Crisp Index ... 61
Table 16- Pre- and Post-Crisis Cumulative Abnormal Returns (CARs) with U.S. Banking Index ... 62 Table 17- Summary Statistics of the Sample with Respect to Method of Payments ... 65 Table 18- CARs to Targets, Bidders and Combined with Respect to Method of Payment 66 Table 19- Sample Statistics of the Sample with Respect to Geographic Location ... 69 Table 20- CARs to Targets, Bidders and Combined with Respect to the Geographic Diversification ... 72 Table 21- Regression Analysis Summary Statistics ... 75
LIST OF FIGURES
Figure 1- Number of Institutions: FDIC-Insured Commercial Banks (1934-2014) ... 2
Figure 2- Total Assets, All Commercial Banks (in Billions of $US) ... 3
Figure 3- Assets Held By Top 10 U.S. Commercial, March 31, 2001 Banks (Mil $) ... 4
Figure 4- Assets Held By Top 10 U.S. Commercial Banks, March 31, 2015 (Mil $) ... 4
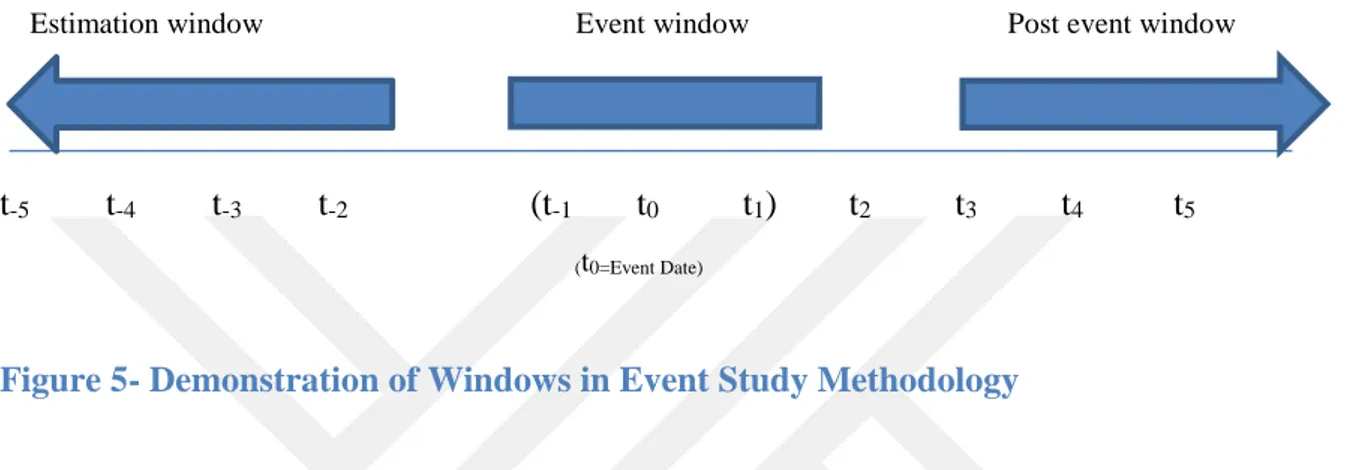
Figure 5- Demonstration of Windows in Event Study Methodology ... 31
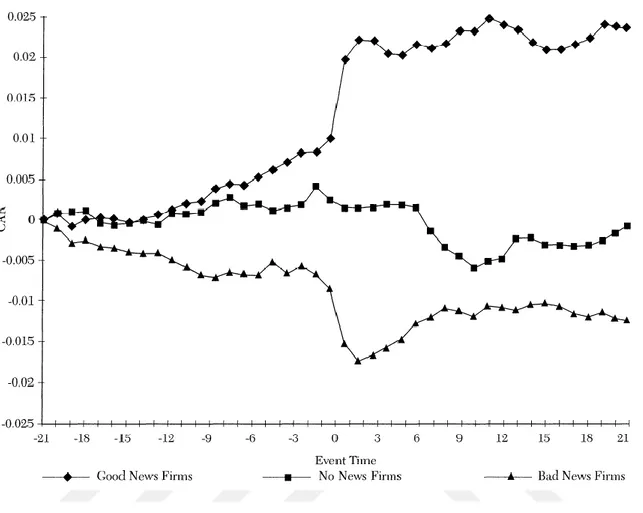
Figure 6- Demonstration of Different CARs in Event Study Methodology ... 33
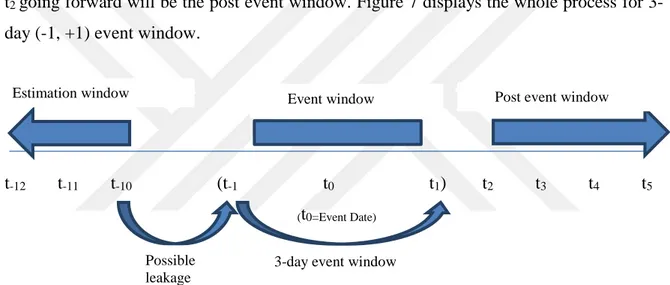
Figure 7- Demonstration of Event Study Methodology with 3-Day (-1, +1) Event Window ... 34
Figure 8- Demonstration of Event Study Methodology with 5-Day (-2, +2) Event Window ... 35
Figure 9- Demonstration of Event Study Methodology with 36-Day (-30, +5) Event Window ... 35
Figure 10- U.S. Bank M&A 3-Day (-1, +1) Event Window: SP500 Crisp Index ... 53
Figure 11- U.S. Bank M&A 3-Day (-1, +1) Event Window: U.S. Banking Index ... 55
Figure 12- Year over Year Difference between S&P500 Index Return and U.S. Banking Index Return Data ... 57
Figure 13- Year Over Year US Bank M&A Sample Summary Statistics by Geographic Location ... 70
LIST OF ABBREVIATIONS
AR Abnormal Return
BHC Bank Holding Company CAR Cumulative Abnormal Return
CRISP Center for Research in Security Prices FDIC Federal Deposit of Insurance
FRB The Federal Reserve Board M&As Mergers and Acquisitions OLS Ordinary Least Squares
SEC U.S. Securities and Exchange Commission S&P Standard & Poor’s
TSX Toronto Stock Exchange U.S. United States of America
1. INTRODUCTION
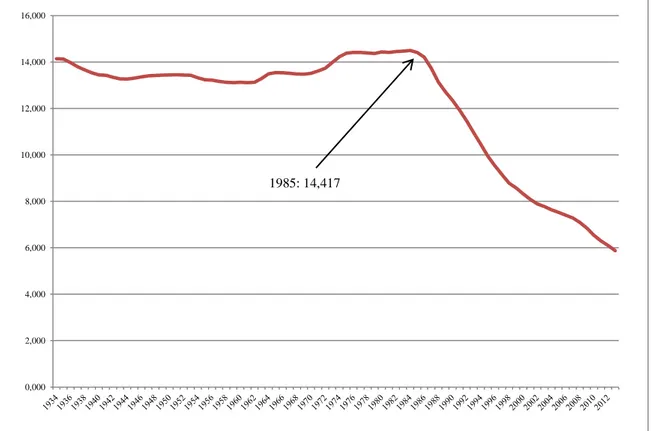
Over the past three decades, U.S. Banking Industry has experienced a phenomenal consolidation, thanks to mergers and acquisitions by financial institutions. During this time interval, the number U.S. Commercial Banks has declined from 14,417 to 5,501 as presented in Figure 1.
Mergers and Acquisitions (M&As) have been regarded as an important growth strategy by many firms and corporations including financial institutions. According to the finance literature, the primary motivation for consolidation by the bidder firms is maximizing shareholder value. However, not all the motives are for value maximization such as the role of managers, the role of government, technological changes, etc.
Although many excellent research studies have been performed, many papers have been published and many new issues have yet to be studied on M&As in banking industry we do not fully understand the exact motives behind M&As and do not know whether or not they create value for bidders, targets or the combined deal (Roll, 1986). We probably argue that the motives behind M&As and the value creation following an M&A announcement vary depending on the time, location, market cycle and etc.
Consolidation of U.S. FDIC-insured commercial banks has begun afterwards the number of commercial banks in the U.S. peaked in mid-1980s. This consolidation trend has continued without an interruption - including the Global Financial Crisis - up to date. Industry consolidation occurred primarily as a result of change in legal framework, financial and technological innovation that altered the optimal production functions of financial firms. Technological advances revolutionized back-office processing, front-office delivery systems, and payments systems (Berger 2003; Humphrey et al. 2006). This consolidation has continued during the Global Financial Crisis as the Crisis led to many troubled financial institutions including the commercial banks in the U.S. to be bought out by another bank or merge with another financial institution.
As can be seen from the Figure 1, the number of FDIC insured commercial banks has started decreasing starting from 1985 and still to come down more as opposed to the steady increase in branches1 and offices of FDIC insured commercial banks. This is the biggest proof of a consolidation period in the last 30 years or so. There might be many factors inducing this consolidation but it is mostly due to M&A transactions taking place in the U.S. Banking Industry.
Source: Federal Deposit Insurance Corporation
Figure 1- Number of Institutions: FDIC-Insured Commercial Banks (1934-2014)
The U.S. commercial banks has consolidated significantly over the last 30 years. Number of commercial banks in the U.S. was at historical levels of 14,417 in 1985. This number has steadily decreased over the last three decades to 12,347 levels in 1990, 8,315 levels in 2000, and 7,088 levels in 2008, 6,292 levels in 2011 and is 5,501 levels as of March 31, 2015.
1 For the detailed data between 1934 and 2014, please see Table 22: Number of Unit Institutions and Institutions with
Branches: FDIC-Insured Commercial Banks.
0,000 2,000 4,000 6,000 8,000 10,000 12,000 14,000 16,000 1985: 14,417
From 1990 to March 31, 2015, a total of 8,910 commercial bank mergers and 1,621 savings institutions mergers have been occurred in the U.S.2
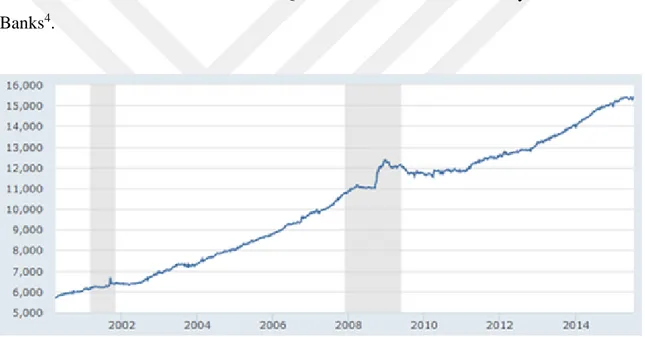
While total assets held by U.S. Commercial Banks rose from US$5,983 billions in 2000/2Q to US$14,033 billions, in 2015/1Q, total assets held by U.S: Savings institutions decreased from US$1,179 billions in 2000/2Q to US$1,041 billions in 2015/1Q3.
Consolidation of U.S. Commercial Banks in the number of institutions has been reflected at the largest ten U.S. Commercial Banks’ Balance Sheets. While assets held by the largest ten U.S. Commercial Banks was US$2.4 trillions in 2001/1Q, which was 41% of assets held by total U.S. Commercial Banks, assets held by the largest ten U.S. Commercial Banks increased to US$8.4 trillions in 2015/1Q which is 61% of assets held by U.S. Commercial Banks4.
Source: Board of Governors of the Federal Reserve System (US)
Figure 2- Total Assets, All Commercial Banks (in Billions of $US)
Figure 2 represents the total assets of U.S. Commercial Banks. Shaded areas in the graph represent the two crises in 2001 and 2008-2009. As can be observed from the Figure 2, despite the short-terms disruptions due to the crises, overall trend continues upwards by the
2 FDIC Historical Trends, Statistics at a Glance; https://www.fdic.gov/bank/statistical/stats/ 3 Latest Industry Trends, Statistics at a Glance; https://www.fdic.gov/bank/statistical/stats/
years meaning that the financial system in U.S. has been growing in line with the overall economy.
BANK NAME BANK HOLDING COMPANY ASSETS
BANK OF AMERICA BANK OF AMER CORP 553,509
CHASE MANHATTAN BK JP MORGAN CHASE & CO 400,623
CITIBANK NA CITIGROUP 395,869
FIRST UNION NB FIRST UNION CORP 232,608
MORGAN GUARANTY TC OF NY JP MORGAN CHASE & CO 214,462
FLEET NA BK FLEETBOSTON FNCL CORP 200,887
BANK ONE NA BANK ONE CORP 141,439
WELLS FARGO BK NA WELLS FARGO & CO 124,137
SUNTRUST BANK SUNTRUST BANK 100,443
HSBC BK USA HSBC NORTH AMER 81,826
Total Assets of Largest 10 U.S. Commercial Banks 2,445,803
Total Assets of U.S. Commercial Banks 5,935,229
Total Assets of Largest 10 Commercial Banks /
Total Assets of Commercial Banks 41,2%
Source: Compiled from Federal Reserve Statistical Release
Figure 3- Assets Held By Top 10 U.S. Commercial, March 31, 2001 Banks (Mil $)
BANK NAME BANK HOLDING COMPANY ASSETS
JPMORGAN CHASE BK NA JPMORGAN CHASE & CO 2,096,114
BANK OF AMER NA BANK OF AMER CORP 1,599,746
WELLS FARGO BK NA WELLS FARGO & CO 1,571,389
CITIBANK NA CITIGROUP 1,335,871
U S BK NA U S BC 405,363
PNC BK NA PNC FNCL SVC GROUP 340,231
BANK OF NY MELLON BANK OF NY MELLON CORP 316,699
STATE STREET B&TC STATE STREET CORP 274,919
CAPITAL ONE NA CAPITAL ONE FC 253,202
TD BK NA TD US P & C HOLD ULC 234,389
Total Assets of Largest 10 U.S. Commercial Banks 8,427,923
Total Assets of U.S. Commercial Banks 14,033,541
Total Assets of Largest 10 Commercial Banks /
Total Assets of Commercial Banks 61,2%
Source: Compiled from Federal Reserve Statistical Release
Above two figures (Figure 3 and Figure 4) exhibit the total assets held by U.S. Commercial Banks and the largest ten U.S. Commercial Banks in terms of asset held. First thing to notice, during 14 years, total assets held by U.S. Commercial Banks rose from USD 5.9 trillions to USD14 trillions, which corresponds to 136% increase in total assets. In the same period, total assets of largest ten U.S. Commercial Banks rose from USD2.4 trillions to USD7.8 trillions, which corresponds to 245% increase in total assets. From 2001 to 2015, the percentage of total assets held by ten largest U.S. Banks to total assets of U.S. Commercial Banks increased from 41% to 61%, translating to approximately a hefty 50% increase.
Another data worth to look at is that the number of Insured U.S.-Chartered Commercial Banks that have consolidated assets of equal to or more than $300 million is 1,784 as of 31 March of 2015 while the number of Insured U.S.-Chartered Commercial Banks that have consolidated assets of equal to or more than $100 million was 3,431 as of 31 March of 2001. As we can see the number of institutions decreased by 50% while the assets held by these institutions tripled.
Comparing these two data sets, one in 2001 and the other in 2015, another noteworthy point is that four U.S. Commercial Banks (JPMorgan Chase & Co, Bank Of America Corp, Wells Fargo & Co and Citigroup) reserved their positions in the same top ten lists from 2001 to 2015.
In our opinion, this long-run consolidation period could have not been sustained without a legislative support. In that sense, The Riegle-Neal Interstate Banking and Branching Efficiency Act of 1994 could be one of major catalysts behind intense U.S. Bank M&A activity, which has been in place since 1985.
The Riegle-Neal Interstate Banking and Branching Efficiency Act of 1994 removed most of restrictions on interstate bank M&As and granted interstate branching possible for the first time in seventy years. These restrictions were mostly the result of the McFadden Act in 1927 and other related laws acted to concentrate banking activities in the nation so as to be adequately supervised5. With this new Act;
5 Prior to the Riegle-Neal Act, the Douglas Amendment to the BHC of 1956 was in place and prohibited interstate
Bank Holding Companies (BHCs) with enough capital and management capacity would be allowed to acquire any bank in any State nationwide.
BHCs operating different states could be merged into a single branch network.
A BHC could not control more than 10% of the Country’s total deposits or 30% of any State’s total deposit should a state does not have a deposit cap.
States would choose to opt-out- of the new Act’s branching provisions.
The Financial Services Modernization Act of 1999 also repealed the legislation dating back to the Banking Act of 1933, which was implemented after the Great Depression, to prevent banks, securities firms, and insurance companies from merging. The Financial Services Modernization Act of 1999 accelerated the trend toward huge financial services companies typified by the 1998 Citicorp-Travelers merger, which recorded as the largest corporate merger ever, constituting the world's biggest financial-services company and offering banking, insurance and investment services in 100 countries6.
In response to the Global Financial Crisis, the Dodd-Frank Wall Street Reform and Consumer Protection Act were approved on July 21, 2010 by President Obama. The Act boosts the financial stability of the United States by improving accountability and transparency in the financial system and ceases ‘‘too big to fail’’ perception, to protect the American citizens by ending bailouts, from abusive financial services practices, and for other perverted purposes.
The Dodd-Frank Wall Street Reform and Consumer Protection Act introduced significant changes regarding the surveillance and supervision of financial institutions including systemically important large financial companies or so called “too big to fail financial institutions”. The act introduces more rigorous prudent standards such as more vigorous requirements for capital, M&As, leverage, risk management, and stress testing on bank
holding companies and other financial institutions whose breakdown could jeopardize the stability of the US financial system. The Act limits the size of any bank or nonbanking financial company. In terms of a merger or acquisition, the Federal Reserve Board (FRB) is prohibited from approving a transaction involving a financial company should the total consolidated liabilities of combined company after the consolidation would exceed 10% of the accumulated consolidated liabilities of all financial companies in the United States as of the end of the preceding calendar year.
With the globalization and lax regulation, commercial banks all over the world have moved well beyond their traditional role of accepting deposits and giving out loans into investment banks, insurance companies, individual consumers, investment management and trading firms. Some researchers and academicians argue that granting banks to operate well beyond their traditional lines of business served to the breakdown in the Global Financial Markets in 2008 and 2009.
This study explores the short-term value creation of 214 M&A transactions that occurred during the 2000–2014 time periods in USA. We aim to test value creation of the mergers and acquisitions before and after the global financial crisis in U.S. commercial banks. The data related to merger announcements were obtained from SNL Financial. The stock market return data for target and bidder banks along with SP500 index were retrieved from the Center for Research in Security Prices (CRISP) Database7.
We analyze the target, bidder and combined cumulative abnormal returns8 (CARs) computed using standard event study methodology and empirically examine the short-term stock price return to U.S. bank M&A announcements in order to measure the value creation of U.S. Bank mergers and acquisitions. Then, we attempt to explain why difference in stock price reactions to M&A deals exist. Specifically, we investigate
(1) ‘cash + mix’ vs. ‘common stock only’ – financed transactions
(2) instate (geographically focused) vs. interstate (geographically diversified) mergers, and
7 All the details about sample selection can be read on Data and Sample Selection section.
8 Abnormal return is the return to shareholders due to nonrecurring events that differs from what would have been predicted
(3) relative size of bidder and target banks.
Finally, we explore whether the short-term market reaction of targets, bidders and combined to merger announcements has changed before and after the Global Financial Crisis to better understand the drivers and patterns of the abnormal returns.
The selection of the benchmark to measure normal returns is central to conduct the event study. In previous literature, S&P 500 Index is usually employed as a benchmark in computation of abnormal returns. To correctly measure the announcement impact of an M&A deal in banking industry, we need to control for confounding factors outside the banking industry. With this goal in mind, we employ the U.S. Banking Index9 alternative to S&P 500 Index as a benchmark. This approach may yield more accurate results relative to traditional approach since the returns of the banks subject to M&A deal are more correlated with banking index returns than S&P 500 Index returns, thus capturing the actual effect of the deal. In this respect, our research contributes to the current literature by introducing a new benchmark in computation of ARs.
Our research also contributes to the literature by examining the most recent merger deals including those occurred after the Global Financial Crisis. In that respect, we get to examine whether merger premiums have changed following the crisis and recent regulation in the financial markets such as Dodd-Frank Wall Street Reform and Consumer Protection Act.
There are many research papers published since the Global Financial Crisis, however; to our knowledge, there is no comprehensive study to examine the wealth effect of the U.S. Bank mergers from 2000 to 2014 comparing pre- and post-Global Financial Crisis. In this sense, our sample period is relatively large and comprehensive compared to earlier studies in relevant literature. For instance, Dunn, Intintoli and McNutt (2015) examined non-government assisted US commercial bank merger activity prior to and during the Global Financial Crisis covering only the period of 2004 to 2010. Thus, our study complements the previous research.
For the full 2000-2014 sample period, our analysis reveals that using 3-day (-1,+1) event window, the abnormal returns to target banks are positive (23.64%) with 1% significance level, the returns to bidder banks are negative (-1,24%) with 5% significance level and the combined CARs are positive (2.42%) with 1% significance level, suggesting that even though the bidder shareholders seems to be penalized at the deal, the combined entities are able to create a significant positive value. Overall, our findings are in line with the rationale that bank mergers and acquisitions build stockholder value at the expense of bidder banks and the favor of target banks.
We also find strong evidence that means of financing in M&As deals is an important factor in determining merger premiums. Over the whole sample period, the average CARs to target banks are higher in ‘cash involved’-financed transactions than the average CARs to target banks in ‘common stock only’-financed transactions.
With respect to the geographic diversification, we have found evidence that geographically focused (instate) M&As achieved the highest CARs than interstate M&As before and after the Global Financial Analysis as well as for the whole sample period.
With respect to the relative size of target to bidder banks, our regression results indicate a negative correlation between the relative size and the CARs for targets and bidders, positive correlation between the relative size and the CARs for combined.
This paper is constructed as follows. The next section provides a review of the related literature about the M&A in banking space. The testable hypothesis is outlined in Section 3. Section 4 describes the data and sample selection process. The next section explains the empirical model and methodology. Empirical results are presented in section 6. Finally, the section 7 summarizes the findings and offer concluding remarks.
2. LITERATURE REVIEW
Many researchers and academicians have studied the announcement effects of M&A transactions in the U.S. Banking Industry over the last three decades, at the beginning of which, the consolidation in U.S. Banking Industry has also started.
2.1 Mergers and Acquisitions in Brief
M&As are considered to be a part of strategic management, corporate finance and corporate governance. M&As can be described as a type of restructuring of target and bidder firms in order to either create a new firm or merge under the bidder firm. In all circumstances, a new legal entity is being created following the merger. Deciding the transaction structure is important for both target and bidder firms and may be challenging as both firms usually have competing interests and different perspectives on the deal. In this respect, M&A transactions can practically be classified into five different categories in a way that the target firm is being acquired. These categories are merger agreement, tender offer, consolidation, management or leveraged buyouts and purchase of assets.
In a merger agreement, both target and bidder firms agree to merge and at the end of the transaction, target bank loses its existence and be a part of acquiring or bidder firm. In this method, the boards of directors of both firms initially agree to combine the firms and pursue the approval of the deal from the shareholders of both target and bidder firm. Usually, majorities (more than 50%) of shareholders of both firms approve the deal and merger takes place. The surviving entity or the bidder firm assumes all the assets, rights, and liabilities of the extinguished entity by operation of law.
In a tender offer, bidder firm bypassing the target firm management and the board of directors of the target firm offers to buy outstanding shares of target firm at a specified price and convey this offer directly to the shareholders of target firm through advertisements or mailings. This basically creates a hostile takeover. When the bidder firm buys enough shares to have the control of the firm this merger type usually is considered to be successful. As far
as the existence of target firm, target firm will exist until the minority shareholders of target firm agrees to sell their shares.
In a consolidation merger, both target and bidder firms agree to have the deal, however a new legal entity is being established after the merger and shareholders of both firms have secure stock in the new firm.
In management buyouts, a firm is being acquired by its own management or a group of private investors through usually a tender offer. This usually involves a long period of time as a hostile takeover can take many years. If managers are involved in this tender offer, this transaction is called management buyouts and if the deal value is mostly compensated by debt this transaction is called leveraged buyouts.
In a purchase of assets deal, bidder firm acquires the assets of target firm. This can be done by the approval of the target firm’s shareholders. This deal type is usually utilized when the bidder or the buyer is looking to acquire one division or business unit within a company. It can be complicated and time-consuming should a bidder firm intends to purchase 100% of target firm’s assets.
2.2 Motivations on Mergers and Acquisitions
The literature posits many factors that motivate bank mergers and acquisitions. According to the finance literature, the primary motivation for consolidation by the bidder firms is to maximize the firm value -shareholder value. However, not all the motives are for value maximization as managers and government can play significant role behind mergers and acquisitions. The key motivations for the mergers and acquisitions can be classified as to increase market share and power; Kim and Singal (1993), improve efficiency in costs, operations or profits; McGuckin and Nguyen (1995), create operational synergy (Scale and scope of economy); Trautwein (1990), Yagil (1996), Becher (2000), Houston, James and Ryngaert (2001), DeLong (2003), expand geographically, reduce operating and transaction costs; Williamson (1985), King, Slotegraaf and Kesner (2008), enhance the management of resource dependency; Casciaro and Piskorski (2005) and Pfeffer (1972), diversify risk,
advantage on tax, management self-interest; Agrawal and Walkling (1994) and Sanders (2001), deregulation and laws, prior acquisition experience; Meyer and Thaijongrak (2012), technological progress, exploit inefficiencies by sharing superior managerial skills between bidder and target firms; Focarelli et al. (2002), cross-selling, resource transfer, vertical integration and globalization.
Economic theory assumes that increased market power as a result of reduced competition can be a good source of post-merger gains as increased market power can affect the prices in favor of the combined firm. Antitrust law in the U.S. is a combination of federal and state government laws, which promotes fair competition for the benefit of consumers. Despite the fact that antitrust policies in the U.S. are laid out to discourage mergers with substantial anticompetitive effects, high concentration in certain geographic markets can still generate market power, allowing banks to earn considerable monopolistic benefits. Should there are technological and regulatory barriers to entry to the industry, banks in a monopolistic market may offer lower deposit rates and charge higher loan rates to the customers.
Synergy takes place when the combined firm is greater than sum of both target and bidder firms’ parts. In a nutshell, if the combined entity after the M&A becomes larger than the sum of the bidder and the target firm/bank, a synergy exists. In terms of math it could be represented as if “1+1>2” happens a synergy exists. Both “economies of scale” and “economies of scope” are the two legs of operating synergy. Gains in efficiency can come from either factor or improved managerial practices. Empirical studies such as Houston, James, & Ryngaert (2001, Delong (2003) suggest that such synergies are important sources of shareholders’ wealth creation. With the synergy stemming from an M&A, the combined firm can decrease its fixed costs by eliminating duplicate departments or operations, combine them into one building, lowering the costs of the company relative to the same revenue stream, thus increasing profit margins.
According to DePamphilis (2010), while “economies of scale have to do with the spreading of fixed costs over increasing production levels. Scale is defined by such fixed costs as depreciation of equipment and amortization of capitalized software; normal maintenance spending; obligations, such as interest expense, lease payments, and union, customer, and vendor contracts; and taxes. Such costs are fixed in the sense that they cannot be altered in
the short run. Consequently, for a given scale or amount of fixed expenses, the dollar value of fixed expenses per dollar of revenue decreases as output and sales increase”, “economies of scope have to do with using a specific set of skills or an asset currently employed in producing a specific product or service to produce related products or services. They are most often found when it is cheaper to combine two or more product lines in one firm than to produce them in separate firms” (p.7).
Financial synergy has to do with the cost of capital of the bidder firm or the newly formed (combined) firm resulting from a merger or acquisition. In theory, new cost of capital should be reduced by mergers and acquisitions. In practice, however, this expectation may vary depending on the success of mergers and acquisitions. Good management can negotiate better in terms of debt financing and as a result, the combined firm can reduce its weighted average cost of capital (WACC) significantly. Liquidity position of the target firm is the main motivator for some bidders in order to gain access to the funds. For instance, if the bidder has high financial leverage (high level of debt) thereby making access to additional external debt financing very limited, acquiring or merge with a target firm with a healthy liquidity position along with low or non-existent financial leverage can be a good motivation source for the bidder firm or bank.
Diversification has to do with bidding firm’s intention to diversify its product line or primary line of business. Through diversification, acquirer firm can either reduce the cost of capital or shift its core product lines into the product lines or markets that have higher growth expectations.
Haleblian, Kim, & Rajagopalan (2006) found that previous M&A experience, recent M&A performance, and the interaction between previous M&A experience and recent M&A performance are all positively related to the likelihood of subsequent acquisition.
2.3 Wealth Effects of Mergers and Acquisitions
Wealth effect of M&As on target and bidder banks has been investigated in depth by various studies over the last four decades.
Most of the researchers have found significant positive returns to the target banks such as in the studies of Jensen and Ruback (1983), Desai and Stover (1985), James and Weir (1987), Neely (1987), Trifts and Scanlon (1987), Wall and Gup (1989), Hawavini and Swary (1990), Cornett and De (1991), Cornett and Tehranian (1992), Houston and Ryngaert (1994), Madura and Wiant (1994), Zhang (1995), Hudgins and Seifert (1996), Pilloff (1996), Siems (1996), Esty, Narasimhan, and Tufano (1999), Becher (2000), Andrade et al. (2001), Delong (2001), Hart and Apilado (2002), Delong and DeYoung (2004), and Asimakopoulos and Athanasoglou (2013).
Many research in M&A space including banking industry revealed that bidder firms have
negative abnormal returns following the transaction. Hawavini and Swary (1990),
Aggrawal, Jajje, Gershon, and Mandelker (1992), Baradwaj, Dubofsky, and Fraser (1992), Cornett and Tehranian (1992), Holdren, Bowers, and Mason (1994), Madura and Wiant (1994), Palia (1994), Houston and Ryngaert (1994), Pilloff (1996), Siems (1996), Loughran and Vijh (1997), Subrahmanyam, Rangan, and Rosenstein (1997), Rau and Vermaelen (1998), Esty, Narasimhan, and Tufano (1999), Delong (2001), Amilhud, Delong, and Saunders (2002), Fuller, Netter, and Mike (2002), Delong and DeYoung (2004), Moeller, Schlingemann, and Stulz (2005) found in their respective studies that bidder banks had
negative abnormal returns.
A few studies found positive abnormal returns for bidders, Desai and Stover (1985), James and Weir (1987), Neely (1987), Cornett and De (1991) and Becher (2008) or no significant
abnormal returns Trifts and Scanlon (1987), Allen and Cebenoyan (1991), Holdren,
Bowers, and Mason (1994), Becher (2000), Hart and Apilado (2002).
Some studies found positive abnormal returns for combined; Becher (2000), Houston, James, and Ryngaert (2001), Anderson, Becher, and Campbell (2004), Zhang (1995), Hart
and Apilado (2002), Dodd and Ruback (1977), Bradley (1980), Kolaric and Schiereck (2013).
Jensen and Ruback (1983) concluded that corporate takeovers result positive yields, from which shareholders of target firm gain and shareholders of bidding firm do not lose.
Neely (1987) studied 29 U.S. mergers for the 1979-1985 periods and found 36.22% positive abnormal return for target firms. Trifts and Scanlon (1987) investigated 21 U.S. M&As for the period of 1982-1985 and found average losses of 3.25% for bidders and average gains of 21.4% for targets.
Cornett and De (1991a) studied 189 U.S. Banks (152 Bidders and 37 Targets) during the period of 1982-1986 and found average loss of 0.44% for bidders and gains of 9.76% for targets.
Houston and Ryngaert (1994) analyzed 153 bank mergers over the period of 1985–1991. Of the announced mergers, 131 were completed and 22 were not. Over a 5-day event window period, 131 completed mergers result cumulative abnormal returns of –2.25%, 14.77% and 0.46% for bidder banks, target banks and combined, respectively. Over a 5-day event window period, 22 uncompleted/cancelled mergers result cumulative abnormal returns of – 2.93%, 9.79% and 0.43% for bidder banks, target banks and combined, respectively. Over a 5-day event window period, 153 all mergers results cumulative abnormal returns of –2.32%, 14.39% and 0.38% for bidder banks, target banks and combined, respectively.
Later study by Houston and Ryngaert (1997), using 209 mergers over the period of 1985– 1992, in a 6-day (-4, +1) event-window period, found 0.24% and 20.4% for bidder and target cumulative abnormal returns, respectively.
Becher (2000) analyzed 558 U.S. bank mergers over the period 1980–1997. He found that target banks enjoyed positive returns. According to Becher (2000), bank mergers posit synergistic gains and mergers in this industry do not take place just to create empires for chief executive officers (CEOs). Over a 36-day (-30, +5) event window, cumulative abnormal returns are 22.64%, -0.10% and 3.03% for target banks, bidder banks and
combined, respectively. Over an 11-day (-5, +5) event window, cumulative abnormal returns are 17.10%, -1.08% and 1.80% for target banks, bidder banks and combined, respectively.
Asimakopoulos and Athanasoglou (2013) examined the impact of announced M&As on banks' stock prices by utilizing a standard event study analysis for a sample of European banks for a period of 15 years (1990-2004). They found that overall, an M&A announcement does not create value for the shareholders of bidders as opposed to the positive and significant value creation for the shareholders of the targets.
Neely (1987) studied 29 U.S. Bank merger transactions for the 1979-1985 periods and found 3.12% average gains but not statistically significant for bidder banks.
2.4 Method of Payments
In the event of a merger or acquisition, the payment method is usually conducted in the form of cash, debt, equity or some combination of the first three methods. In this study, we get to test different methods of payments in order to determine which type creates value or not. Previous literature shows that market participants generally prefer cash financed deals. However, with deepening financial markets and global connectivity, usage of hybrid financing in M&A space has been extended significantly.
Cash is commonly utilized in mergers and acquisitions transactions as well as asset purchase in the industry. According to Faccio and Marsulis (2005), a bidder may prefer to utilize cash rather than issue voting shares if the voting control of its dominant shareholder is intimidated as a result of the issuance of voting stock to acquire the target firm. Faccio and Lang (2002) reveals that on average, the percentage of cash usage in mergers and acquisitions is much higher in western European countries, where ownership tends to be more heavily concentrated in publicly traded firms than in the United States. In Europe, 63 percent of publicly traded firms have a single shareholder who directly or indirectly controls 20 percent or more of the voting shares; in the United States, the figure is only 28 percent.
Travlos (1987) studies the role of the method of payment in explaining common stock returns of bidding firms at the announcement of takeover bids. He found that significant differences exist in the abnormal returns between common stock exchanges and cash offers. The results on the pure stock bidding firms show that their stockholders experience significant losses at the announcement of the takeover proposal. On the other hand, the results on the cash-financing bidding firms show that their stockholders earn "normal" rates of return at the announcement period.
Amihud, Lev, and Travlos (1990) test the proposition that ‘corporate control considerations motivate the means of investment financing - cash (and debt) or stock’. They conclude that in corporate mergers and acquisitions, as the managerial ownership fractions of the bidding firm increases, likelihood of cash financing in M&A transaction increases as well. They also observed that mergers and acquisitions made by the firms with low managerial ownership resulted negative CARs for the bidders, which utilized stock as a mean of financing.
According to “tax effects hypothesis”, shareholders of target firms prefer M&A payment in stock as M&A payment in cash generates a prompt tax burden for the stockholders of the target firm (bank); whereas, payment in stocks do not create an immediate tax liability as these stock payments become taxable only when they are sold. As a result, payment in stock is used financing M&As when the payment/premium or capital gain is large for the shareholder of target firm.
According to the “information asymmetries hypothesis”, should managers of acquirer firms (banks) have more insider information than average investors –this is valid for the most cases- about the value of their own firm, these managers will prefer payment in stock or cash as a means of finance to acquire the firm (bank) depending on the situation. In this context, if managers of the bidder firm believe their stock is overvalued they prefer payment in stock as a means of finance to acquire the firm (bank). However, investors usually recognize this circumstance and they inclined to pull the price of the bidder’s stock down by a strong sell off upon announcement of the merger or acquisition. On the other hand, if managers of the bidder firm believe their stock is undervalued they prefer cash as a means of finance to acquire the target firm (bank). Again in this case, investors usually recognize this situation and they tend to drive the price of the bidder’s stock up by buying it upon announcement of
the merger or acquisition. Zhang (1995) also argues that cash financed takeover may signal to the investors that the bidder’s equity is undervalued.
Fishman (1989) argues that cash payment in M&As is preferred to stock payment to finance a merger or acquisition when other buyer(s) bidding for the target firm. In this case, cash payment in transaction signals high valuation for the target firm and deters potential or existing competitors. Meanwhile, Fishman (1989) also states that stock payment has the potential to lead management of target firm to make an efficient accept or reject decision.
Of the sample data we have examined between 2000 and 2014, 154 M&As are cash involved transactions and 60 M&As are common stock only transactions in the means of financing the deals.
2.5 Geographic Market Expansion
According to Mishkin (1998), regulatory and technological changes allow banks to expand geographically and become larger. SNL data classifies Bank M&As in the U.S. as “in-market”, “market expansion”, and “partial overlap” according to geographic market expansion column. “In-market” M&A transaction mean that target and the bidder banks have already business in the same market. “Market expansion” M&A means that target and the bidder banks are not in the same market and entering into a new banking market. “Partial overlap” M&A means the transaction is a mix of market expansion and in-market10. In terms of our sample data, 64 out of 214 transactions are defined as “in-market”, 81 out of 214 are defined as “market expansion” and 69 out of 214 are defined as “partial overlap” M&A transaction by SNL data.
Another classification of SNL data is that if the target and the bidder are located in the same state it is called an instate/intrastate M&A (geographically focused), if not it is called interstate (geographically diversified) M&A.
Regarding the importance of geographic diversification or focus, earlier research suggest that instate/intrastate M&As in other words geographically focused M&As may be rewarded
more than interstate M&As in other words geographically diversified M&As by the capital markets mostly for operating synergy reasons such as the enhancement of management efficiency, reduction of overhead costs, maximization of market power and create more value through reduction of overinvestment or economies of scale and scope. (DeLong 2001)
From the regulation point of view, The Riegle-Neal Interstate Banking and Branching Efficiency Act of 1994, signed into law by President Clinton on September 29, eliminated most of the restrictions on interstate bank mergers and acquisitions and granted interstate branching possible for the first time in seventy years. With this Act, Bank Holding Companies (BHCs) have been able to acquire or merge with banks locating in any State in the U.S. as of September 29, 1995. This has first caused the potential pool of the target firms to increase, and then might led the possibility of increased number of unprofitable mergers.
In this study, we attempt to answer the question as to whether the target, bidder and combined abnormal returns are affected by geographically focusing (instate) versus geographically diversifying (interstate) mergers.
For the overall 2000–2014 period 56% of the M&As in our sample size are geographically focusing (instate) whereas 44% of the M&As are geographically diversifying (interstate). Results of our sample size are in line with the relevant literature (Delong 2001) that instate M&As realized the highest CARs in all three event windows for the whole sample period and before and after the Global Financial Crisis. However, during the Global Financial Crisis (2008-2009) period, diversifying (interstate) mergers realized higher CARs than focusing (instate) mergers.
3. TESTABLE HYPOTHESES
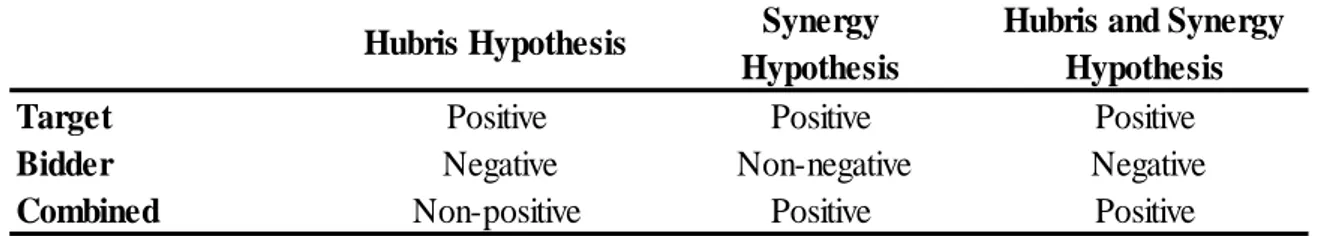
We test three alternative hypotheses explaining the possible reasons of mergers and acquisitions outlined in Becher (2000); the synergy hypothesis, the hubris or empire building hypothesis, and the combined synergy and hubris hypothesis.
According to the synergy hypothesis, CARs to target firms (banks) should be positive, CARs to bidder firms (banks) should be non-negative, and CARs to the combined should be positive. Meanwhile, according to the hubris or empire building hypothesis, CARs to target firms (banks) should be positive, CARs to bidder firms (banks) CARs should be negative, and CARs to the combined should be non-positive and should fall slightly.
In other words, while the synergy hypothesis states that mergers are wealth creating events, the hubris or empire building hypothesis states that mergers are not wealth creating events since the hubris or empire building hypothesis claims that M&As may be the result of hubris and empire building stemming from the managers of bidder firms, (Roll, 1986).
According to hubris or empire building hypothesis bidder firms (banks) overpay to acquire the target firm (banks) due to either bidder management suppose that synergies between target and bidder exist when in fact they do not exist or the management of bidder firm is self-driven to realize a merger or acquisition in order to build an empire rather than create a synergy. The hubris or empire building hypothesis would predict that, on average, CARs to target firms are positive, CARs to bidder firms are negative, and the CARs to the combined firm are non-positive or in other words M&As are not wealth creating events (Roll, 1986).
Table 1- Testable Hypotheses and Expected Effects of Bank Mergers and Acquisitions
Source: Becher (2000); The Valuation Effects of Bank Mergers
A third alternative hypothesis put forth by Becher (2000) is that mergers and acquisitions are a result of both the synergy and hubris hypotheses. According to this last hypothesis, CARs to the target and combined firm to be positive along with negative CARs for the bidder firms implying that positive synergies may be associated with an M&A transaction, however, bidder firms might overpay to obtain these synergies. The expected effects of these three hypotheses for target, bidder, and combined CARs are summarized in Table 1.
Synergy Hypothesis
Target Positive Positive Positive
Bidder Negative Non-negative Negative
Combined Non-positive Positive Positive
Hubris Hypothesis Hubris and Synergy Hypothesis
4. DATA STATISTICS AND SAMPLE SELECTION
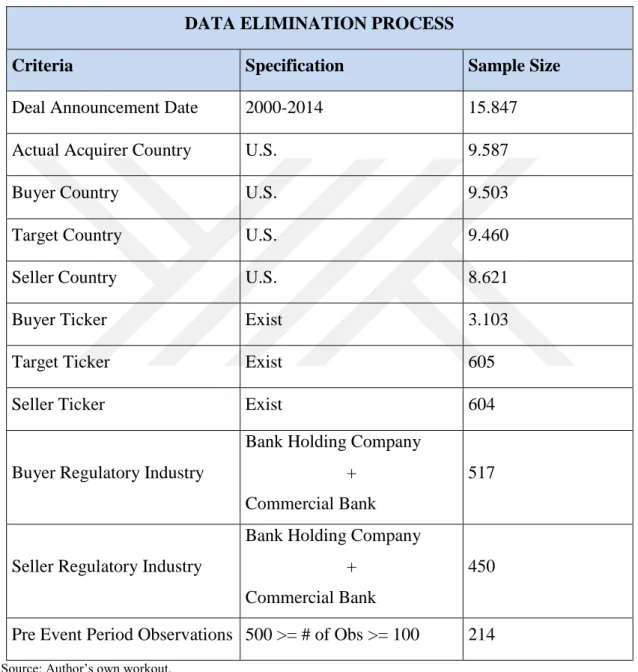
Initially, a global list of 15,847 bank M&A deals from 2000 to 2014 is retrieved from SNL Financial database. In SNL Financial data, there are four different country classifications; Actual Acquirer Country, Buyer Country, Target Country and Seller Country. After selecting U.S. based banks for all four classifications, our sample size is reduced to 8,622. A proper ticker for each bank needs to be at hand in order to get the daily stock return data from the Center for Research in Security Prices (CRSP) database. In SNL Financial data, there are three different ticker classifications; Buyer Ticker, Target Ticker and Seller Ticker. After including the firms with tickers for all three classifications in our data, our sample size dramatically comes down to 604. For the purpose of our analysis, only commercial banks and bank holding companies are included in the sample11. This reduced our sample size to 450.
We utilize CRSP database to obtain the return data of each security for 500 trading days. Another inclusion criterion being conducted for our sample data is that we have included the bidder and target banks having at least 100 observations in pre-event period available in the CRSP database to be able to estimate the market model parameters correctly. It is worth to notice that some research papers include the firms with less than 100 pre-announcement date returns in order to have larger sample size; however this may mislead to estimate the right market model parameters. For instance, Houston and Ryngaert (1994) did not include the returns with less than 75 days in the analysis. Brown and Warner (1985) also utilized the firms having at least 30 daily returns in their entire 250 day period. However, we prefer to use maximum 500 and minimum 100 daily returns in order to capture the right pattern of each security as to have the right market model. We also test our results by limiting our observations to maximum of 250 daily returns to estimate the market model and calculate the abnormal return for bidders, targets and combined however; we do not get any significant differences compared to 500 daily returns. As a result of this last criterion, our final sample
11 In SNL Financial Database, classifications of the banks in Regulatory Industry part are lined up as Bank Holding
Company, Commercial Bank, Credit Union, Edge Act Bank, Industrial Loan HC, L&H Insurance, Merchant Generator, Non-NAIC Insurance, Other Energy, P&C Insurance, Savings Bank, Savings Bank Holding Company, Savings Institution, Thrift Holding Company, Wholesale/Gen Trans,
size reduced to 214 bidder and target banks in the period of 2000-2014 which can be seen from Table 2.
Table 2- Data Elimination of Sample Size
DATA ELIMINATION PROCESS
Criteria Specification Sample Size
Deal Announcement Date 2000-2014 15.847
Actual Acquirer Country U.S. 9.587
Buyer Country U.S. 9.503
Target Country U.S. 9.460
Seller Country U.S. 8.621
Buyer Ticker Exist 3.103
Target Ticker Exist 605
Seller Ticker Exist 604
Buyer Regulatory Industry
Bank Holding Company +
Commercial Bank
517
Seller Regulatory Industry
Bank Holding Company +
Commercial Bank
450
Pre Event Period Observations 500 >= # of Obs >= 100 214 Source: Author’s own workout.
Out of 214 M&As, only 9 transactions can be classified as mergers of equals. According to Investopedia, merger of equals means two companies agree to “convert their respective stocks to those of the combined company. However, in practice, two companies will generally make an agreement for one company to buy the other company's common stock from the shareholders in exchange for its own common stock. In some rarer cases, cash or
some other form of payment is used to facilitate the transaction of equity. Usually the most common arrangements are stock-for-stock”12.
Daily stock price, daily stock return, shares outstanding, method of payment, geographic expansion, accounting method, region and state variables for each bank in our sample of 214 M&A transactions were collected and consolidated into one file to be analyzed.
According to Pilloff and Santomero (1998) selection bias stems from either including only major M&A deals in the sample or excluding the deals that banks had multiple mergers in the same year from the sample, or over a given time period. Because of these restrictions, important transactions that are most relevant to analysis of M&A deals might be omitted in the sample.
Since our sample selection does not specifically include or exclude M&A deals like abovementioned specifications, our analysis is not subject to such selection biases.
Table 3 presents summary statistics of our M&A bank sample used in the analysis. Table 3 exhibits year over year number of mergers and acquisitions, total market value of banks, mean value of targets, mean value of bidders and mean-to-target ratio from 2000 to 2014. Total number of M&A transactions for 15 years covered in this study is 214, which translates roughly 14 transactions per year. The highest number of transactions took place in the years of 2004, 2006 and 2007 with the numbers of 30, 27 and 28, respectively. The lowest number of M&A transactions took place in the years of 2000, 2001, 2002 and 2009 with the numbers of 2, 1, 1 and 2, respectively.
Our samples’ average target-to-bidder ratio is 30.52% according to annual averages and 15.64% according to 214 transactions’ averages, It is better to consider the average target-to-bidder ratio of 15.64% since it is the average of every M&A transaction for the whole period as some years have only one or two transactions and this can significantly increase or decrease the average number. This number means that from 2000 to 2014, on average market value of bidder bank is 6.39 times bigger than the value of target bank in our sample size.
Average target-to-bidder ratio out of 125 M&A transactions taking place in pre-crisis period (2000-2007) is 16.3% while average target-to-bidder ratio out of 74 M&A transactions taking place in post-crisis period (2010-2014) is 14.7% meaning that after the Global Financial Crisis, either bidder banks got bigger or target banks got smaller or both happened together.
Table 3- Summary Statistics of the Sample
Year M&As Total Value Mean Deal Value Target Mean Value Bidder Mean Value Mean target-to-bidder 2000 2 1,327,317 663,659 288,164 1,039,154 0.5955 2001 1 1,123,565 1,123,565 90,806 1,032,759 0.0879 2002 1 247,708 247,708 70,984 176,724 0.4017 2003 21 310,263,117 14,774,434 45,816,079 264,447,038 0.1906 2004 30 368,839,312 12,294,644 89,426,365 279,412,947 0.2918 2005 15 77,313,115 5,154,208 5,413,868 71,899,247 0.2438 2006 27 294,690,132 10,914,449 54,258,680 240,431,452 0.2611 2007 28 427,466,959 15,266,677 11,984,147 415,482,812 0.1799 2008 13 160,979,390 12,383,030 15,983,351 144,996,039 0.2840 2009 2 359,130 179,565 79,978 279,152 0.3552 2010 9 20,909,607 2,323,290 3,579,606 17,330,000 0.3272 2011 7 13,068,702 1,866,957 1,598,136 11,470,566 0.5505 2012 20 32,698,245 1,634,912 6,604,556 26,093,689 0.2219 2013 21 31,135,783 1,482,656 5,419,221 25,716,562 0.3767 2014 17 75,077,907 4,416,347 4,942,287 70,135,620 0.2097 All 214 1,815,499,989 8,483,645 245,556,229 1,569,943,760 0.3052
Value is computed by multiplying the stock price and the number of shares outstanding on the event date of the M&A. Values are in US$ thousands.
Table 4- Year Over Year US Bank M&A Sample Summary Statistics by Geographic Location
Year Instate Interstate
2000 1 1 2001 1 0 2002 1 0 2003 12 9 2004 15 15 2005 7 8 2006 16 11 2007 18 10 2008 8 5 2009 2 0 2010 6 3 2011 4 3 2012 8 12 2013 12 9 2014 9 8 Toplam 120 94
Source: Author’s own compilation.
After the Global Financial Crisis, target banks were smaller in size than before the Global Financial Crisis. This might be explained by either more troubled small banks were out in the market during and after the Global Financial Crisis to be acquired or “too big to fail” phenomenon in the U.S. financial markets led bidder banks to acquire or merge with smaller target banks. Another argument can be put forward that with the Global Financial Crisis levels of risk in the financial markets dramatically increased and this led the bidder banks to take lower risks by acquiring or merging with smaller target banks.
Our total sample of 214 M&A transactions total combined value is $US1.8 trillion. Total value of bidders and targets are $US1.57 trillion and $US245.6 billion respectively. The highest total values of the deals in 2007, 2004, 2003 and 2006 are the figures of $US 427.5 billion, $US368.9 billion, $US310.3 billion and $US294.7 billion, respectively.
Table 4 exhibits instate/intrastate and interstate data according to each year for the whole period being analyzed. As can be seen, in the years of 2001, 2002 and 2009 there is no interstate mergers in our sample data. The most balanced year in terms of allocation of M&As between instate/intrastate and interstate is 2004 in which 15 instate/intrastate and 15 interstate M&As took place.
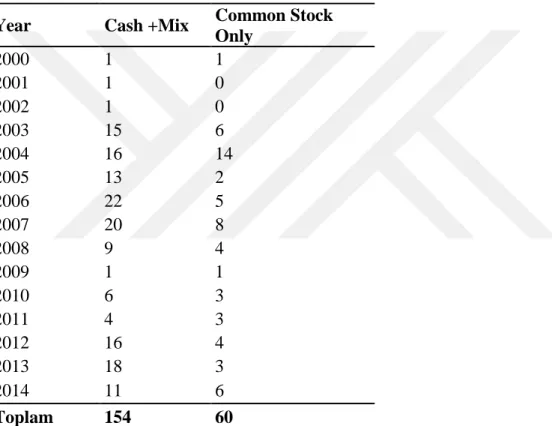
Table 5- Year Over Year US Bank M&A Sample Summary Statistics by Method of Payment
Year Cash +Mix Common Stock
Only 2000 1 1 2001 1 0 2002 1 0 2003 15 6 2004 16 14 2005 13 2 2006 22 5 2007 20 8 2008 9 4 2009 1 1 2010 6 3 2011 4 3 2012 16 4 2013 18 3 2014 11 6 Toplam 154 60
Source: Author’s own compilation.
Table 5 exhibits ‘cash +mix’ and ‘common stock only’ data in terms of financing the M&As according to each year for the whole period being analyzed. Table 22 in the appendix section provides total list of 214 M&A transactions including announcement date (or event date), bidder (or buyer) name, target (or seller) name, bidder shares outstanding, bidder price, market value of bidder, target shares outstanding, target price, market value of target, total market value and target to bidder ratio.
5. EMPIRICAL MODEL AND METHODOLOGY
5.1 Testing the Consolidation Effect
Most academic studies utilizes one of two approaches to estimate and evaluate the significance of merger-related gains, Rhoades (1994). The first method uses accounting data test pre- and post-merger performance of firms and determine whether an M&A leads to changes or creates any synergy in reported costs, revenues, operational incomes, cash flows or margins. This approach is pretty straightforward in a sense that accounting data is easily accessible and accounting performance can be directly measured and well understood by market participants and academicians. Advocates of this methodology claims to be more reliable than other subjective methods such as equity research because accounting data measure actual performance or the results, it does not measure investor expectations. However, this methodology has several drawbacks. Although actual performance is measured by accounting data, the data may be inaccurate in detecting the real market value as data are mostly not mark-to-market and often neglect current market values and the expectations embedded in the stock prices. In addition, tested effects between the pre- and post-merger period may not only be coming from merger or acquisition. In the same period investigated some other event may have taken place and these events may have triggered the change on the changes of target and bidder firms. In this case, such extraneous events not controlled in the analysis may lead to improper conclusions.
The second approach uses stock market data to analyze and evaluate the stock market reaction to merger announcements. Advocates of this approach argue that utilizing the market data rather than accounting figures the implied value of mergers and acquisitions can be more accurately measured. In other words, they argue that in an efficient market, the reaction is likely to be a better indicator of the real economic effects of the announced deal than accounting data, which is not reliable and takes long time to pricing in.
In second approach, most of the studies explore the abnormal returns of bidders and targets independently, however some studies analyze the total change in stockholder wealth as well. According to Pillof and Santomero (1998), the value-weighted sum of bidder and target
abnormal returns is the appropriate measure of total change in M&A deal. With this method, the value creation in mergers and acquisitions can be accurately quantified.
5.2 Event Study Methodology and the Model
In order to determine investors’ reaction to events such as the announcement of a merger or an earnings report “event study methodology” can be used. (Brown and Warner 1985). Event studies have a long history in terms of usage. Dolley (1933) studied nominal price changes at the time of stock splits and examined effects of stock splits on the stock price. From his study to 1960s, event study analysis has been sophisticated. Myers and Bakay (1948), Barker (1956, 1957, 1958), and John Ashley (1962) conducted event study analysis in their research. Event study methodology was first introduced with a methodology in a sense that is being used today by Fama, Fisher, Jensen, and Roll’s 1969 stock splits study, which has led event studies to become prevalent methodology in finance. Since then, event study methodology has been used frequently by the academicians to assess the effect of a particular event that has on the returns of a firm’s common stock price. In previous usage of event study methodologies, first the market model is estimated, and then the estimated market model’s parameters are used to determine the size and direction of the price changes. In an analysis of 88 empirical studies between 1970 and 2006, Zola and Meier (2008) identify 12 approaches to measuring the impact of mergers & acquisitions on shareholder value. Of these studies, 41 percent use the short-term event study methodology to analyze pre-merger returns, 19 percent use the long-term event study methodology to analyze post-merger financial performance, which makes the total event studies 60 percent. 28 percent of these studies utilize long-term accounting measures to analyze post-merger returns.
As already mentioned, the aim of this study is to analyze the shareholders' value creation of U.S. banks M&A deals before and after the Global Financial Crisis. For this reason, a standard “event study methodology” is utilized. We get to examine the value creation around the announcement of a bank merger and acquisition as outlined in Brown and Warner (1985). Brown and Warner (1985) extended their earlier work Brown and Warner (1980) in which they used monthly returns to examine event study methodologies. In our study, we get to use also daily stock returns to perform event study methodology. This methodology controls for