INFORMS is located in Maryland, USA
Management Science
Publication details, including instructions for authors and subscription information:
http://pubsonline.informs.org
The Impact of Discharge Decisions on Health Care Quality
Emre Berk, Kamran Moinzadeh,To cite this article:
Emre Berk, Kamran Moinzadeh, (1998) The Impact of Discharge Decisions on Health Care Quality. Management Science 44(3):400-415. https://doi.org/10.1287/mnsc.44.3.400
Full terms and conditions of use: https://pubsonline.informs.org/page/terms-and-conditions
This article may be used only for the purposes of research, teaching, and/or private study. Commercial use or systematic downloading (by robots or other automatic processes) is prohibited without explicit Publisher approval, unless otherwise noted. For more information, contact [email protected].
The Publisher does not warrant or guarantee the article’s accuracy, completeness, merchantability, fitness for a particular purpose, or non-infringement. Descriptions of, or references to, products or publications, or inclusion of an advertisement in this article, neither constitutes nor implies a guarantee, endorsement, or support of claims made of that product, publication, or service.
© 1998 INFORMS
Please scroll down for article—it is on subsequent pages
INFORMS is the largest professional society in the world for professionals in the fields of operations research, management science, and analytics.
Care Quality
Emre Berk j Kamran Moinzadeh
School of Business, Bilkent University, Ankara, Turkey
School of Business, University of Washington, Seattle, Washington 98195
I
n this paper, we present a normative study that describes the impact of discharging decisions in the face of resource shortages. We develop a model that represents the dynamics of a health care unit. Then, to capture the essence of discharge decisions, we consider discharge policies that incorporate both the occupancy level of the unit and the status of patients measured by their stage of recovery and the time they have spent in that stage. We believe that our model can be used as an aid to physicians and administrators to better assess discharge and/or capacity decisions. In addition, we investigate the impact of discharge decisions on the measures that represent the quality of care at a facility such as average hospital stays, system accessibility, and average complication risk of discharged patients. Our findings illustrate that inclusion of early discharge option improves system accessibility significantly and does not jeopardize care equity among patients. Furthermore, introduction of early discharge option has more pronounced ef-fects on increasing care unit capacity than addition of open beds with no early discharges. (Health Care Management; Discharge Policy; Capacity Analysis; Service Operations)1. Introduction
There is both anecdotal and clinical evidence that phy-sicians are often forced to make rationing decisions in the face of resource shortages and rising treatment costs. Rationing may be in the form of withdrawing care com-pletely from some potential patients (i.e., denying ad-mission to some arrivals) or releasing patients from the care unit after shorter stays. More than two decades ago, Rafferty (1971) observed that occupancy rates affected the case mix within a general medical hospital. Simi-larly, as early as in 1962, Hellman et al. (1962) noted that a shortage of beds could force clinicians to dis-charge patients after a shorter stay than was the ac-cepted norm.
Regional and national studies on average hospital stays indicate long-term trends toward decreasing lengths of stay in the U.S. in all fields of medical prac-tice (Epstein et al. 1991, Zuckerman and Holahan 1988, AHA 1990, DHHS 1985, and Eggers 1987). The decrease in average hospital stays is, surely, partly
due to the introduction of new treatment technologies and medication that result in faster recovery. How-ever, it is also due to the necessity of cost containment brought about by the increases in health care expen-ditures in the U.S. in the last three decades. The med-ical community is now expected to assess the merits of a particular treatment not only from a medical viewpoint but from an economic perspective as well (Eckholm 1993). The economic aspect of discharge de-cisions is, for instance, clear in the words of Madsen et al. (1983) explaining a physician’s rationale to dis-charge a (coronary) patient: ‘‘Ideally, a patient should be hospitalized only until the benefits of hospitaliza-tion no longer justify the expense. At some point the risk of complications requiring immediate detection and treatment will be so low that continued hospital-ization cannot be justified. Also, once this point has been reached, a patient is likely to benefit emotionally by returning to his family and physically by resuming his normal activities.’’
The recent adoption of flat fee payment arrangements in managed care has added to the existing monetary incentives for discharging patients after shorter stays. The vast medical literature on the timing of discharge has focused on the assessment of the costs of terminat-ing hospitalization measured as the risk of post-discharge complications and/or remission of the con-dition (e.g., Franklin and Jackson 1983 on unexpected readmissions, and Mulley et al. 1980 and McNeer et al. 1975 on feasibility of quicker discharge of myocardial infarcts), or the expressed discomfort or dissatisfaction of a patient with hospital stay after a perceived quick discharge (e.g., Blondel et al. 1983 and Rhodes 1994 on short post-partum stays with no medical risk). These studies assess the timing of discharge solely on the basis of an individual patient. However, the operational per-formance of the care unit as a whole, measured in terms of accessibility and occupancy rates or bed utilization levels, influences the discharge decisions as well.
Hellman et al. (1962) provide one of the earliest ex-amples of accelerated (early) discharge under conges-tion. In their study, a shortage of beds in a maternity ward forced clinicians to reduce the length of post-partum stays to admit new arrivals. Singer et al. (1983) found that in the presence of a nursing shortage and of the resulting drop in ‘‘open’’ bed capacity, physicians decreased patient admissions and reduced lengths of stay of those admitted in an intensive care unit. Later Strauss et al. (1986) demonstrated that such rationing is an everyday occurrence and physicians do indeed con-sider ‘‘open’’ bed utilization (congestion) levels when making admission and discharge decisions.1
Currently, the Joint Commission on Accreditation of Health Care Organizations mandates a written pol-icy for admission, transfer (early discharge) and dis-charge decisions ‘‘when patient load exceeds optimal
op-erational capacity’’ (JCAHCO 1992). However, at this
stage of development, the policy is directed toward ensuring that a senior medical officer is available at all times to function as a triage officer using his/her own the judgment. In recognition of the complexity of the legal and ethical aspects of such decisions,
spe-1Anecdotes of similar triages from nurseries and neonatal intensive
care units were communicated to us by Prof. Eric B. Larson, Director of the University of Washington Medical Center.
cial task forces have recently been organized to pro-vide guidelines (e.g., SCCM 1988, 1994) but specific rules are still lacking. Nonetheless, rapid processing of patients and accelerated discharge appear to be preferable to formal rationing (i.e., denying admis-sion) as utilization strategies for care units facing con-gestion (Kalb and Miller 1989, Teres 1993, Miller 1994, Larson 1996). The Von Stetina case also raises the po-tentiality of a legal obligation that patients who can be discharged to a ‘‘step-down’’ or intermediate care unit should be transferred to make room for the ade-quate treatment of a newcomer (Engelhardt and Rie 1986, Von Stetina v Florida Medical Center 1985). In summary, if the British experience is of any indica-tion, rationing decisions in the U.S. will be more com-mon due to scarcer resources with the adoption of universal health care coverage by policy makers (Evans 1983, Schwartz and Aaron 1984, Aaron and Schwartz 1984).
The contribution of this paper is twofold: First, we develop a model of a health care unit operating under a class of discharge policies, which considers both the occupancy level of the unit and the status of patients measured by their stage of recovery and the time they have spent in that stage. Second, we use our model to study the impact of discharge decisions on the quality of care and other operational performance measures. We illustrate this methodology via a numerical experi-ment with published medical data on patients treated in intensive care units for myocardial infarction. Our findings identify the conditions of the operating envi-ronment under which early discharge options may be effective. Discharge models are also particularly useful for obtaining data to support Certificates of Need for capacity decisions. Thus, we provide an analytical tool that may aid hospital administrators in their rightsizing efforts, as well.
The rest of the paper is organized as follows: In §2, we introduce the model, discuss the assumptions and the approaches to discharge decision making, and pro-pose our discharge policy. The differential equations that govern the behavior of the system are developed in §3. We obtain the operating characteristics and system performance measures in §4. In §5, we present our nu-merical study of the impact of early discharge options on operational performance. Finally, in §6, we
summa-rize our work, provide an extension to our model, and discuss future research.
2. The Model
We consider a single unit of a health care facility (e.g., a maternal ward or an intensive care unit) that can ac-commodate at most M patients at any given time. That is, the unit has M ‘‘open’’ beds due to either limited physical space/equipment or limited nursing/staffing resources. We assume that patients, from a homoge-neous population, arrive according to a Poisson process with a mean rate of l. The patient homogeneity is as-sumed in both patient profiles (e.g., age, gender) and illnesses diagnosed upon admission (e.g., single or mul-tiple organ failure).2Once admitted, the patients spend the entire care period in the unit.
In general, a patient’s stay at a care unit may be viewed as a series of phases, each corresponding to a discernible stage of recovery or treatment and with dis-tinct symptoms. The time that patients spend in each phase may vary due to the particulars of the individu-als, and patients may revisit (relapse into) some of the phases over the course of their stay at the care unit. One example is the recovery process of coronary patients as modeled in Thomas (1968) and Kao (1972).
In this paper, we model the patient’s stay at the care unit in two distinct stages: the critical (primary) stage denoted by Stage 1, and the noncritical (secondary) stage denoted by Stage 2 (see Figure 1). While in Stage 1, the patient receives acute care and has not yet shown satisfactory progress toward recovery (i.e., is unstable). After the patient emerges from Stage 1, s/he enters Stage 2, which indicates that the patient’s condition has stabilized physiologically and, possibly, in terms of nursing requirements. The time that a patient spends in Stage 1 is assumed to be random with a finite mean of 1/m and a complementary cumulative distribution function, G(·). Following Cox (1955), the infinitesimal transition rate to Stage 2 of a patient who has spent y time units in Stage 1 is, then, given as:
ÌG(y)/Ìy
a(y) Å 0 . (1)
G(y)
2
In §6, we present an extension that relaxes this assumption and al-lows for a heterogeneous patient population.
The patient remains in Stage 2 for some time and leaves according to the discharge policy described below. While in Stage 2, the patient may develop complications and relapse into Stage 1. We define the instantaneous rate of relapse into Stage 1 after the patient has been in Stage 2 for y time units as:
ÌF(y)/Ìy
g(y) Å 0 , (2)
F(y)
where F(y) is the probability that the patient has not relapsed after spending y time units in Stage 2. We as-sume that the probability distributions of subsequent stays of relapsed patients are identical to those of new-comers.
A few comments are in order here: First, note that Stages 1 and 2 defined above may, in fact, be ‘‘meta-stages’’ consisting of several stages within themselves. Therefore, a multiple-stage model can be reduced to the two-stage model herein by an appropriate classification of the stages in which the patient is either stable or un-stable. In that case, all the stages in which the patient is considered unstable correspond to Stage 1 and the rest of the stages constitute Stage 2. Second, recall that dur-ing both stages of a patient’s stay, s/he is assumed to occupy one ‘‘open’’ bed in the care unit. We assume that service resource consumption of the patient is uniform during the entire length of stay. In an intensive care unit, this would mean that a constant nurse:patient ratio is maintained throughout. In practice, this ratio is de-creasing over service time for most cases, so that a single nurse may attend three or four patients who have dem-onstrated some recovery, whereas a strict one-to-one ra-tio is required for newcomers (Cullen 1977). In these instances, our model provides a conservative lower bound on the operational performance of a real unit. It is also a reasonable approximation to such a system to the extent that an average resource consumption per pa-tient may be assumed while in service. Finally, since service requirements for both stages are assumed uni-form, a patient’s stay may not be reduced by increasing the amount of resources (attending physicians, nurses, etc.) allocated to this patient.3
3The queuing systems with dynamic resource constraints appear to
be particularly difficult. We are not aware of any analytical models with varying resource consumption and multiple servers.
Figure 1 A Schematic Representation of the Recovery Path of a Patient
Next, we provide a brief discussion on the approaches to discharge decision making and then describe our dis-charge policy. In general, disdis-charge and transfer deci-sions are always made in accordance with the particu-lars of the patient and the illness. Thus, it is neither fea-sible nor practical to prescribe a generic policy. However, certain common approaches to discharge de-cision making under congestion emerge from the few studies on care unit capacity and discharge policies.
Shear et al. (1988) discuss a discharge/transfer prac-tice at an ICU in which intensivists rank patients into classes from ‘‘least able to leave, Not Eligible for Dis-charge (NED), Potentially Triagable (PT), Triagable (T), ready to leave the ICU, Dischargable (D).’’ Schwartz and Cullen (1981) report a similar daily discharge/ transfer assessment practice for an ICU based on Ther-apeutic Intervention Scoring System (Cullen 1977). In these studies, discharge decisions are made on the basis of the stages of recovery identified with the presence of certain symptoms. Patients who are not in particular stages of recovery (that is, not exhibiting certain desir-able symptoms) cannot be discharged under any cir-cumstances (e.g., coronary patients who do not exhibit regular breathing). Also certain treatment regimes that require that drugs, such as arrythmia medication, be ad-ministered under supervision can be viewed as a sep-arate phase of treatment during which patients may not be discharged. In the presence of certain symptoms, however, patients may be either discharged electively or nonelectively (triaged to a step-down care unit) with some risk of complications in order to make room for the incoming patients.
Williams (1983) provides an example of another ap-proach, where discharge/transfer decisions are based on the time that each patient has spent in the care unit. In this simulation study to mimic the workings of a cardiac ICU, ‘‘if all beds were full, less severely ill patients were discharged prematurely to a general medical service to make space for new admissions.’’ If there was no room in the care unit, the expected remaining length of stay was calculated for each pa-tient in the unit based on the actual duration of stay from the unit’s log. ‘‘Under the assumption that the patient whose planned stay was shortest also was best able to tolerate early discharge and that the patient who had been determined to need admission might benefit more from the unit, the program then dis-charged patients with the shortest remaining days un-til all new admissions could enter the unit. Usually, patients one day or less than one day stay remaining were discharged. This and all other features of the program were designed to replicate as closely as pos-sible the actual decisions made by the physicians.’’ Admittedly, perfect modeling could not be done since, in practice, particulars of individual patients were also taken into account. However, comparison with the hospital’s monthly census report and the model’s predictions yielded a close approximation.
Such discharge/triage policies based on the length of
stay are most appropriate when the patient follows a
predictable course of recovery; that is, when the pa-tient’s progress is highly correlated with length of stay. For example, recovery processes of patients after sur-gical procedures or of those with single organ failures
are well-documented instances of such predictable courses of recovery. Moreover, the risk of complications usually decreases for these patients with the time they have spent at the care unit after the onset of desirable symptoms. Madsen et al. (1983) even claim that ‘‘the only reasonable basis for deciding the appropriate dis-charge time is estimation of the risk of death and severe complications for the individual [coronary] patient. Several previous studies have shown the feasibility of this approach.’’4
In this paper, we propose a hybrid discharge policy that considers the status of patients (in terms of both the stage of recovery of the patients and the time they have spent in that stage) and the occupancy level of the care unit (in terms of the number of patients in the unit). We define the state of the system at time t as zk,n(t) Å (t, y1, . . . , yk; x1, . . . , xn), where k is the number of beds oc-cupied by the patients in Stage 1 and yidenotes the time since the ith patient has last entered Stage 1 (the length of stay in Stage 1) prior to t. Similarly, n is the number of beds occupied by the patients in Stage 2 and xi de-notes the time since the ith patient has last entered Stage 2 (the length of stay in Stage 2) prior to t. The discharge policy can now be formally stated:
A patient is discharged, if (i) there are currently n /k (°M) patients in the system and the patient’s length
of stay in Stage 2 has reached T; (ii) there are currently M patients in the system and the patient has stayed in Stage 2 for longer than T* and a new patient arrives, where T* °T.
Under this policy, patients in Stage 1 are classified as not eligible for discharge given the instability of their condition. Once a patient enters Stage 2, s/he is classified as potentially triagable to a step-down care unit, indicating that the patient has shown recovery but still needs the level of care that can only be pro-vided at this care unit.5The patient becomes triagable
4Recently developed administrative tools such as critical paths and
care maps already use the length of stay as a measure of patient’s recovery in these instances. As the third party payers adopt formal guidelines such as Milliman & Robertson standards, length of stay is being established as the basis for discharge decisions in an increasing number of illness categories (Walker 1995).
5
We assume that the time to discharge a patient is negligible. This assumption is reasonable in many situations. According to Aziz
after spending a certain amount of time, T*, in Stage 2. A triagable patient still benefits from the level of care provided at this unit, but can also be attended to at a step-down facility with a lower level of care. Therefore, a triagable patient would be transferred, if need be, to make room for a new patient who requires the level of care provided only at this care unit. All patients who have resided in Stage 2 for time T are classified as dischargeable. Henceforth, we shall refer to a patient’s exit under (i) as a ‘‘regular’’ discharge and to one under (ii) as an ‘‘early’’ discharge. We also assume that discharged patients join the infinite pool of all the potential patients. Therefore, all possible subsequent arrivals of discharged patients who de-velop complications are factored in the estimation of the mean arrival rate, l. This assumption, commonly used in modeling queuing systems, is made herein for analytical tractability.
We assume that 0 ° y1°y2° ··· °ykõ` and 0 °x1°x2° ··· °xn õT. With the lengths of stay in Stage 2 thus ordered, the discharge policy operates as only a function of the longest stay among the n patients in Stage 2. Furthermore, we assume that the system operates as a loss system; that is, new patients are denied admission and sent to another facility when all the beds are occupied (k / n Å M) and the longest stay of the patients in Stage 2 (if any) is less than T*.
Next, we will derive the stationary probability distribution of zk,n(t) and use that to obtain ex-pressions for the operating characteristics of the system.
3. Partial Differential Equations and
Their Boundary Conditions
In this section, we develop the system of partial differ-ential equations and their boundary conditions that de-scribe the state of the system. (See Cox 1955, Gnedenko and Kovalenko 1968, Schmidt and Nahmias 1985, and Moinzadeh 1989 for a detailed discussion of the tech-niques employed.) Let pk,n(t, y1, . . . , yk; x1, . . . , xn)
de-(1996), ‘‘a patient can be discharged from the CCU within 10 to 20 minutes if s/he is not on intravenous drugs and there is a bed available on the regular ward or telemetry ward.’’
note the probability density of zk,n(t). For ease of expo-sition, we define: b (·) Å 0 if b õ a and
∑
iÅa b (·) Å 1 if b õ a.∏
iÅaCase 1. 0 ° n / k õ M. For k ú 0, we have y1ú0, and for n ú 0, we have x1ú0 and xnõT. Let h ú 0 be a small number. Then
p (t / h, y / h, . . . , y / h; x / h, . . . , x / h)k,n 1 k 1 n k n Å(1 0 lh)
S
∏
[1 0 a(y )h]iDS
∏
[1 0 g(x )h]iD
iÅ1 iÅ1 ·H
p (t, y , . . . , y ; x , . . . , x )k,n 1 k 1 n T /*
(1 0 g(j)h)pk,n/1(t, y , . . . , y ;1 k T0h x , . . . , x , j)dj / o(h).1 nJ
(3) The state zk,n can be reached at time t / h either if (i) there is no arrival of a new patient, no transi-tion of a patient in Stage 1 to Stage 2 in (t, t / h), and no remission of a patient from Stage 2 to Stage 1 during the time interval (t, t / h) or (ii) a patient in Stage 2 has been discharged after having spent T time units in that stage and no arrivals or transitions from Stage 1 to Stage 2 or vice versa occurs in (t, t / h). Note that, the probability of an arrival of a patient in (t, t /h) is lh to the first order in h. Furthermore, if a patient
has been in Stage 1 for yitime units at time t, the prob-ability that the patient will proceed into Stage 2 in the interval (t, t / h) is a(yi) to the first order in h. Similarly, the probability that the patient who has spent xi time units in Stage 2 at time t will develop complications and remit back to Stage 1 in the interval (t, t / h) is g(xi) to the first order in h. Using the integral mean value the-orem, adding and subtracting terms, dividing both sides
by h, and letting h r 0 (see Moinzadeh 1989), at steady state we obtain k n Ìpk,n Ìpk,n /
∑
∑
Ìyi Ìxi iÅ1 iÅ1 k n Å 0 l /F
∑
a(y ) /i∑
g(x )iG
iÅ1 iÅ1 ·p (y , . . . , y ; x , . . . , x )k,n 1 k 1 n /pk,n/1(y , . . . , y ; x , . . . , x , T),1 k 1 n (4) where pk,n(y1, . . . , yk; x1, . . . , xn) is the steady state prob-ability density of zk,n.Case 2. n / k Å M, n ¢ 1, x1 ú 0 and T* ° xn õT. For k ú 0, we have y1ú0. This case is similar to Case 1 except that there cannot be a discharge of a patient in Stage 2 during the interval (t, t / h) since all beds are occupied at time (t / h) and hence, at steady state, k n Ìpk,n Ìpk,n /
∑
∑
Ìyi Ìxi iÅ1 iÅ1 k n Å 0 l /F
∑
a(y ) /i∑
g(x )iG
iÅ1 iÅ1 · p (y , . . . , y ; x , . . . , x ).k,n 1 k 1 n (5)Case 3. n / k Å M. For k ú 0, we have y1ú0, and for n ú 0, we have x1 ú 0 and xn õ T*. This case is similar to Case 2 except that if an arrival of a new patient were to occur in (t, t / h), the new patient would not be admitted, since:
(i) if n ú 0, then xnõ T* implies that all beds are occupied and the oldest patient in Stage 2 has stayed in that stage for less than T* time units and, therefore, is not dischargeable.
(ii) if n Å 0 and k Å M, then the system is full and all patients are in Stage 1 and, thus, are not dischargeable.
At steady state, k n Ìpk,n Ìpk,n /
∑
∑
Ìyi Ìxi iÅ1 iÅ1 k n Å 0F
∑
a(y ) /i∑
g(x )iG
iÅ1 iÅ1 · p (y , . . . , y ; x , . . . , x ).k,n 1 k 1 n (6)The boundary conditions for the above system of par-tial differenpar-tial equations are found by considering the discontinuities in the motion of the state of the system caused either by (a) the admission of a new patient or a remission of a patient from Stage 2 to Stage 1, or (b) a transition of a patient from Stage 1 to Stage 2. Thus, the boundary conditions can be ex-pressed as: (a.1) For k / n õ M, k ¢ 1, p (0, y , . . . , yk,n 1 k01; x , . . . , x )1 n Å lpk01,n(y , . . . , y1 k01; x , . . . , x )1 n n xi/1 /
∑
*
g(j)pk01,n/1(y , . . . , y ;1 k xi iÅ0 x , . . . , j, . . . , x )dj.1 n (7) (a.2) For k / n Å M, k ¢ 1, p (0, y , . . . , yk,n 1 k01; x , . . . , x )1 n Å lpk01,n(y , . . . , y1 k01; x , . . . , x )1 n T / l*
pk01,n/1(y , . . . , y1 k01; x , . . . , x , j)dj1 n T=Úxn n xi/1 /∑
*
g(j)pk01,n/1(y , . . . , y ;1 k xi iÅ0 x , . . . , j, . . . , x )dj,1 n (8) where x0Å0 and xn/1ÅT, by definition.(b) For k / n ° M, n ¢ 1, pk,n/1(y , . . . , y ; 0, x , . . . , x )1 k 1 n k yi/1 Å
∑
*
a(j)pk/1,n(y , . . . , j, . . . , y ; x , . . . , x )dj1 k 1 n yi iÅ0 (9) and, y0Å0 and yk/1Å`, by definition.4. Operating Characteristics of the
System
It can be verified that the above partial differential equa-tions have the following solution:
p (y, x)k,n Ku (y, x) exp{0lT}k,n for k / n õ M, n ¢ 0, Kuk,n(y, x) exp{0lx }n Å for T* ° x õ T and k / n Å M, n ú 0,n Ku (y, x) exp{0lTk,n *} for x ° Tn * and k / n Å M, n ¢ 0, (10) where p (y, x) Å p (y , . . . , y ; x , . . . , x ),k,n k,n 1 k 1 n n k k/n l uk,n(y, x) Å
H J
∏
F(x )i∏
G(y ),i F(T) iÅ1 iÅ1and K is found by the requirement that the density in-tegrate to unity and is shown in the appendix to be:
l 1 K Å F M,
H F
S
/L(T)DG
exp(0lT) F(T) m T l 1 01 / l*
fF
M,S
/L(x)DG
exp(0lx)dxJ
F(T) m T= (11) where x i m f(i, m) Å , F(x, m) Å∑
f(i, m) i! iÅ0 and x L(x) Å*
F(h)dh. 0Before we develop the expressions for performance measures, we introduce some notation. Let:
r(t): probability that a patient who has spent t time
units in Stage 2 develops complication after release,
E(t): average length of stay of a patient,
E(N): expected number of beds occupied by patients
in the care unit,
E(Nd): expected number of patients who are denied admission per time unit,
E(Nc): expected number of patients released per unit time who will have complications.
It is shown in the appendix that:
l 1 E(N ) Å lKf M,d
F
S
/L(T*)DG
exp(0lT*), F(T) m (12) E(N )c l 1 Å lKr(T)F M 0 1,H
S
/L(T)DJ
exp(0lT) F(T) m T l / lKS D
*
r(j)F(j) F(T) T= l 1 1 fF
M 0 1,S
/L(j)DG
exp(0lj)dj, F(T) m (13) and E(N) l 1 ÅM 0 K exp(0lT) MF M,H F
S
/L(T)DG
F(T) m l 1 0S
/L(T)D
F(T) m l 1 1 FF
M 0 1,S
/L(T)DGJ
. F(T) m (14)Employing the Little’s law and using (11), we can write the average length of stay of a patient as:
E(t) E(N) Å , l 1 l
H F
1 0 Kf M,S
/L(T*)DG
exp(0lT*)J
F(T) m (15) where the denominator of (15) is the average number of patients admitted per time unit (l 0 E(Nd)).The quality of care is usually assessed by the follow-ing operatfollow-ing performance measures:
(i) Average length of stay, E(t). This measure serves as proxy for the cost of hospitalization and is given by (11). Traditionally, it has been used for all treatment types and has been criticized by some for resulting in
gross miscalculations if the use of resources and/or the content of resources change over the period of hospi-talization; however, for treatments that are performed within a single unit as in the case of coronary patients, it is a reliable cost proxy.
(ii) System accessibility, f. This is measured by the fraction of arriving patients who are actually admitted. When the discharge policies are based solely on a fixed period of hospitalization, that is, when there are no early discharges, the accessibility is given by the per-centage of time when all beds are occupied. However, in the presence of early discharge options, the measure needs to take into account the percentage of time that all beds may be full but a patient may be discharged early, as well. This measure may be viewed as primarily a public policy concern, but administrators operating in environments where referrals to other contract facilities result in additional costs, as in an HMO environment, may also use this measure to contain costs due to out-side referrals. This measure is given by:
E(N )d l 1
f Å 1 0 Å1 0 Kf M,
F S
/L(T*)DG
l F(T) m
1exp(0lT*). (16)
(iii) Average complication risk of discharged patients, Rc. This measure indicates the quality of care that patients receive and the extent of additional costs to the systems for early release of the patients and has been the tradi-tional focus of medical research on discharge decisions and treatment procedures. It may also be viewed as the fraction of entering patients who will have complica-tions upon discharge. This measure is given by:
E(N )c
R Åc . (17)
l 0E(N )d
In the next section, we present our findings on the impact of discharge policies on the above measures of care quality.
5. Numerical Results
To realistically study the impact of discharge decisions on the quality of health care, we present our analysis through a numerical experiment that is based on pub-lished data. In our experiment we considered two dis-charge policies. Under Policy I, the disdis-charge decision
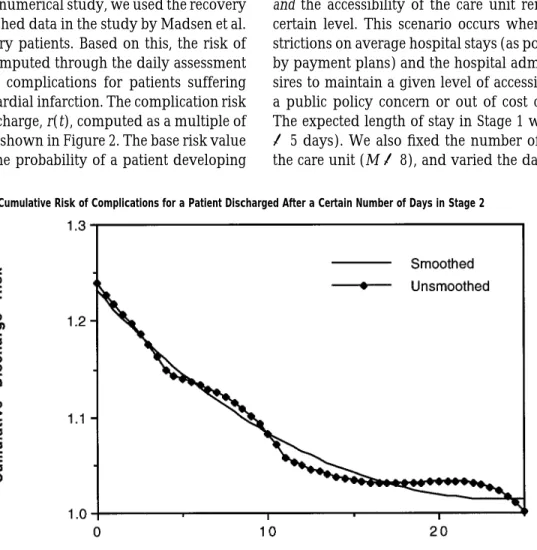
Figure 2 Graph of Cumulative Risk of Complications for a Patient Discharged After a Certain Number of Days in Stage 2 does not take into consideration bed utilization
(con-gestion) levels and all patients are discharged only after they have been hospitalized for a fixed period (i.e., no early discharges are allowed). This policy can be viewed as a single parameter policy, where T Å T*. Under Pol-icy II, however, the decision maker uses the information about the bed utilization (congestion) levels and the status of patients, and some patients may be discharged
earlier than others if new arrivals requiring beds occur.
This policy can be viewed as a two-parameter policy, where T* ° T.
We investigated the impact of these two policies on the performance of a care unit in a managed care setting with specified targets for expected lengths of stay and system accessibility. We also studied the possible effects of early discharges on capacity decisions for health care facilities. For our numerical study, we used the recovery model and published data in the study by Madsen et al. (1983) on coronary patients. Based on this, the risk of discharge was computed through the daily assessment of risk of severe complications for patients suffering from acute myocardial infarction. The complication risk on the day of discharge, r(t), computed as a multiple of base risk value is shown in Figure 2. The base risk value corresponds to the probability of a patient developing
complications long after hospitalization, for instance, 60 days. Thus, a patient discharged after a total hospital-ization of 11 days, for instance, is 1.13 times as likely to develop complications as a patient who has had 60 days of hospitalization. The details of the specification of the complication risk function are delegated to the appen-dix. In all of our computations, we conducted an ex-haustive linear search for the optimal discharge param-eters under each policy in time increments of 0.01 days over a possible total hospitalization period of 30 days. The results of our findings are summarized below.
First, we present our study on the effects of discharge policies on system performance measures. We consid-ered the minimization of the average discharge risk across all treated patients such that the average length of stay per patient does not exceed a prespecified cap
and the accessibility of the care unit remains above a
certain level. This scenario occurs when there are re-strictions on average hospital stays (as possibly dictated by payment plans) and the hospital administration de-sires to maintain a given level of accessibility either as a public policy concern or out of cost considerations. The expected length of stay in Stage 1 was fixed, (1/m Å5 days). We also fixed the number of open beds in the care unit (M Å 8), and varied the daily arrival rate
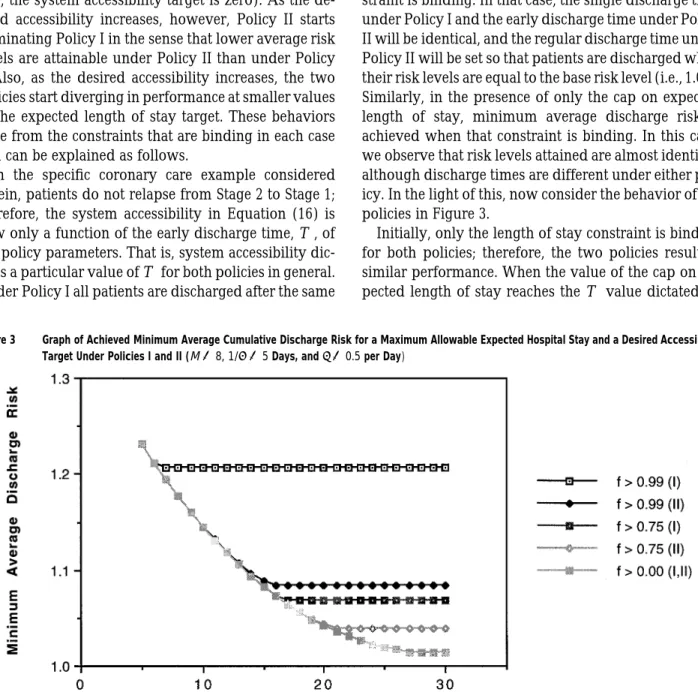
Figure 3 Graph of Achieved Minimum Average Cumulative Discharge Risk for a Maximum Allowable Expected Hospital Stay and a Desired Accessibility Target Under Policies I and II (M Å 8, 1/m Å 5 Days, and l Å 0.5 per Day)
(l Å 0.5, 0.8, 1.6, and 3.2), the system accessibility target (f ¢ 0, 0.50, 0.75, 0.90, 0.95, 0.98, and 0.99). The cap on the expected length of stay was varied between 5 and 30 days by daily increments. A representative sample of our findings is presented in Figure 3.
We observe that there is no difference between the performances of the two policies when the impact of the discharge policy on the system accessibility is ignored (i.e., the system accessibility target is zero). As the de-sired accessibility increases, however, Policy II starts dominating Policy I in the sense that lower average risk levels are attainable under Policy II than under Policy I. Also, as the desired accessibility increases, the two policies start diverging in performance at smaller values of the expected length of stay target. These behaviors arise from the constraints that are binding in each case and can be explained as follows.
In the specific coronary care example considered herein, patients do not relapse from Stage 2 to Stage 1; therefore, the system accessibility in Equation (16) is now only a function of the early discharge time, T*, of the policy parameters. That is, system accessibility dic-tates a particular value of T* for both policies in general. Under Policy I all patients are discharged after the same
length of stay (i.e., T Å T*) so that the accessibility target impacts all patients treated at the care unit. Under Pol-icy II, however, the accessibility target impacts only those patients that are triaged out of the care unit upon a new arrival, and the rest of the treated patients un-dergo regular discharge. Hence, in the presence of only the accessibility constraint, minimum average discharge risk can be achieved under either policy when the con-straint is binding. In that case, the single discharge time under Policy I and the early discharge time under Policy II will be identical, and the regular discharge time under Policy II will be set so that patients are discharged when their risk levels are equal to the base risk level (i.e., 1.00). Similarly, in the presence of only the cap on expected length of stay, minimum average discharge risk is achieved when that constraint is binding. In this case, we observe that risk levels attained are almost identical, although discharge times are different under either pol-icy. In the light of this, now consider the behavior of the policies in Figure 3.
Initially, only the length of stay constraint is binding for both policies; therefore, the two policies result in similar performance. When the value of the cap on ex-pected length of stay reaches the T* value dictated by
the accessibility constraint, the two policies start diverg-ing in performance. At this point, Policy II is bound by both constraints. However, Policy I is bound from this point on only by the accessibility constraint (hence, the flat portion of the Policy I curves). Gradually, as the value of the cap on expected length of stay gets larger, the regular discharge time T under Policy II gets larger as well. When T reaches the value where discharge risk level is the same as the base risk level (or, the maximum value allowed in our search, namely, 25 days), the ex-pected length of stay constraint is no longer binding. From this point on, Policy II is bound only by the ac-cessibility constraint (hence, the flat portion on the Pol-icy II curves).
The impact of the introduction of early discharge on system accessibility and attainable discharge risks has interesting managerial implications. A health care pro-vider can achieve a lower average discharge risk while maintaining an accessibility target by exercising the early discharge option. Conversely, s/he can achieve a higher system accessibility for a desired average dis-charge risk with the early disdis-charge option. The versa-tility of the two-parameter policy becomes all the more important in an HMO setting, where, in the case of an overload, the arriving patients need to be sent to a fa-cility outside the organization at an additional cost due to (tangible) transfer payments and (intangible) loss of customer goodwill. For moderate desired discharge risk levels, significant savings can be achieved by reducing the number of denied admissions through early dis-charge. For instance, in Figure 3, 1 percent of the arriv-ing patients is denied admission for a desired discharge risk level of about 1.09 with the early discharge option (under Policy II); however, when no early discharge is allowed (under Policy I), the same level of care is achievable at a cost of not admitting about 20 percent of the overall patients!
Lastly, we should mention that equity in treatment across patients is an equally important concern of phy-sicians and hospital administrators. When there is the option of an early discharge, a decision maker may also run the risk of having a large variation of care quality among treated patients even though the average figures may well be within target. To investigate this possibil-ity, we also computed the coefficient of variation of the cumulative risk for the discharged patients. Under
Pol-icy I, this coefficient is obviously zero, since all dis-charges occur after the same amount of hospitalization. In our numerical results, the coefficient of variation un-der Policy II for the cases presented in Figure 3 was observed to be less than 0.04, indicating that the early discharge option does not result in significant care in-equity. Therefore, we can conclude that especially for achieving high system accessibility targets, early dis-charge is an effective and attractive option.
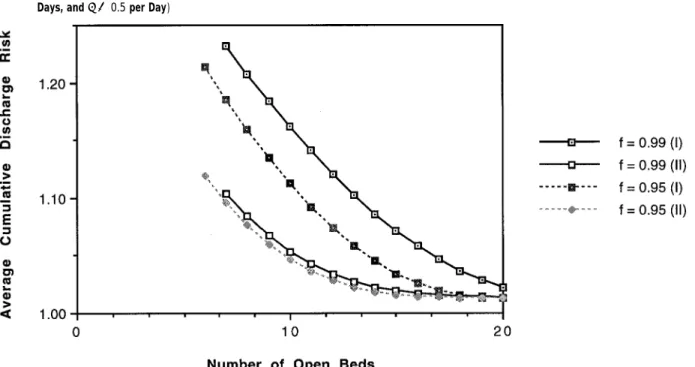
Next, we present our study of the impact of operating unit capacity on care quality level measured in terms of average discharge risk and system accessibility. For the above given system accessibility targets and daily arri-val rates, we now computed the minimum average dis-charge risk under both policies as we varied the number of open beds (M Å 2, 3, . . . , 20). The cap on the average length of stay was set at 30 days. Figure 4 illustrates our findings.
As the number of open beds, M, (i.e., the care unit capacity) increases, lower average discharge risk levels are achieved for a given accessibility target under both policies, as expected. At some low capacity levels, how-ever, the system becomes heavily loaded and the acces-sibility targets cannot be reached (e.g., f ¢ 0.99 when M õ7). Policy II always results in lower risk levels but the difference in performance between the policies dimin-ishes as the care unit capacity gets larger (i.e., the system is less heavily loaded) or when the accessibility target is reduced (as before in Figure 1). We observe that the impact of care unit capacity is larger under Policy I; that is, a larger reduction in average discharge risk levels is obtained with each additional bed under Policy I. This is demonstrated by the steepness of the Policy I curves in comparison with the Policy II curves, and is to be expected since Policy II results in considerably lower risk levels to begin with. We see here as well that Policy I is more sensitive to system accessibility targets. It should be noted that the above observations on the ef-fects of increased bed capacity also hold when arrival rate is reduced for a given bed size.
We see that for an accessibility target of 0.99, the av-erage discharge risk level achievable with a ward of seven open beds operating with the early discharge op-tion is achievable with 13 beds without the early dis-charge option. Similarly, a ward of 10 beds would be needed without the early discharge option to match the
Figure 4 Graph of Achieved Minimum Average Cumulative Discharge Risk for a Given Number of Beds and a Desired Accessibility Target (1/m Å 5
Days, andl Å 0.5 per Day)
care level of six beds with the early discharge option for an accessibility target of 0.95. For these two examples, the variability of care quality across treated patients un-der Policy II is also very small (coefficients of variation of discharge risk are less than 0.05). Therefore, the in-troduction of triage in the form of early discharge may indeed be more cost effective than expansion of care units, especially for high accessibility targets.
6. Conclusions
In this paper we developed a model for discharge pol-icies that uses the information about the bed utilization and the status of patients and adjusts the discharge times accordingly. We investigated the impact of dis-charge policies on the care quality in terms of average hospital stays, system accessibility, and average com-plication risk of discharged patients. We also examined the effectiveness of early discharge as an alternative way of increasing capacity. Our findings illustrate that inclusion of early discharge option improves system ac-cessibility significantly and does not jeopardize care eq-uity among patients. Furthermore, we observed that in-clusion of early discharge option has more pronounced
effects on increasing care unit capacity than addition of open beds. Although our results were based on a spe-cific type of care (intensive coronary care), they can be generalized to other settings such as emergency rooms and psychiatric care units facing congestion.
Our model can also be extended to the case when there is a heterogeneous patient population (i.e., when there are N distinct patient classes). Assuming that a patient is discharged early to make room for an incoming patient in his/her own class only and that patients do not change classes once admitted, under a similar two-parameter discharge policy (Ti,T*)i for each patient class i, one can show that the steady state probability density of the state of the system is of the product form (Jackson 1957). It would be interesting to develop such an extension of our model to analyze prioritization issues in triage for heterogeneous pop-ulations.
Other future extensions to our model would be to al-low for nonstationary arrival processes to capture surges in patient arrivals readily seen in many health care units and the inclusion of other measures in the discharge/triage policy in conjunction with the stage of recovery and the length of stay of a patient.6
6We gratefully acknowledge the assistance of Professors E. B. Larson,
S. Aziz, D. Ralph, and of Ms. P. Lynn at the University of Washington Medical Center. We also would like to thank the E. Kaplan, the asso-ciate editor, and the two anonymous referees for their comments and suggestions. The second author gratefully acknowledges the support of Burlington Northern/Burlington Resources, Inc.
Appendix
Derivation of the Normalizing Constant (Equation (11)):
First, we observe that:
yn y2n
`
··· ∏G(y )dy ···dyi 1 n
* * *
0 0 0 iÅ1 yn n01 `(*0 G(h)dh) n (1/m) Å*
G(y )dy Ån n . (n 0 1)! n! 0We define the density function of having a total of j patients in the system with n patients who have spent (x1, . . . , xn) in Stage 2 as:
q (x , . . . , x )j 1 n ` yj0n y2 Å
* * *
··· pj0n,n(y , . . . , y1 j0n, x , . . . , x )dy ···dy1 n 1 j0n 0 0 0 j j0n n l (1/m) KS D
∏F(x ) exp(0lT) for j õ M,i F(T) (j 0 n)! iÅ1 n M0n M l (1/m) KS D
∏F(x ) exp(0lTi *) F(T) (M 0 n)!iÅ1 Å for x ° Tn * and j Å M, n M0n M l (1/m) KH J
∏F(x ) exp(0lx )i n F(T) (M 0 n)!iÅ1 for T* ° x õ T and j Å M, n ú 0.n Define x L(x) Å*
F(h)dh 0and note that:
n S xn x2 ··· ∏F(x )dx ···dxi 1 n
* * *
0 0 0 iÅ1 xn n01 S(*0 F(h)dh) (L(s))n Å*
F(x )dx Ån n . (n 0 1)! n! 0Then, the probability of having a total of j patients in the system, qj,
can be expressed as follows: For j õ M:
j T xn x2 q Åj ∑
* * *
··· q (x , . . . , x )dx ···dxj 1 n 1 n 0 0 0 nÅ0 j j0n j 1 l 1 n ÅK∑S DS D
(L(T)) exp(0lT) (j 0 n)!n! F(T) m nÅ0 K l 1 j ÅH S
/L(T)DJ
exp(0lT) j! F(T) m l 1 ÅKf j,H S
/L(T)DJ
exp(0lT). (A1) F(T) mSimilarly, for j Å M, we have:
M 1 l M 1 M0n n q Å KM ∑
S D S D
(L(T*)) exp(0lT*) (M 0 n)!n! F(T) m nÅ0 M 1 l M 1 M0n /K ∑S D S D
(M 0 n)!(n 0 1)! F(T) m nÅ1 T n01 ·*
F(x)(L(x)) exp(0lx)dx T= M K l 1 ÅH S
/L(T*)DJ
exp(0lT*) M! F(T) m K l /S D
(M 0 1)! F(T) T l 1 M01 ·*
F(x)H S
/L(x)DJ
exp(0lx)dx. F(T) m T=Integrating by parts and simplifying, we get:
l 1 q Å Kf M,M
F
S
/L(T)DG
exp(0lT) F(T) m T l 1 /Kl*
fF
M,S
/L(x)DG
exp(0lx)dx. (A2) F(T) m T= But: M q Å 1. (A3) ∑ j jÅ1By employing (A1) and (A2) in (A3), we get (9).
Derivation of the Average Number of Patients Denied Admission per Time Unit (Equation (12))
The patients who are denied admission are those that arrive when the system is full and the patients who are in Stage 2 have spent less than
T* in that stage. Therefore, M T= xn x2 E[N ] Å ld ∑
* * *
··· q (x , . . . , x )dx ···dxM 1 n 1 n 0 0 0 nÅ0 l 1 Å lKf M,F
S
/L(T*)DG
exp(0lT*). F(T) mFigure A1 Graph of Hazard Function Values and the Discharge Day in Stage 2 (After Madsen et al. 1983) Derivation of the Average Number of Patients Released per Unit
Time Who Will Have Complications (Equation (13))
The number of patients developing complications after discharge con-sists of the patients who developed complications after a normal charge and those who developed complications after an early dis-charge. Therefore, M j T xn01 x2 E[N ] Åc ∑ ∑
* * *
··· r(T)q (x , . . . , xj 1 n01, T)dx ···dx1 n01 0 0 0 jÅ1 nÅ1 M T xn x2 / l∑* * *
··· r(x )q (x , . . . , x )dx ···dxn M 1 n 1 n T= 0 0 nÅ1 j01 j0n M j 1 l 1 n01 Å lKr(T)∑ ∑S D S D
(L(T)) (j 0 n)!(n 0 1)! F(T) m jÅ1 nÅ1 T lK l 1exp(0lT) /S D
*
r(j)F(j) (M 0 1)! F(T) T= M01 l 1 1H S
/L(j)DJ
exp(0lj)dj, F(T) mwhich will simplify to:
E(N )c l 1 Å lKr(T)F M 0 1,
H
S
/L(T)DJ
exp(0lT) F(T) m T l l / lKS D
*
r(j)F(j)f M 0 1,F
F(T) T= F(T) 1 1S
/L(j)DG
exp(0lj)dj. mDerivation of the Expected Number of Beds Occupied by Patients in the Care Unit (Equation (14))
The average number of beds occupied, E(N), is
M
E(N) Å ∑nqn nÅ0
by definition. Using (A1) and (A2), we get:
M l 1 E(N Å K ∑ nf n,
F S
/L(T)DG
exp(0lT) F(T) m nÅ0 l 1 /M 1 0 KF M,H F
S
/L(T)DG
exp(0lTJ
F(T) m l 1 ÅM 0 K exp(0lT) MF M,H F
S
/L(T)DG
F(T) m l 1 0S S
/L(T)DD
F(T) m l 1 1 FF
M 0 1,S
/L(T)DGJ
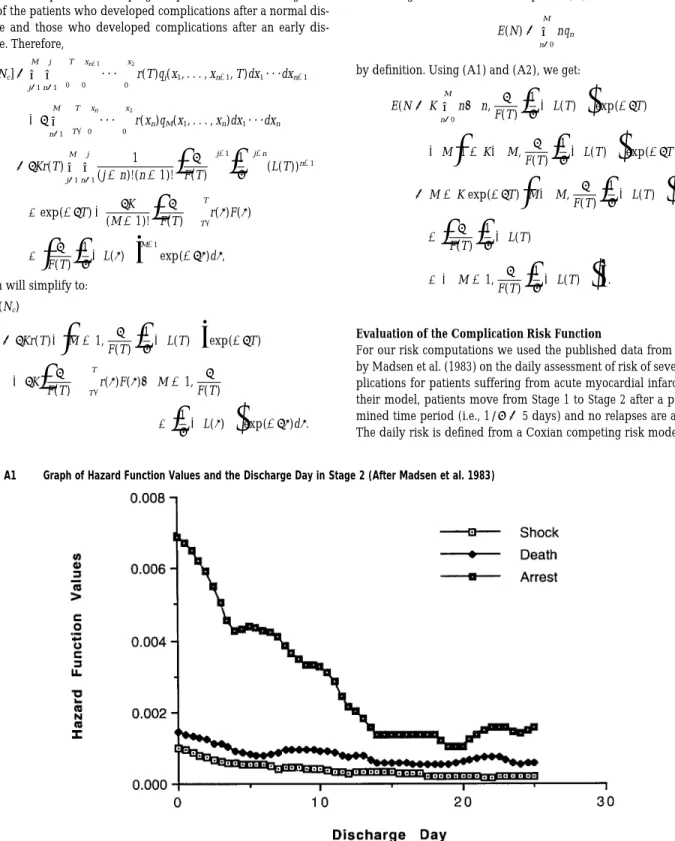
. F(T) mEvaluation of the Complication Risk Function
For our risk computations we used the published data from a study by Madsen et al. (1983) on the daily assessment of risk of severe com-plications for patients suffering from acute myocardial infarction. In their model, patients move from Stage 1 to Stage 2 after a predeter-mined time period (i.e., 1/m Å 5 days) and no relapses are allowed. The daily risk is defined from a Coxian competing risk model as the
likelihood of at least one of the events of death, cardiac arrest, and cardiogenic shock occurring within the next 14 days for a period of 30 days after hospitalization. This probability is estimated by
3
i i i i
1 0 exp 0
H
∑(exp{b Z / ··· / b Z })(L (t / 13) 0 L (t 0 1))1 1 p p 0 0J
iÅ1
where Zpdenotes the categorical prognostic factors (age, previous
myocardial infarction, heart failure, ventricular fibrillation, asystole, cardiogenic shock, supraventricular tachycardia, premature ventricu-lar beats, nodal rhythm, atrioventricuventricu-lar block, extension of myocar-dial infarction and a constant),bi denotes the corresponding
coeffi-p
cient for each complication type, and i /13) 0 i 01)) is the (L (t0 L0(t
difference in integrated hazard function values on any day after ad-mission (t) and on a day after 14 days later for each end point. The hazard values for each complication type at half day intervals are pre-sented in Figure A1.
In our numerical analysis, we used a patient population having the prognostic characteristics of a 50-year-old patient with heart failure and supraventricular tachycardia (i.e., the nonzero coefficients are given asb1Å0.082 1 50,b2Å0.010,b3Å0.028,b1Å2.3,b2Å2.2,
1 1 1 3 3
Å3.3, Å1.0, Å 04.9, Å 00.6, Å 01.7 and computed
3 2 1 2 3
b3 b7 b12 b12 b12
accordingly the daily risk of complications within the next 14 days. The same set of prognostic characteristics have been used by Madsen et al. (1983) as an example to illustrate moderate risk levels.
Note that the daily risks of complications within the next 14 days are conditional probabilities and discharge decisions in our model are based on the cumulative probability of complications after discharge. Therefore, we cannot use the risk figures obtained from Figure A1 directly but need to convert the daily risk assessments to cumulative probabilities. However, since only the differences in hazard values were tabulated in Madsen et al. and we did not have access to the raw data, we could only compute cumulative complication probabilities as a multiple of some base risk value. This base risk value corresponds to the probability of a patient developing complications long after hos-pitalization. Thus, a patient discharged after a total hospitalization of 11 days, for instance, is 1.13 times as likely to develop complications as a patient who has had 60 days of hospitalization. The cumulative risk of complications was obtained by computing the daily risk as-sessments at half-day intervals for 30 days of hospitalization and de-veloping, based on these values, a smoothed monotonically nonin-creasing cumulative function (R2Å0.97).
References
Aaron, J. H. and W. B. Schwartz, The Painful Prescription: Rationing
Hospital Care, The Brookings Institute, 1984.
American Hospital Association, ‘‘Hospital Statistics: Data from the American Hospital Association, 2–7,’’ Chicago, IL, 1990. Aziz, S., Personal communique, 1996.
Blondel, B., M. Garel, G. Br’eart, ?and C. Sureau, ‘‘Early Discharge of Women After Delivery. Results of an Opinion Survey Among the Patients and Unit Personnel’’ (in French), J. Gynecol. Obstet. Biol.
Reprod. Paris, 12 (1983), 457–460.
Cox, D. R., ‘‘The Analysis of Non-Markovian Stochastic Processes by the Inclusion of Supplementary Variables,’’ Proc. Cambridge
Phi-los. Soc., 51 (1955), 443–441.
Cullen, D. J., ‘‘Results and Costs of Intensive Care,’’ Anesthesiology, 47 (1977), 203–215.
Department of Health and Human Services, ‘‘Report to Congress: Im-pact of the Medicare Hospital Prospective Payment System,’’ 1985 Annual Report. Health Care Financing Administration, Office of the Research and Demonstrations (HCFA #03251), Washington, DC, 1985.
Eckholm E., Solving America’s Health Care Crisis, Times Books, New York, 1993.
Eggers, P. W., ‘‘Prospective Payment Systems and Quality: Early Re-sults and Research Strategy,’’ Health Care Financing Review, An-nual Supplement (1987), 19–37.
Engelhardt, H. T., Jr. and M. A. Rie, ‘‘Intensive Care Units, Scarce Resources, and Conflicting Principles of Justice,’’ J. Amer. Medical
Assoc., 255, 9 (1986), 1159–1164.
Epstein, A. M., J. Bogen, P. Dreyer, and K. E. Thorpe, ‘‘Trends in Length of Stay and Rates of Admission in Massachusetts: Implications for Monitoring Quality of Care,’’ Inquiry, 28 (1991), 19–28.
Evans, R. W., ‘‘Health Care Technology and the Inevitability of Re-source Allocation and Rationing Decisions,’’ J. Amer. Medical
As-soc., 249 (1983), 2047–2053, 2208–2218.
Franklin, C. and D. Jackson, ‘‘Discharge Decision-Making in a Medical ICU: Characteristics of Unexpected Readmissions,’’ Critical Care
Medicine, 11, 2 (1983), 61–66.
Gnedenko, B. and I. N. Kovalenko, Introduction to Queueing Theory, Israel Program for Scientific Translations, Jerusalem, Israel, 1968. Hellman, L. M., S. G. Kohl, and J. Palmer, ‘‘Early Hospital Discharge
in Obstetrics,’’ Lancet, 1 (1962), 227–232.
Jackson, J. R., ‘‘Networks of Waiting Lines,’’ Oper. Res., 5 (1957), 518– 521.
Joint Commission on Accreditation of Health Care Organization. Spe-cial Care Units. Accreditation Manual for Hospitals, sp.1.1. pg 3 and sp.2.1.3, 1992.
Kalb, P. E. and D. H. Miller, ‘‘Utilization Strategies for Intensive Care Units,’’ J. Amer. Medical Assoc., 261, 16 (1989), 2389–2395. Kao, E. P. C., ‘‘A Semi-Markov Model for Predicting Recovery Progress
of Coronary Patients,’’ Health Services Res., 7 (1972), 191–208. Larson, E. B., Personal communique, 1996.
Madsen, E. B., P. Hougaard, E. Gilpin, and A. Pederson, ‘‘The Length of Hospitalization After Acute Myocartial Infraction Determined by Risk Calculation,’’ Circulation, 68, 1 (1983), 9–16.
McNeer, J. F. et al., ‘‘The Course of Acute Myocardial Infarction: Fea-sibility of Early Discharge of the Uncomplicated Patient,’’
Circu-lation, 51 (1975), 410.
Miller, D. H., ‘‘The Rationing of Intensive Care,’’ Critical Care Clinics, 10, 1 (1994), 135–143.
Moinzadeh, K., ‘‘Operating Characteristics of the (S-1,S) Inventory System with Partial Backorders and Constant Resupply Times,’’
Management Sci., 4 (1989), 472–477.
Mulley, A. G., G. E. Thibault, R. A. Highes, G. O. Barnett, V. A. Reder, and E. L. Sherman, ‘‘Course of Patients with Suspected
Myocar-dial Infarction: The Identification of Low-risk Patients for Early Transfer from Intensive Care,’’ New England J. Medicine, 302 (1980), 943–948.
Rafferty, J., ‘‘A Comment on Incentive Reimbursement,’’ Med-Care, 9, 6 (1971), 518–520.
Rhodes, M. K., ‘‘Early Discharge of Mothers and Infants Following Vaginal Childbirth at the United States Air Force Academy: A Three-Year Study,’’ Military Medicine, 159 (1994), 227–230. Schmidt, C. P. and S. Nahmias, ‘‘(S-1,S) Policies for Perishable
Inven-tory,’’ Management Sci., 31 (1985), 719–728.
Schwartz, S. and D. Cullen, ‘‘How Many Intensive Care Beds Does Your Hospital Need?’’ Critical Care Medicine, 9, 9 (1981), 625–629. Schwartz, W. B. and J. H. Aaron, ‘‘Rationing Hospital Care: Lessons
from Britain,’’ New England J. Medicine, 310 (1984), 52–56. Shear, L. M., J. S. Steingrub, D. Teres, et al., ‘‘ICU Patient Triage
Rank-ing: A Flawed Practice?’’ (Abstract), Critical Care Medicine, 16, 4 (1988), 409.
Singer, D. E., P. L. Carr, A. G. Mulley, and G. E. Thibault, ‘‘Rationing Intensive Care: Physicians’ Responses to a Resource Shortage,’’
New England J. Medicine, 309 (1983), 1155–1160.
Society of Critical Care Medicine, Task Force on Guidelines, ‘‘Rec-ommendations for Intensive Care Unit Admission and Discharge Criteria,’’ Critical Care Medicine, 16, 8 (1988), 807–808.
, Ethics Committee, ‘‘Consensus Statement on the Triage of Crit-ically Ill Patients,’’ J. Amer. Medical Assoc., 271, 15 (1994), 1200– 1203.
Strauss, M. J., J. P. LoGerfo, J. A. Yeltatzie, N. Temkin and L. D. Hudson, ‘‘The Rationing of Intensive Care Unit Services: An Everyday Occurrence,’’ J. Amer. Medical Assoc., 255 (1986), 1143–1146.
Teres, D., ‘‘Civilian Triage in the Intensive Care Unit: The Ritual of the Last Bed,’’ Critical Care Medicine, 21, 4 (1993), 598– 606.
Thomas, W. H., ‘‘A Model for Predicting Recovery Progress of Coronary Patients,’’ Health Services Res., 3 (1968), 185– 213.
Von Stetina v Florida Medical Center, 2 Fla Supp 2d 55 (Fla 17th Cir
1982), 436 So Rptr 2d 1022 (1983, 10 Florida Law Weekly 286 (Fla May 24, 1985).
Walker, L. M., ‘‘Just How Short Can Hospital Stays Be?’’ Medical
Eco-nomics (1995), 39–47.
Williams, S. V., ‘‘How Many Intensive Care Beds Are Enough?’’
Crit-ical Care Medicine, 11, 6 (1983), 412–416.
Zuckerman, S. and J. Holahan, ‘‘PPS Waivers: Implications for Medi-care, Medicaid and Commercial Insurers,’’ J. Health Politics, Policy
and Law, 13 (1988), 663–681. Accepted by Edward H. Kaplan; received July 1995. This paper has been with the authors 4 months for 2 revisions.