Femtosecond response of J aggregates adsorbed onto silver colloid surfaces
Gül Yaǧlioǧlu, Roger Dorsinville, and Serdar Özçelik
Citation: Journal of Applied Physics 94, 3143 (2003); doi: 10.1063/1.1597941 View online: http://dx.doi.org/10.1063/1.1597941
View Table of Contents: http://aip.scitation.org/toc/jap/94/5 Published by the American Institute of Physics
Articles you may be interested in
Probing ultrafast energy transfer between excitons and plasmons in the ultrastrong coupling regime Applied Physics Letters 105, 051105 (2014); 10.1063/1.4892360
Femtosecond response of J aggregates adsorbed onto silver
colloid surfaces
Gu¨l Yagˇliogˇlua)and Roger Dorsinvilleb)
Department of Electrical Engineering, The City College of The City University of New York, New York, New York 10031
Serdar O¨ zc¸elikc)
Department of Chemistry, Bilkent University, Bilkent-Ankara 06533, Turkey 共Received 6 February 2003; accepted 16 June 2003兲
We have performed femtosecond pump-probe spectroscopy measurements in 1,1’-diethyl-3,3’-bis共4-sulfobutyl兲-5,5’,6,6’-tetrachlorobenz imidazolocarbocyanine 共also known as TDBC兲 J aggregates adsorbed onto silver colloidal surfaces. We show that the dependence on probe power and wavelength of the induced emission band dynamics, intensity, and position can only be explained by assuming stimulated emission from the one-exciton state. The stimulated emission originates from the amplification of the one-exciton state emission by an induced transition from the two-exciton state to the one-exciton state. One of the key causes of the stimulated emission is the formation of coherently coupled TDBC molecules on colloidal silver surfaces. © 2003 American
Institute of Physics. 关DOI: 10.1063/1.1597941兴
I. INTRODUCTION
Molecular aggregates are formed by self-assembly of molecules, which are bound to each other by noncovalent interactions. Optical materials derived from molecular aggre-gates are widely used as spectral sensitizers in photography,1 and as optical probes measuring mitochondrial membrane potential and detecting apoptosis 共controlled cell death兲 in living cells.2,3Moreover, molecular aggregates play a crucial role in nature: light harvesting and the primary charge-separation steps in photosynthesis are facilitated by aggre-gated species.4Current consensus is that all of these features arise from the formation of excitons. In J aggregates a few molecules are coherently coupled, thus resulting in quantum confinement of the states, and form a coherent size. How-ever, the physical size of the J aggregates may consist of thousands of coherent sizes. The physical structure is in the micrometer scale while the coherent size is anticipated to be in nanometers. The coherent size—the number of molecules coherently responding to the external optical field—is re-sponsible for the linear and nonlinear optical properties.
J aggregates exhibit intriguing optical and spectral prop-erties such as super radiant emission,5–9 ultrafast optical switching,10 electroluminescence,11 strong exciton-photon coupling,12 superquenching of fluorescence for biosensing applications,13 and mirrorless optical bistability.14 These at-tractive features make J aggregates very promising nanoscale materials for future technological applications.
Understanding excited-state dynamics is very important for any device application utilizing J aggregates as optical
material. Our aim is to study the excited-state mechanisms which govern the photon emission process. The resolution of this issue should eventually help in the engineering and fab-rication of optical devices such as J-aggregate based light emitting diodes covering the whole visible region. We report the observation of stimulated emission from J aggregates ad-sorbed onto silver colloid surfaces using femtosecond exci-tation. The stimulated emission is inferred from the excita-tion intensity and wavelength dependence of the emission band.
II. EXPERIMENT
Sodium salt of 1,1’-diethyl-3,3’-bis 共4-sulfobutyl兲-5,5’,6,6’-tetrachlorobenzimidazolocarbocyanine 共TDBC, see bottom of Fig. 1 for the structure兲 was purchased from Mo-lecular Probes Inc., Eugene, OR, and used without further purification. Colloidal silver suspensions were prepared by reduction of AgNO3 with NaBH4. Then 0.3 ml of 5 mM of AgNO3 was drop wise added into 10 mM of 49.7 ml of NaBH4 under vigorous stirring in an ice bath. The resulting silver solution had an absorption peak at 384 nm, and was stable for several weeks. J aggregates are prepared by mixing 6 ml of 1 mM TDBC in methanol with 25 ml of aqueous silver colloid solution.
The output of a Spectra-Physics optical parametric amplifier at 587 nm was used as the pump beam. A white light continuum generated by focusing an amplified femtosecond pulse into a 2-mm-thick sapphire plate was used as the probe beam.15 A fiber optic spectrometer with two channels is used to detect optical signals. The pump and probe beams were spatially overlapped onto a 2-mm-thick flowing cell. Transient transmission signal T(,t) ⫽兵关IT(,t)⫺ITB()兴/关IR(,t)⫺IRB()兴其 and reference signal R(,t)⫽兵关IR(,t)⫺ITB()兴/关IR(,t)⫺IRB()兴其 without the pump pulse were recorded in appropriate
chan-a兲Present address: Lucent Technologies, 101 Crawfords Road Room
3E-508A, Holmdel, New Jersey 07733.
b兲Author to whom correspondence should be addressed; electronic mail:
c兲Present address: Pacific Northwest National Laboratory, K8-88, Richland, WA 99352.
3143
nels of the spectrometer. Here, IT(, t), IR(, t), ITB(),
IRB() are, respectively, the transient transmission, the tran-sient reference, the reference transmission, and the reference background spectra. The differential transmission spectra were measured as ⌬T/T⫽关T(, t)⫺R(, t)兴/R(, t). The contribution of the steady-state fluorescence and very strong linear absorption of the J aggregate to the normalized differ-ential absorption spectra were minimized. These two effects are independent of the time overlap of the pump and the probe pulses. A reference spectrum was taken when both pump and probe pulses were present and when the probe pulse preceded the pump pulse by approximately 2 ns. No signal was observed when the probe pulses preceded the pump pulses. A transient absorption signal appeared when both pulses overlapped in time. This procedure ensured that the linear absorption and steady-state fluorescence emission caused by the pump and the probe pulses did not affect the differential absorption spectrum. It also enabled us to detect only the time-delay dependent absorption or emission caused by the sample. In addition, after every change of the probe intensity a new reference spectrum was stored. Therefore, an increase in the probe power did not change the signal in the absence of the delay-dependent emission.
III. RESULTS AND ANALYSIS
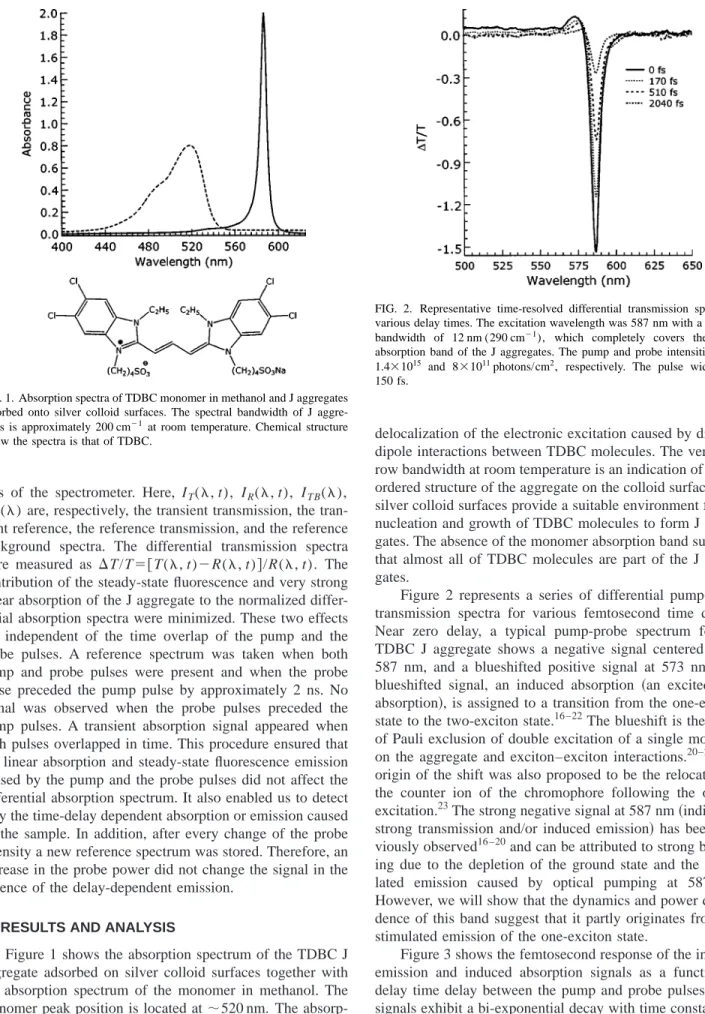
Figure 1 shows the absorption spectrum of the TDBC J aggregate adsorbed on silver colloid surfaces together with the absorption spectrum of the monomer in methanol. The monomer peak position is located at⬃520 nm. The absorp-tion peak of the J aggregate is shifted to 587 nm with a bandwith of 6.8 nm (200 cm⫺1or 24 meV兲 at room tempera-ture. The redshift of the J-aggregate absorption is due to the
delocalization of the electronic excitation caused by dipole– dipole interactions between TDBC molecules. The very nar-row bandwidth at room temperature is an indication of a well ordered structure of the aggregate on the colloid surface. The silver colloid surfaces provide a suitable environment for the nucleation and growth of TDBC molecules to form J aggre-gates. The absence of the monomer absorption band suggests that almost all of TDBC molecules are part of the J aggre-gates.
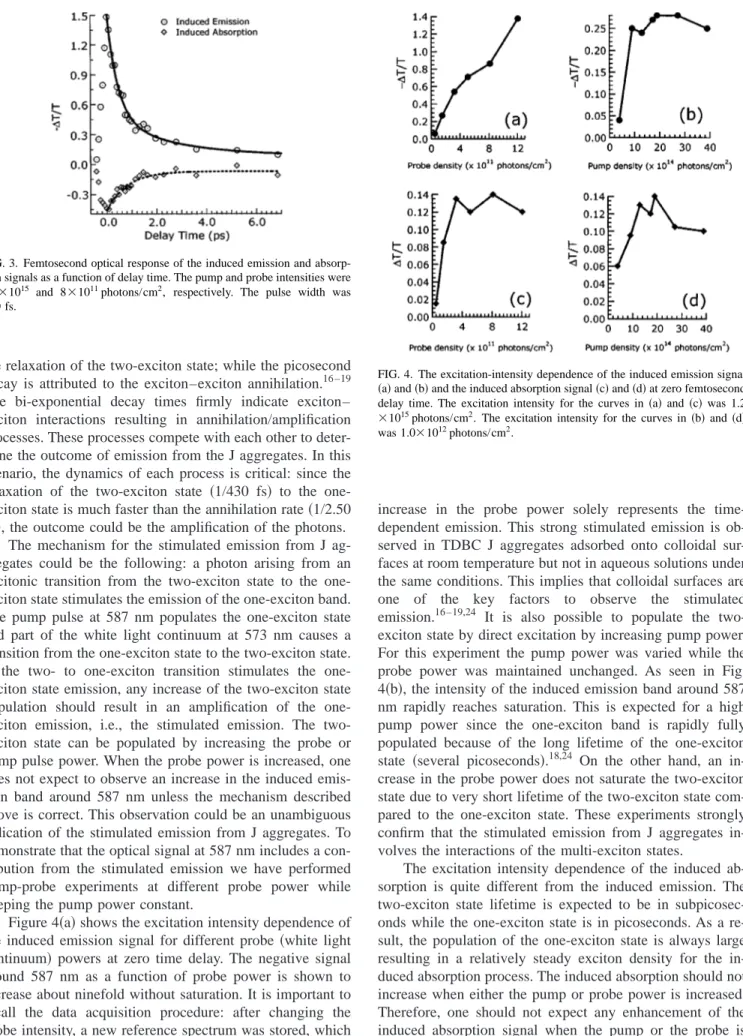
Figure 2 represents a series of differential pump-probe transmission spectra for various femtosecond time delays. Near zero delay, a typical pump-probe spectrum for the TDBC J aggregate shows a negative signal centered about 587 nm, and a blueshifted positive signal at 573 nm. The blueshifted signal, an induced absorption 共an excited-state absorption兲, is assigned to a transition from the one-exciton state to the two-exciton state.16 –22The blueshift is the result of Pauli exclusion of double excitation of a single molecule on the aggregate and exciton–exciton interactions.20–22The origin of the shift was also proposed to be the relocation of the counter ion of the chromophore following the optical excitation.23The strong negative signal at 587 nm共indicating strong transmission and/or induced emission兲 has been pre-viously observed16 –20and can be attributed to strong bleach-ing due to the depletion of the ground state and the stimu-lated emission caused by optical pumping at 587 nm. However, we will show that the dynamics and power depen-dence of this band suggest that it partly originates from the stimulated emission of the one-exciton state.
Figure 3 shows the femtosecond response of the induced emission and induced absorption signals as a function of delay time delay between the pump and probe pulses. Both signals exhibit a bi-exponential decay with time constants of 430 fs and 2.50 ps for the induced emission signal at 587 nm, and 670 fs and 4.75 ps for the induced absorption signal at 573 nm. The femtosecond decay is, in general, ascribed to
FIG. 1. Absorption spectra of TDBC monomer in methanol and J aggregates adsorbed onto silver colloid surfaces. The spectral bandwidth of J aggre-gates is approximately 200 cm⫺1at room temperature. Chemical structure below the spectra is that of TDBC.
FIG. 2. Representative time-resolved differential transmission spectra at various delay times. The excitation wavelength was 587 nm with a spectral bandwidth of 12 nm (290 cm⫺1), which completely covers the linear absorption band of the J aggregates. The pump and probe intensities were 1.4⫻1015 and 8⫻1011photons/cm2, respectively. The pulse width was 150 fs.
the relaxation of the two-exciton state; while the picosecond decay is attributed to the exciton–exciton annihilation.16 –19 The bi-exponential decay times firmly indicate exciton– exciton interactions resulting in annihilation/amplification processes. These processes compete with each other to deter-mine the outcome of emission from the J aggregates. In this scenario, the dynamics of each process is critical: since the relaxation of the two-exciton state 共1/430 fs兲 to the one-exciton state is much faster than the annihilation rate共1/2.50 ps兲, the outcome could be the amplification of the photons.
The mechanism for the stimulated emission from J ag-gregates could be the following: a photon arising from an excitonic transition from the two-exciton state to the one-exciton state stimulates the emission of the one-one-exciton band. The pump pulse at 587 nm populates the one-exciton state and part of the white light continuum at 573 nm causes a transition from the one-exciton state to the two-exciton state. If the two- to exciton transition stimulates the one-exciton state emission, any increase of the two-one-exciton state population should result in an amplification of the one-exciton emission, i.e., the stimulated emission. The two-exciton state can be populated by increasing the probe or pump pulse power. When the probe power is increased, one does not expect to observe an increase in the induced emis-sion band around 587 nm unless the mechanism described above is correct. This observation could be an unambiguous indication of the stimulated emission from J aggregates. To demonstrate that the optical signal at 587 nm includes a con-tribution from the stimulated emission we have performed pump-probe experiments at different probe power while keeping the pump power constant.
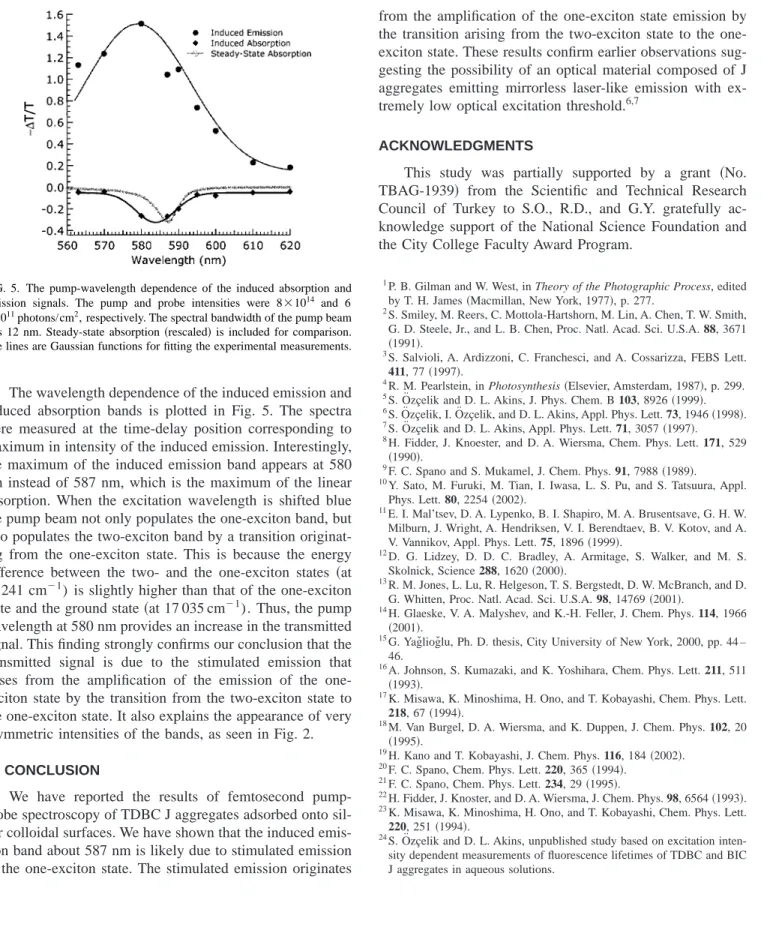
Figure 4共a兲 shows the excitation intensity dependence of the induced emission signal for different probe 共white light continuum兲 powers at zero time delay. The negative signal around 587 nm as a function of probe power is shown to increase about ninefold without saturation. It is important to recall the data acquisition procedure: after changing the probe intensity, a new reference spectrum was stored, which eliminates the amplification of the steady-state fluorescence contribution due to an increase in probe power. Therefore, an
increase in the probe power solely represents the time-dependent emission. This strong stimulated emission is ob-served in TDBC J aggregates adsorbed onto colloidal sur-faces at room temperature but not in aqueous solutions under the same conditions. This implies that colloidal surfaces are one of the key factors to observe the stimulated emission.16 –19,24 It is also possible to populate the two-exciton state by direct excitation by increasing pump power. For this experiment the pump power was varied while the probe power was maintained unchanged. As seen in Fig. 4共b兲, the intensity of the induced emission band around 587 nm rapidly reaches saturation. This is expected for a high pump power since the one-exciton band is rapidly fully populated because of the long lifetime of the one-exciton state 共several picoseconds兲.18,24 On the other hand, an in-crease in the probe power does not saturate the two-exciton state due to very short lifetime of the two-exciton state com-pared to the one-exciton state. These experiments strongly confirm that the stimulated emission from J aggregates in-volves the interactions of the multi-exciton states.
The excitation intensity dependence of the induced ab-sorption is quite different from the induced emission. The two-exciton state lifetime is expected to be in subpicosec-onds while the one-exciton state is in picosecsubpicosec-onds. As a re-sult, the population of the one-exciton state is always large resulting in a relatively steady exciton density for the in-duced absorption process. The inin-duced absorption should not increase when either the pump or probe power is increased. Therefore, one should not expect any enhancement of the induced absorption signal when the pump or the probe is increased. Figures 4共c兲 and 4共d兲 strongly confirm this expec-tation.
FIG. 3. Femtosecond optical response of the induced emission and absorp-tion signals as a funcabsorp-tion of delay time. The pump and probe intensities were 1.4⫻1015 and 8⫻1011photons/cm2, respectively. The pulse width was 150 fs.
FIG. 4. The excitation-intensity dependence of the induced emission signal 共a兲 and 共b兲 and the induced absorption signal 共c兲 and 共d兲 at zero femtosecond delay time. The excitation intensity for the curves in共a兲 and 共c兲 was 1.2 ⫻1015photons/cm2. The excitation intensity for the curves in共b兲 and 共d兲 was 1.0⫻1012photons/cm2.
The wavelength dependence of the induced emission and induced absorption bands is plotted in Fig. 5. The spectra were measured at the time-delay position corresponding to maximum in intensity of the induced emission. Interestingly, the maximum of the induced emission band appears at 580 nm instead of 587 nm, which is the maximum of the linear absorption. When the excitation wavelength is shifted blue the pump beam not only populates the one-exciton band, but also populates the two-exciton band by a transition originat-ing from the one-exciton state. This is because the energy difference between the two- and the one-exciton states 共at 17 241 cm⫺1) is slightly higher than that of the one-exciton state and the ground state共at 17 035 cm⫺1). Thus, the pump wavelength at 580 nm provides an increase in the transmitted signal. This finding strongly confirms our conclusion that the transmitted signal is due to the stimulated emission that arises from the amplification of the emission of the one-exciton state by the transition from the two-one-exciton state to the one-exciton state. It also explains the appearance of very asymmetric intensities of the bands, as seen in Fig. 2.
IV. CONCLUSION
We have reported the results of femtosecond pump-probe spectroscopy of TDBC J aggregates adsorbed onto sil-ver colloidal surfaces. We have shown that the induced emis-sion band about 587 nm is likely due to stimulated emisemis-sion of the one-exciton state. The stimulated emission originates
from the amplification of the one-exciton state emission by the transition arising from the two-exciton state to the one-exciton state. These results confirm earlier observations sug-gesting the possibility of an optical material composed of J aggregates emitting mirrorless laser-like emission with ex-tremely low optical excitation threshold.6,7
ACKNOWLEDGMENTS
This study was partially supported by a grant 共No. TBAG-1939兲 from the Scientific and Technical Research Council of Turkey to S.O., R.D., and G.Y. gratefully ac-knowledge support of the National Science Foundation and the City College Faculty Award Program.
1P. B. Gilman and W. West, in Theory of the Photographic Process, edited by T. H. James共Macmillan, New York, 1977兲, p. 277.
2S. Smiley, M. Reers, C. Mottola-Hartshorn, M. Lin, A. Chen, T. W. Smith, G. D. Steele, Jr., and L. B. Chen, Proc. Natl. Acad. Sci. U.S.A. 88, 3671
共1991兲.
3S. Salvioli, A. Ardizzoni, C. Franchesci, and A. Cossarizza, FEBS Lett.
411, 77共1997兲.
4R. M. Pearlstein, in Photosynthesis共Elsevier, Amsterdam, 1987兲, p. 299. 5
S. O¨ zc¸elik and D. L. Akins, J. Phys. Chem. B 103, 8926 共1999兲. 6S. O¨ zc¸elik, I. O¨zc¸elik, and D. L. Akins, Appl. Phys. Lett. 73, 1946 共1998兲. 7S. O¨ zc¸elik and D. L. Akins, Appl. Phys. Lett. 71, 3057 共1997兲. 8H. Fidder, J. Knoester, and D. A. Wiersma, Chem. Phys. Lett. 171, 529
共1990兲.
9
F. C. Spano and S. Mukamel, J. Chem. Phys. 91, 7988共1989兲. 10Y. Sato, M. Furuki, M. Tian, I. Iwasa, L. S. Pu, and S. Tatsuura, Appl.
Phys. Lett. 80, 2254共2002兲.
11E. I. Mal’tsev, D. A. Lypenko, B. I. Shapiro, M. A. Brusentsave, G. H. W. Milburn, J. Wright, A. Hendriksen, V. I. Berendtaev, B. V. Kotov, and A. V. Vannikov, Appl. Phys. Lett. 75, 1896共1999兲.
12D. G. Lidzey, D. D. C. Bradley, A. Armitage, S. Walker, and M. S. Skolnick, Science 288, 1620共2000兲.
13
R. M. Jones, L. Lu, R. Helgeson, T. S. Bergstedt, D. W. McBranch, and D. G. Whitten, Proc. Natl. Acad. Sci. U.S.A. 98, 14769共2001兲.
14H. Glaeske, V. A. Malyshev, and K.-H. Feller, J. Chem. Phys. 114, 1966
共2001兲.
15G. Yagˇliogˇlu, Ph. D. thesis, City University of New York, 2000, pp. 44 – 46.
16A. Johnson, S. Kumazaki, and K. Yoshihara, Chem. Phys. Lett. 211, 511
共1993兲.
17K. Misawa, K. Minoshima, H. Ono, and T. Kobayashi, Chem. Phys. Lett.
218, 67共1994兲.
18
M. Van Burgel, D. A. Wiersma, and K. Duppen, J. Chem. Phys. 102, 20
共1995兲.
19H. Kano and T. Kobayashi, J. Chem. Phys. 116, 184共2002兲. 20F. C. Spano, Chem. Phys. Lett. 220, 365共1994兲.
21
F. C. Spano, Chem. Phys. Lett. 234, 29共1995兲. 22
H. Fidder, J. Knoster, and D. A. Wiersma, J. Chem. Phys. 98, 6564共1993兲. 23K. Misawa, K. Minoshima, H. Ono, and T. Kobayashi, Chem. Phys. Lett.
220, 251共1994兲.
24S. O¨ zc¸elik and D. L. Akins, unpublished study based on excitation inten-sity dependent measurements of fluorescence lifetimes of TDBC and BIC J aggregates in aqueous solutions.
FIG. 5. The pump-wavelength dependence of the induced absorption and emission signals. The pump and probe intensities were 8⫻1014 and 6 ⫻1011photons/cm2, respectively. The spectral bandwidth of the pump beam was 12 nm. Steady-state absorption共rescaled兲 is included for comparison. The lines are Gaussian functions for fitting the experimental measurements.