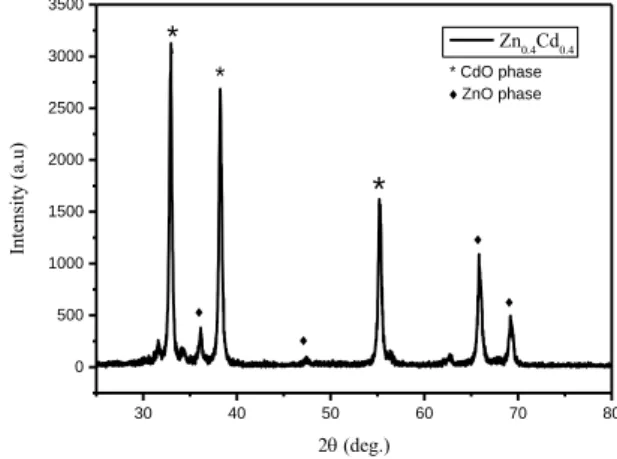
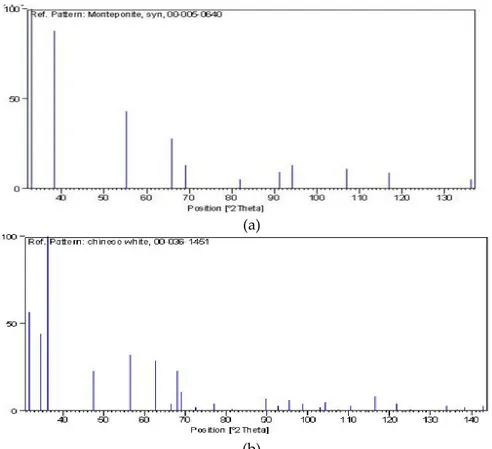
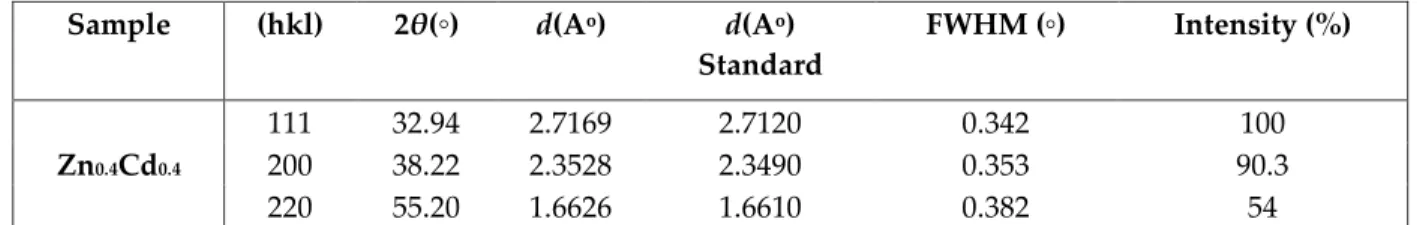
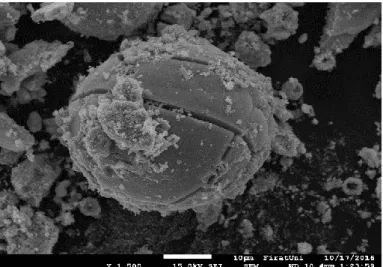
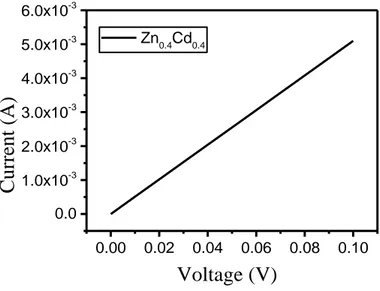
Zn0.4Cd0.4 composite fabrication and characterization
Tam metin
Şekil
Benzer Belgeler
Clinical signs: anemia, diarrhoea (contain blood and mucus), weight lose, loss of appetite... • Ectoparasites … suck different amount of blood and they easily suck blood
The aim of this cross-sectional clinical study was to investigate the possible effects of maternal anemia in primiparous and multiparous pregnant woman with respect
Salata büfesi yerine bir çanak dolusu ızgara tavuklu veya ton balıklı salata ile karın doyurmak isteyenler ise 4 milyon 5 0 0 bin lira ödüyor. a-la-turka’nm günün
Görüşmelerin son günü olan 6 Mart 1923 günü gizli celsede Mustafa Ke- mal Paşa’nın muhaliflere sert bir şekilde çıkışması, arkasından da Ali Şük- rü
Süeda tanesi 20 kuruş olan kalemlerden 43 tane almıştır. Azra, Alihan' dan 9 yaş küçük olduğuna göre Azra kaç
Anahtar Kelimeler: Politik risk, anomali, İMKB 100 Endeksi, getiri, sinyal yaklaşımı, genel ve yerel seçimler.. Analysis of Price Anomalies in ISE Generated by General
Sonuç olarak temelcilik ya da uzun adıyla temelci gerekçelendirme kuramı (İng. foundationalist theory of justification) özetle şunu savunan kuramdır: Bazı
Model kapsamında FMOLS tahmin sonuçları ülke bazında değerlendirildiğinde Brezilya, Rusya, Güney Afrika ve Türkiye için kişi başına düşen sermaye birikimi (lnK) ve
