Tarım Bilimleri Dergisi
Tar. Bil. Der.Dergi web sayfası: www.agri.ankara.edu.tr/dergi
Journal of Agricultural Sciences
Journal homepage:www.agri.ankara.edu.tr/journal
TARIM BİLİMLERİ DERGİSİ
—
JOURNAL OF AGRICUL
TURAL SCIENCES
19 (2013) 219-234
Seed Size and Shape Analysis of Registered Common Bean (Phaseolus
vulgaris L.) Cultivars in Turkey Using Digital Photography
Mazhar KARAa, Bahadır SAYINCIa, Erdal ELKOCAb, İsmail ÖZTÜRKa, Talha Bekir ÖZMENc
a Atatürk University, Faculty of Agriculture, Department of Agricultural Machinery, 25240, Erzurum, TURKEY b Atatürk University, Faculty of Agriculture, Department of Field Crops, 25240, Erzurum, TURKEY
c Atatürk University, Graduate School of Natural and Applied Sciences, Erzurum, TURKEY
ARTICLE INFO
Research Article ― Agricultural Technologies
Corresponding Author: Bahadır SAYINCI, E-mail: [email protected], Tel: +90 (442) 231 26 92 Received: 03 June 2013, Received in Revised Form: 19 August 2013, Accepted: 19 August 2013
ABSTRACT
In this study, the size and shape properties of twelve different bean cultivars (eleven varieties and a genotype) were determined using image processing method on digital photography and the cultivars were grouped depending on their properties. The highest mean values of geometric diameter, projected area, length, width and shape factor in the study were determined in the ‘Çayırlı’ genotype. ‘Terzibaba’ cultivar, more spherical shape at width orientation compared to other cultivars, had the lowest value of thickness (4.6 mm) and more circular at the width orientation among the cultivars. The highest mean of thickness (6.0 mm) were measured in ‘Elkoca-05’ and ‘Noyanbey-98’ cultivars. The sphericity mean of ‘Karacaşehir-90’ (70%) was found higher than those of the other cultivars, while the geometric mean diameter, projected area, length and width values had the lowest mean. ’Yunus-90’ and ‘Göynük-98’ cultivars had the lowest sphericity mean values of 58.9% and 58.7%, respectively. According to the results of Principal Component Analysis (PCA), the most important variables of the first component were mass, geometric mean diameter, surface area, volume, projected area, equivalent diameter, perimeter and length. According to the physical properties of bean cultivars ‘Aras-98’, ‘Elkoca-05’, ‘Göynük-98’, ‘Noyanbey-98’, ‘Yakutiye-98’ and ‘Yunus-90’ were oblongus; ‘Karacaşehir-90’ and ‘Önceler-98’ were ellipticus; ‘Akman-98’, ‘Kantar-05’ and ‘Terzibaba’ were subcompressus and ‘Çayırlı’ genotype was compressus. The size and shape features of the bean cultivars are considerably crucial parameters in terms of designing the seed metering mechanism of seed drills, and transportation, separating and sizing systems. So, the size and shape data of bean cultivars are of mostly importance to engineers, machine manufacturers and machine designers. Keywords: Bean; Image processing; Shape; Sphericity; Projected area
Türkiye’de Tescilli Fasulye (Phaseolus vulgaris L.) Çeşitlerinin Dijital
Fotoğraflama Kullanılarak Boyut ve Şekil Analizi
ESER BİLGİSİ
Araştırma Makalesi ― Tarım Teknolojileri
Sorumlu Yazar: Bahadır SAYINCI, E-posta: [email protected], Tel: +90 (442) 231 26 92 Geliş Tarihi: 03 Haziran 2013, Düzeltmelerin Gelişi: 19 Ağustos 2013, Kabul: 19 Ağustos 2013
Seed Size and Shape Analysis of Registered Common Bean (Phaseolus vulgaris L.) Cultivars in Turkey Using Digital Photography, Kara et al
Ta r ı m B i l i m l e r i D e r g i s i – J o u r n a l o f A g r i c u l t u r a l S c i e n c e s 19 (2013) 219-234
220
1. Introduction
The common bean (Phaseolus vulgaris L.) is the most widely grown edible legume species in the world. Its acreage is 29 million hectares and production is 23.3 million tons. It ranks third among legume crops after chickpea and lentil with acreage of 103.2 thousand hectare and production of 213 thousand tons in Turkey (FAOSTAT data 2012). The visual appearance of agricultural products is the primary criterion and main information for consumer preference (Kays 1991; Jahns et al 2001; Costa et al 2011). The visual appearance is characterized by the properties such as size, shape, color, form, absence of defects and abnormalities (Kays 1999; Jahns et al 2001; Abdullah et al 2006; Venora et al 2007; Costa et al 2011). Among these properties, the size and shape of agricultural products are the most important quality and processing parameters (Morimoto et al 2000; Koc 2007; Sadrnia 2007; Venora et al 2007; Costa et al 2011).
Van Eck et al (1998) used an image analysis system to measure the size and shape of cucumber fruits. Beyer et al (2002) determined the fruit shape of sweet cherry (Prunus avium L.) using an image
analysis system. Venora et al (2007) used an image analysis system to determine the size, shape and mean color of lentil seeds. Koc (2007) determined the volume of watermelon (Citrullus lanatus cv. ‘Surme’) using an image process system. Sadrnia et al (2007) used an image process system to analyze the fruit shape of long type watermelon (cv. ‘Charleston Gray’). Wycislo et al (2008) developed a method using digital images of grapefruits to determine their size and shape characteristics such as major minor axis ratio, shape factor and compactness. Rashidi et al (2009) measured the volume of cantaloupe (Cucumis melo) using both image processing and water displacement methods. Fıratlıgil-Durmuş et al (2010) measured the projected area, equivalent diameter, perimeter, maxferet, minferet, circularity, elongation and thickness of bean and lentil seeds using an image analysis system. Omid et al (2010) measured the volume and mass of lemon, lime, orange and tangerine fruits using an image process method. Ercisli et al (2012) used an image processing system to determine the size and shape properties of ten walnut (Juglans regia L.) cultivars such as geometric mean diameter, sphericity, surface area, volume, shape factor, compactness, elongation ÖZET
Bu çalışmada, dijital görüntüler üzerinde görüntü işleme metodu kullanılarak 12 farklı fasulye çeşidinin (11 adet varyete ve 1 adet genotip) boyut ve şekil özellikleri belirlenmiş ve bu özelliklerine bağlı olarak gruplandırılmıştır. Bu çalışmadaki en yüksek geometrik ortalama çap, izdüşüm alanı, uzunluk, genişlik ve şekil faktörü ortalamaları ‘Çayırlı’ genotipinde belirlenmiştir. En yüksek kalınlık ortalaması (6.0 mm) ‘Elkoca-05’ ve ‘Noyanbey-98’ çeşitlerinde ölçülmüştür. Diğer çeşitlerle karşılaştırıldığında genişlik oryantasyonuna göre daha dairesel olan ‘Terzibaba’ çeşidi en düşük kalınlık değerine (4.6 mm) sahiptir. ‘Karacaşehir–90’ çeşidinin geometrik ortalama çap, izdüşüm alanı, uzunluk ve genişlik değerleri en düşük ortalamaya sahip olurken, küresellik değerinin diğer çeşitlerden daha yüksek (% 70) olduğu bulunmuştur. ’Yunus–90’ ve ‘Göynük-98’ çeşitleri % 58.9 ortalama ile en düşük küresellik değerine sahiptir. Temel bileşenler analizi sonuçlarına göre, ilk bileşeni oluşturan en önemli değişkenlerin kütle, geometrik ortalama çap, yüzey alanı, hacim, izdüşüm alanı, eşdeğer çap, çevre ve uzunluk olduğu saptanmıştır. Şekilsel olarak ‘Aras–98’, ‘Elkoca–05’, ‘Göynük–98’, ‘Noyanbey–98’, ‘Yakutiye–98’ ve ‘Yunus–90’ çeşitlerinin oblong; ‘Karacaşehir–90’ ve ‘Önceler–98’ çeşitlerinin elipsoidal; ‘Akman–98’, ‘Kantar–05’ ve ‘Terzibaba’ çeşitlerinin basık ve ‘Çayırlı’ genotipinin tam basık olduğu belirlenmiştir. Fasulye çeşitlerinin boyut ve şekil özellikleri taşıma, ayırma ve sınıflandırma sistemlerinin ve ekim makinalarının ekici düzenlerinin tasarımı açısından oldukça önemli parametrelerdir. Bu nedenle fasulye çeşitlerinin boyut ve şekil özelliklerine ait veriler çoğunlukla mühendislerin, makine üreticilerinin ve makine tasarımcılarının ilgi alanına girmektedir.
Anahtar Kelimeler: Fasulye; Görüntü işleme; Şekil; Küresellik; İzdüşüm alanı
Türkiye’de Tescilli Fasulye (Phaseolus vulgaris L.) Çeşitlerinin Dijital Fotoğraflama Kullanılarak Boyut ve Şekil Analizi, Kara et al
Ta r ı m B i l i m l e r i D e r g i s i – J o u r n a l o f A g r i c u l t u r a l S c i e n c e s 19 (2013) 219-234
221
and shape index. Sayinci et al (2012) determined the size and shape of some orange cultivars. Boydas et al (2012) measured the physical properties of loquat (Eriobotrya japonica [Thunb. Lindl.]) cultivars using image process and classical methods. Yurtlu & Yeşiloğlu (2011) determined the physical and mechanical properties of chestnuts.
Information on the size and shape features of bean cultivars such as their dimensions (length, width and thickness), projected area, mass, volume, elongation at different orientations and sphericity is considerably important in the design of seed metering mechanisms of seed drills, separating, sizing and handling systems. Therefore, the objective of the study was to determine the size and shape of 11 registered common bean cultivars and a genotype grown in Turkey. An image processing system, which is an effective method for automated assessments, was used in order to determine the physical properties of bean.
2. Material and Methods
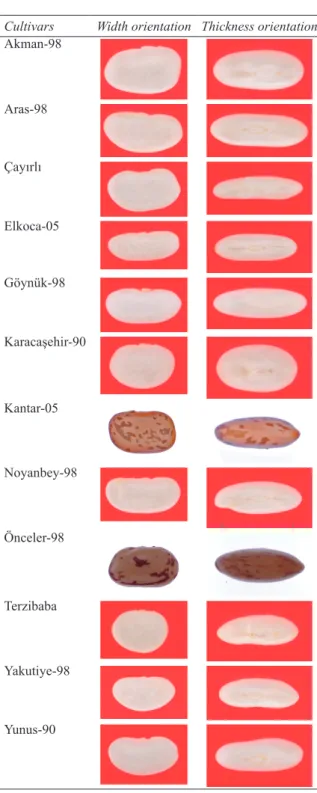
In this study, 11 registered common bean cultivars (‘Akman-98’, ‘Aras-98’, ‘Elkoca-05’, ‘Göynük-98’, ‘Karacaşehir-90’, ‘Kantar-05’, ‘Noyanbey-98’, ‘Önceler-98’, ‘Terzibaba’, ‘Yakutiye-98’ and ‘Yunus-90’) and a genotype (‘Çayırlı’) were studied (Figure 1). In order to determine the size and shape properties of common bean cultivars, image-processing method was used. The digital photographs of seeds were taken in a dark room by a Nikon D300 digital SLR camera. The camera was fixed on a frame in a position perpendicular to a fiberglass surface at fixed height of 35 cm. The seeds were placed on the transparent fiberglass plate in the matrix form of 2×5 at two orientations, namely width and thickness orientations (Figure 2). In order to position seeds on the fiberglass with dimensions of 10×7 cm in two orientations, putty was used. The width orientation represents the natural position of the seeds on horizontal surface. Therefore, the digital images taken in two orientations of the seeds were possible to determine the size and shape properties. The color of fiberglass was selected opposite to the color of seeds. A ruler with intervals of 1 mm was
Cultivars Width orientation Thickness orientation
Akman-98 Aras-98 Çayırlı Elkoca-05 Göynük-98 Karacaşehir-90 Kantar-05 Noyanbey-98 Önceler-98 Terzibaba Yakutiye-98 Yunus-90
Figure 1- Bean cultivars Şekil 1- Fasulye çeşitleri
Seed Size and Shape Analysis of Registered Common Bean (Phaseolus vulgaris L.) Cultivars in Turkey Using Digital Photography, Kara et al
Ta r ı m B i l i m l e r i D e r g i s i – J o u r n a l o f A g r i c u l t u r a l S c i e n c e s 19 (2013) 219-234
222
Width orientation Thickness orientation
Figure 2- The length, width and thickness of the bean seed Şekil 2- Fasulye tohumunun uzunluk, genişlik ve kalınlığı
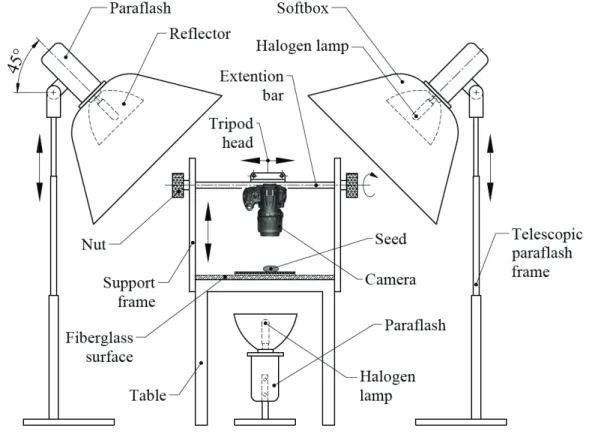
Figure 3- Image acquisition system Şekil 3- Görüntüleme sistemi
Türkiye’de Tescilli Fasulye (Phaseolus vulgaris L.) Çeşitlerinin Dijital Fotoğraflama Kullanılarak Boyut ve Şekil Analizi, Kara et al
Ta r ı m B i l i m l e r i D e r g i s i – J o u r n a l o f A g r i c u l t u r a l S c i e n c e s 19 (2013) 219-234
223
placed beside the fiberglass plate to converse pixelto mm. The unit conversion ratio of the images was 46.2 pixels mm-1. A cable release was used to
prevent the vibration during the shooting. In order to capture an image without shadow on the surface, three paraflashes were positioned in three different directions (Figure 3). Two softboxes were mounted on two paraflashes and placed over the fiberglass plate with an angle of 45o. The third paraflash was
placed under the fiberglass plate with a distance of 20 cm.
The light intensity was adjusted by an exposure meter. The light intensity of the paraflash under the fiberglass plate was higher than those of the paraflashes above the fiberglass plate. SigmaScan®Pro 5.0 software was used to process the images. The pixel value corresponding to the 100 mm distance was used for calibration in the photo images. The projected area (PA, mm2), perimeter (P, mm), equivalent diameter, major and minor axis lengths and shape factor (SF) were determined for each seed at width and thickness orientation using SigmaScan®Pro 5.0 software. The major length measured at the width orientation means the length (L, mm) of seed, the minor axis length measured at the width orientation means the width (W, mm) of seed, the minor axis length measured at the thickness orientation means thickness (T, mm) of seed. The major axis length measured at the width orientation was the same with one measured at the thickness orientation. The surface area (S, mm2), elongation, geometric mean diameter (Dg, mm) and sphericity (φ, %) were calculated for each seed using the following equations (L: length, mm; W: width, mm;
T: thickness, mm) (Mohsenin 1986):
5
thickness, mm) (Mohsenin 1986):
(1)
(2)
Elongation, the ratio of major axis length to minor axis length (Fıratlıgil-Durmus et al 2010), was calculated for three orientations: Elongation at the width orientation (Ew);
Ew = L / W (3)
Elongation at the thickness orientation (Et);
Et = L / T (4)
Elongation at the vertical orientation (Ev);
Ev = W / T (5)
The cultivars were classified according to Şehrali (1988): ellipticus (ellipsoid and L/W = 1.51-1.71),
oblongus (long cylindroid, kidney shaped and L/W = 1.85-2.31), subcompressus (subcompressed, long
and (W/T)×L = 1.29-2.08), and compressus (more compressed, broad and (W/T)×L= 2.17-3.51). The shape factor (SF), determined by the software automatically, was calculated using the following equation (PA: projected area, mm2; P: perimeter, mm) (SigmaScan®Pro 2004):
(6)
The surface area of the seeds (S, mm2) was calculated from the below equation (McCabe et al 1986; Olajide &Ade-Omowaye 1999):
(7)
The calculated volume values of the seeds (V, cm3) was determined using the below equation.
(8)
Seed mass values were determined using an electronic balance reading to 0.001 g. The toluene (C7H8) displacement method was used to determine experimental volume and true density of the seeds. The moisture content of the seeds was determined using an oven set at 105 °C for 24 hours. All the tests were conducted at the Biological Material and Image Processing Laboratory. In order to determine the size and shape properties of 12 common bean cultivars, 200 seeds were selected randomly for each cultivar, totaling 2400 seeds. A completely randomized design and SPSS statistical software were used for analysis of variance with a 95% confidence level (P = 0.05) and Duncan’s multiple comparison test to determine significant differences (IBM SPSS® Statistics 2010).The data was subjected to Principal Component Analysis (PCA) in order to test the variables of 12 common bean cultivars in groups. The relationships between multiple variables were determined and the common bean cultivars were grouped using a covariance matrix obtained from the mean values of the size and shape properties of the cultivars and the output data sets including Eigen values and vectors and principal component scores.
3. Results and Discussion
The mean values of moisture content, seed mass, thousand seed mass, and true density of the common bean cultivars investigated in the study are presented in Table 1. The mean values of moisture content of the cultivars varied in the range of 3.39-6.40% (dry basis), the mean seed mass in the range of 0.180-0.656 g, and thousand seed mass in the range of 180-656 g. ‘Çayırlı’ genotype had the highest value of seed mass (0.656 g), followed by ‘Elkoca-05’ (0.462 g), ‘Göynük-98’ (0.450 g), and ‘Yakutiye-98’ (0.447 g). The differences between the mean values of seed mass for these three cultivars were not statistically
(1)
5
thickness, mm) (Mohsenin 1986):
(1)
(2)
Elongation, the ratio of major axis length to minor axis length (Fıratlıgil-Durmus et al 2010), was calculated for three orientations: Elongation at the width orientation (Ew);
Ew = L / W (3)
Elongation at the thickness orientation (Et);
Et = L / T (4)
Elongation at the vertical orientation (Ev);
Ev = W / T (5)
The cultivars were classified according to Şehrali (1988): ellipticus (ellipsoid and L/W = 1.51-1.71),
oblongus (long cylindroid, kidney shaped and L/W = 1.85-2.31), subcompressus (subcompressed, long
and (W/T)×L = 1.29-2.08), and compressus (more compressed, broad and (W/T)×L= 2.17-3.51). The shape factor (SF), determined by the software automatically, was calculated using the following equation (PA: projected area, mm2; P: perimeter, mm) (SigmaScan®Pro 2004):
(6)
The surface area of the seeds (S, mm2) was calculated from the below equation (McCabe et al 1986; Olajide &Ade-Omowaye 1999):
(7)
The calculated volume values of the seeds (V, cm3) was determined using the below equation.
(8)
Seed mass values were determined using an electronic balance reading to 0.001 g. The toluene (C7H8) displacement method was used to determine experimental volume and true density of the seeds. The moisture content of the seeds was determined using an oven set at 105 °C for 24 hours. All the tests were conducted at the Biological Material and Image Processing Laboratory. In order to determine the size and shape properties of 12 common bean cultivars, 200 seeds were selected randomly for each cultivar, totaling 2400 seeds. A completely randomized design and SPSS statistical software were used for analysis of variance with a 95% confidence level (P = 0.05) and Duncan’s multiple comparison test to determine significant differences (IBM SPSS® Statistics 2010).The data was subjected to Principal Component Analysis (PCA) in order to test the variables of 12 common bean cultivars in groups. The relationships between multiple variables were determined and the common bean cultivars were grouped using a covariance matrix obtained from the mean values of the size and shape properties of the cultivars and the output data sets including Eigen values and vectors and principal component scores.
3. Results and Discussion
The mean values of moisture content, seed mass, thousand seed mass, and true density of the common bean cultivars investigated in the study are presented in Table 1. The mean values of moisture content of the cultivars varied in the range of 3.39-6.40% (dry basis), the mean seed mass in the range of 0.180-0.656 g, and thousand seed mass in the range of 180-656 g. ‘Çayırlı’ genotype had the highest value of seed mass (0.656 g), followed by ‘Elkoca-05’ (0.462 g), ‘Göynük-98’ (0.450 g), and ‘Yakutiye-98’ (0.447 g). The differences between the mean values of seed mass for these three cultivars were not statistically
(2) Elongation, the ratio of major axis length to minor axis length (Fıratlıgil-Durmus et al 2010), was calculated for three orientations: Elongation at the width orientation (Ew);
Ew = L / W (3)
Elongation at the thickness orientation (Et);
Et = L / T (4)
Elongation at the vertical orientation (Ev);
Ev = W / T (5)
The cultivars were classified according to Şehrali (1988): ellipticus (ellipsoid and L/W = 1.51-1.71), oblongus (long cylindroid, kidney shaped and
L/W = 1.85-2.31), subcompressus (subcompressed,
long and (W/T)×L = 1.29-2.08), and compressus (more compressed, broad and (W/T)×L= 2.17-3.51). The shape factor (SF), determined by the software automatically, was calculated using the following equation (PA: projected area, mm2; P: perimeter, mm) (SigmaScan®Pro 2004):
SF = 4 π PA / P2 (6)
The surface area of the seeds (S, mm2) was calculated from the below equation (McCabe et al 1986; Olajide &Ade-Omowaye 1999):
5
thickness, mm) (Mohsenin 1986):
(1)
(2)
Elongation, the ratio of major axis length to minor axis length (Fıratlıgil-Durmus et al 2010), was calculated for three orientations: Elongation at the width orientation (Ew);
Ew = L / W (3)
Elongation at the thickness orientation (Et);
Et = L / T (4)
Elongation at the vertical orientation (Ev);
Ev = W / T (5)
The cultivars were classified according to Şehrali (1988): ellipticus (ellipsoid and L/W = 1.51-1.71),
oblongus (long cylindroid, kidney shaped and L/W = 1.85-2.31), subcompressus (subcompressed, long
and (W/T)×L = 1.29-2.08), and compressus (more compressed, broad and (W/T)×L= 2.17-3.51). The shape factor (SF), determined by the software automatically, was calculated using the following equation (PA: projected area, mm2; P: perimeter, mm) (SigmaScan®Pro 2004):
(6)
The surface area of the seeds (S, mm2) was calculated from the below equation (McCabe et al 1986; Olajide &Ade-Omowaye 1999):
(7)
The calculated volume values of the seeds (V, cm3) was determined using the below equation.
(8)
Seed mass values were determined using an electronic balance reading to 0.001 g. The toluene (C7H8) displacement method was used to determine experimental volume and true density of the seeds. The moisture content of the seeds was determined using an oven set at 105 °C for 24 hours. All the tests were conducted at the Biological Material and Image Processing Laboratory. In order to determine the size and shape properties of 12 common bean cultivars, 200 seeds were selected randomly for each cultivar, totaling 2400 seeds. A completely randomized design and SPSS statistical software were used for analysis of variance with a 95% confidence level (P = 0.05) and Duncan’s multiple comparison test to determine significant differences (IBM SPSS® Statistics 2010).The data was subjected to Principal Component Analysis (PCA) in order to test the variables of 12 common bean cultivars in groups. The relationships between multiple variables were determined and the common bean cultivars were grouped using a covariance matrix obtained from the mean values of the size and shape properties of the cultivars and the output data sets including Eigen values and vectors and principal component scores.
3. Results and Discussion
The mean values of moisture content, seed mass, thousand seed mass, and true density of the common bean cultivars investigated in the study are presented in Table 1. The mean values of moisture content of the cultivars varied in the range of 3.39-6.40% (dry basis), the mean seed mass in the range of 0.180-0.656 g, and thousand seed mass in the range of 180-656 g. ‘Çayırlı’ genotype had the highest value of seed mass (0.656 g), followed by ‘Elkoca-05’ (0.462 g), ‘Göynük-98’ (0.450 g), and ‘Yakutiye-98’ (0.447 g). The differences between the mean values of seed mass for these three cultivars were not statistically
(7) The calculated volume values of the seeds (V, cm3) was determined using the below equation.
5
thickness, mm) (Mohsenin 1986):
(1)
(2)
Elongation, the ratio of major axis length to minor axis length (Fıratlıgil-Durmus et al 2010), was calculated for three orientations: Elongation at the width orientation (Ew);
Ew = L / W (3)
Elongation at the thickness orientation (Et);
Et = L / T (4)
Elongation at the vertical orientation (Ev);
Ev = W / T (5)
The cultivars were classified according to Şehrali (1988): ellipticus (ellipsoid and L/W = 1.51-1.71),
oblongus (long cylindroid, kidney shaped and L/W = 1.85-2.31), subcompressus (subcompressed, long
and (W/T)×L = 1.29-2.08), and compressus (more compressed, broad and (W/T)×L= 2.17-3.51). The shape factor (SF), determined by the software automatically, was calculated using the following equation (PA: projected area, mm2; P: perimeter, mm) (SigmaScan®Pro 2004):
(6)
The surface area of the seeds (S, mm2) was calculated from the below equation (McCabe et al 1986; Olajide &Ade-Omowaye 1999):
(7)
The calculated volume values of the seeds (V, cm3) was determined using the below equation.
(8)
Seed mass values were determined using an electronic balance reading to 0.001 g. The toluene (C7H8) displacement method was used to determine experimental volume and true density of the seeds. The moisture content of the seeds was determined using an oven set at 105 °C for 24 hours. All the tests were conducted at the Biological Material and Image Processing Laboratory. In order to determine the size and shape properties of 12 common bean cultivars, 200 seeds were selected randomly for each cultivar, totaling 2400 seeds. A completely randomized design and SPSS statistical software were used for analysis of variance with a 95% confidence level (P = 0.05) and Duncan’s multiple comparison test to determine significant differences (IBM SPSS® Statistics 2010).The data was subjected to Principal Component Analysis (PCA) in order to test the variables of 12 common bean cultivars in groups. The relationships between multiple variables were determined and the common bean cultivars were grouped using a covariance matrix obtained from the mean values of the size and shape properties of the cultivars and the output data sets including Eigen values and vectors and principal component scores.
3. Results and Discussion
The mean values of moisture content, seed mass, thousand seed mass, and true density of the common bean cultivars investigated in the study are presented in Table 1. The mean values of moisture content of the cultivars varied in the range of 3.39-6.40% (dry basis), the mean seed mass in the range of 0.180-0.656 g, and thousand seed mass in the range of 180-656 g. ‘Çayırlı’ genotype had the highest value of seed mass (0.656 g), followed by ‘Elkoca-05’ (0.462 g), ‘Göynük-98’ (0.450 g), and ‘Yakutiye-98’ (0.447 g). The differences between the mean values of seed mass for these three cultivars were not statistically
(8) Seed mass values were determined using an electronic balance reading to 0.001 g. The toluene (C7H8) displacement method was used to determine experimental volume and true density of the seeds. The moisture content of the seeds was determined using an oven set at 105 °C for 24 hours. All the tests were conducted at the Biological Material and Image Processing Laboratory. In order to determine the size and shape properties of 12 common bean cultivars, 200 seeds were selected randomly for each cultivar, totaling 2400 seeds. A completely randomized design and SPSS statistical software were used for analysis of variance with a 95% confidence level (P = 0.05) and Duncan’s multiple comparison test to determine significant differences (IBM SPSS® Statistics 2010).The data was subjected to Principal Component Analysis (PCA) in order to test the variables of 12 common bean cultivars in groups. The relationships between multiple variables were determined and the common bean cultivars were grouped using a covariance matrix
Seed Size and Shape Analysis of Registered Common Bean (Phaseolus vulgaris L.) Cultivars in Turkey Using Digital Photography, Kara et al
Ta r ı m B i l i m l e r i D e r g i s i – J o u r n a l o f A g r i c u l t u r a l S c i e n c e s 19 (2013) 219-234
224
obtained from the mean values of the size and shape properties of the cultivars and the output data sets including Eigen values and vectors and principal component scores.
3. Results and Discussion
The mean values of moisture content, seed mass, thousand seed mass, and true density of the common bean cultivars investigated in the study are presented in Table 1. The mean values of moisture content of the cultivars varied in the range of 3.39-6.40% (dry basis), the mean seed mass in the range of 0.0.656 g, and thousand seed mass in the range of 180-656 g. ‘Çayırlı’ genotype had the highest value of seed mass (0.656 g), followed by ‘Elkoca-05’ (0.462 g), ‘Göynük-98’ (0.450 g), and ‘Yakutiye-98’ (0.447 g). The differences between the mean values of seed mass for these three cultivars were not statistically significant. ‘Karacaşehir-90’ had the lowest seed mass value (0.180 g). In a study by Güvenç & Güngör (1996), thousand seed mass values of seven common bean cultivars varied between 209.1 and 467.6 g. Firatlıgil-Durmuş et al (2010) also determined the thousand seed mass values of
seven common bean cultivars as between 171.7 and 613.2 g. In a previous study, the highest value of thousand seed mass was obtained as approximately 751.8 g (at the moisture content of 18.33%) with ‘Barbunia’ (Cetin 2007). The highest mean values of true density of the cultivars was obtained with ‘Göynük-98’ (1.305 g cm-3) and ‘Karacaşehir-90’
(1.317 g cm-3). The lowest true density among the
cultivars belonged to ‘Önceler-98’ with the value of 1.309 g cm-3. This value is similar to that reported by
Fıratlıgil-Durmuş et al (2010) approximately 1.220 g cm-3 for ‘White speckled red bean’ (from Czech
Republic). Mean value of true density of ‘Kantar-05’ (1.279 g cm-3) is almost the same as that reported by
Ozturk et al (2010) for the same cultivar.
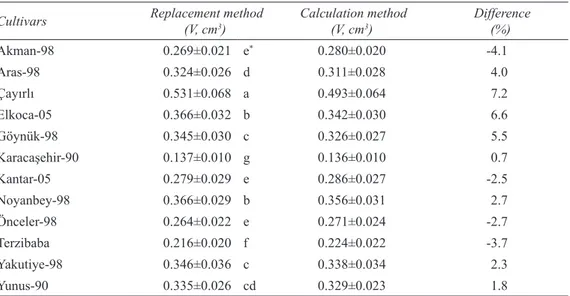
The mean values of seed volume of common bean cultivars determined by the replacement method were given in Table 2. The seed volume value was the highest (0.531 cm3) in ‘Çayırlı’ and the lowest (0.137 cm3) in ‘Karacaşehir-90’. The second highest seed volume value (0.336 cm3) was determined in ‘Elkoca-05’. ‘Göynük-98’ and ‘Yakutiye-98’ had the almost close values of 0.345 cm3 and 0.346 cm3, respectively.
Fıratlıgil-Table 1- Moisture content and some gravimetric properties of bean cultivars (mean±standard deviation) Çizelge 1- Fasulye çeşitlerinin bazı kütlesel özellikleri ve nem içeriği (ort.±standart sapma)
Cultivars Moisture content
(%) Seed mass(g) Thousand seed mass(g) True density(g cm-3)
Akman-98 4.11 0.344±0.048 d* 341.8±23.9 d 1.279±0.035 c Aras-98 3.97 0.418±0.075 c 417.7±32.1 c 1.291±0.030 bc Çayırlı 4.63 0.656±0.147 a 656.1±89.4 a 1.235±0.052 e Elkoca-05 3.39 0.462±0.089 b 461.7±42.7 b 1.263±0.024 d Göynük-98 4.48 0.450±0.089 b 449.6±38.5 b 1.305±0.026 ab Karacaşehir-90 5.55 0.180±0.027 g 179.8±14.0 g 1.317±0.040 a Kantar-05 5.06 0.355±0.065 d 355.5±29.8 d 1.279±0.058 c Noyanbey-98 4.52 0.455±0.084 b 455.2±39.0 b 1.244±0.025 e Önceler-98 4.62 0.314±0.051 e 314.3±24.1 e 1.192±0.030 f Terzibaba 6.40 0.272±0.053 f 272.4±25.6 f 1.260±0.029 d Yakutiye-98 3.82 0.447±0.078 b 446.5±43.4 b 1.290±0.025 bc Yunus-90 4.55 0.413±0.078 c 412.6±30.7 c 1.231±0.026 e
Türkiye’de Tescilli Fasulye (Phaseolus vulgaris L.) Çeşitlerinin Dijital Fotoğraflama Kullanılarak Boyut ve Şekil Analizi, Kara et al
Ta r ı m B i l i m l e r i D e r g i s i – J o u r n a l o f A g r i c u l t u r a l S c i e n c e s 19 (2013) 219-234
225
Durmuş et al (2010) determined the seed volume using the volume equation of ellipsoid, compared these calculated values to the experimental volume values, and reported that the values were close to each other. In our study, the difference between replacement method and calculation method was the highest (7.2%) for ‘Çayırlı’, which had the highest seed mass value and the lowest (0.7%) for ‘Karacaşehir-90’, which had the lowest seed mass value.
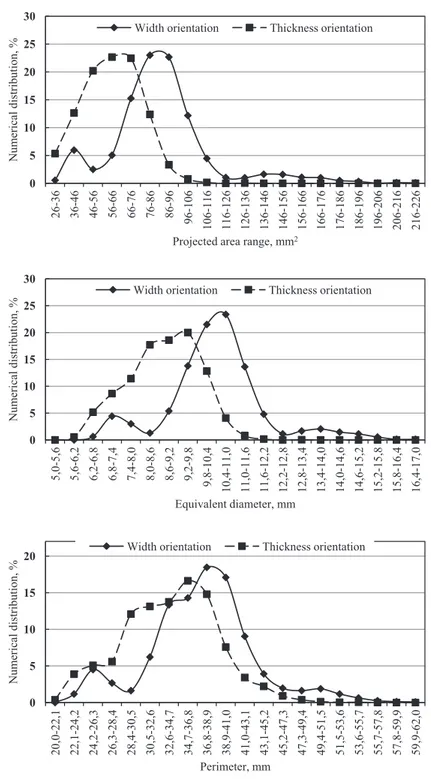
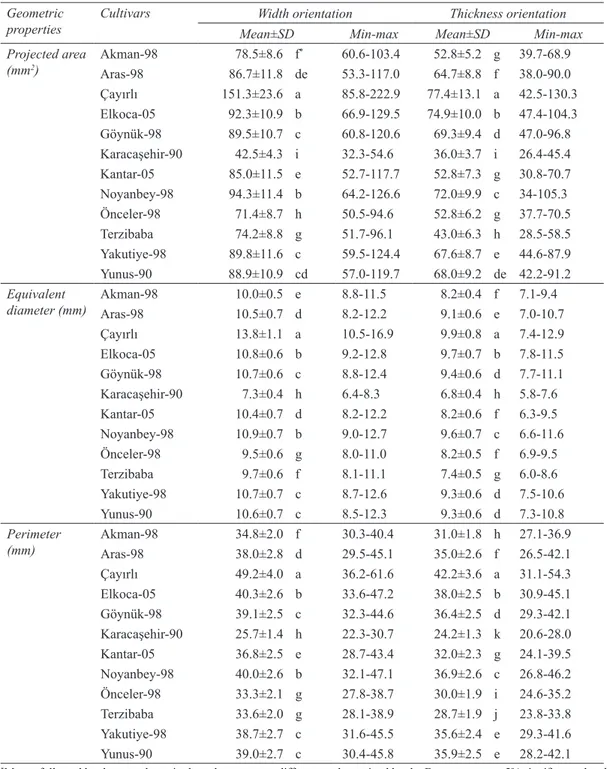
The means of projected area, equivalent diameter and perimeter determined at the width orientation were higher than those of the thickness orientation (Figure 4). In this study, the minimum and maximum values of projected area, equivalent diameter, and perimeter were 32.3-222.9 mm2, 6.4-16.8 mm, and 22.3-61.6 mm for width orientation, and 26.4-130.2 mm2, 5.8-12.9 mm, and 20.6-54.3 mm for thickness orientation. These data are in agreement with those reported by Fıratlıgil-Durmuş et al (2010) for seven common bean cultivars (projected area: 30.5-167.2 mm2, equivalent diameter: 6.2-14.6 mm, and
perimeter: 20.5-99.4 mm). The value of projected area ranged between 56 and 116 mm2 at the width orientation for 91% of all seeds and 26 and 86 mm2 at the thickness orientation for 96% of all seeds. The value of equivalent diameter ranged between 6.8 and 12.2 mm at the width orientation for 91% of all seeds and between 6.2 and 10.4 mm at the thickness orientation for 94% of all seeds. The value of perimeter ranged between 24.2 and 45.2 mm at the width orientation for 91% of all seeds and between 22.1 and 43.1 mm at the thickness orientation for 96% of all seeds.
The projected area, equivalent diameter, and perimeter values determined at the width and thickness orientations were presented in Table 3. The highest values of projected area, equivalent diameter, and perimeter were obtained with ‘Çayırlı’ while the lowest values with ‘Karacaşehir-90’ at both orientations. The data showed that the relationship between the means of the gravimetric and the geometric properties of the cultivars was a positive association. The differences between the means
Table 2- Mean values of seed volume determined by the replacement method and calculation method and the differences between two methods (mean±standard deviation)
Çizelge 2- Yerdeğiştirme ve hesaplama metotlarıyla belirlenen ortalama tane hacmi ve iki metot arasındaki fark (ort.±standart sapma)
Cultivars Replacement method(V, cm3) Calculation method(V, cm3) Difference(%)
Akman-98 0.269±0.021 e* 0.280±0.020 -4.1 Aras-98 0.324±0.026 d 0.311±0.028 4.0 Çayırlı 0.531±0.068 a 0.493±0.064 7.2 Elkoca-05 0.366±0.032 b 0.342±0.030 6.6 Göynük-98 0.345±0.030 c 0.326±0.027 5.5 Karacaşehir-90 0.137±0.010 g 0.136±0.010 0.7 Kantar-05 0.279±0.029 e 0.286±0.027 -2.5 Noyanbey-98 0.366±0.029 b 0.356±0.031 2.7 Önceler-98 0.264±0.022 e 0.271±0.024 -2.7 Terzibaba 0.216±0.020 f 0.224±0.022 -3.7 Yakutiye-98 0.346±0.036 c 0.338±0.034 2.3 Yunus-90 0.335±0.026 cd 0.329±0.023 1.8
Seed Size and Shape Analysis of Registered Common Bean (Phaseolus vulgaris L.) Cultivars in Turkey Using Digital Photography, Kara et al
Ta r ı m B i l i m l e r i D e r g i s i – J o u r n a l o f A g r i c u l t u r a l S c i e n c e s 19 (2013) 219-234
226
8 Figure 4- Numerical distribution of some geometric properties determined at two different orientations of seed
Şekil 4- Tohumun iki farklı oryantasyonunda belirlenen bazı geometrik özelliklerin sayısal dağılımı
0 5 10 15 20 25 30 26 -36 36 -46 46 -56 56 -66 66 -76 76 -86 86 -96 96 -106 106 -116 116 -126 126 -136 136 -146 146 -156 156 -166 166 -176 176 -186 186 -196 196 -206 206 -216 216 -226 Num eri ca l distri buti on, %
Projected area range, mm2
Width orientation Thickness orientation
0 5 10 15 20 25 30 5, 0-5, 6 5, 6-6, 2 6, 2-6, 8 6, 8-7, 4 7, 4-8, 0 8, 0-8, 6 8, 6-9, 2 9, 2-9, 8 9, 8-10, 4 10 ,4 -11 ,0 11 ,0 -11 ,6 11 ,6 -12 ,2 12 ,2 -12 ,8 12 ,8 -13 ,4 13 ,4 -14 ,0 14 ,0 -14 ,6 14 ,6 -15 ,2 15 ,2 -15 ,8 15 ,8 -16 ,4 16 ,4 -17 ,0 Num eri ca l distri buti on, % Equivalent diameter, mm
Width orientation Thickness orientation
0 5 10 15 20 20, 0-22, 1 22, 1-24, 2 24, 2-26, 3 26, 3-28, 4 28, 4-30, 5 30, 5-32, 6 32, 6-34, 7 34, 7-36, 8 36, 8-38, 9 38, 9-41, 0 41, 0-43, 1 43, 1-45, 2 45, 2-47, 3 47, 3-49, 4 49, 4-51, 5 51, 5-53, 6 53, 6-55, 7 55, 7-57, 8 57, 8-59, 9 59, 9-62, 0 Num eri ca l distri buti on, % Perimeter, mm
Width orientation Thickness orientation
Figure 4- Numerical distribution of some geometric properties determined at two different orientations of seed Şekil 4- Tohumun iki farklı oryantasyonunda belirlenen bazı geometrik özelliklerin sayısal dağılımı
Türkiye’de Tescilli Fasulye (Phaseolus vulgaris L.) Çeşitlerinin Dijital Fotoğraflama Kullanılarak Boyut ve Şekil Analizi, Kara et al
Ta r ı m B i l i m l e r i D e r g i s i – J o u r n a l o f A g r i c u l t u r a l S c i e n c e s 19 (2013) 219-234
227
Table 3- Some geometric properties of bean cultivarsÇizelge 3- Fasulye çeşitlerinin bazı geometrik özellikleri Geometric
properties Cultivars Mean±SDWidth orientationMin-max Mean±SDThickness orientationMin-max Projected area (mm2) Akman-98 78.5±8.6 f * 60.6-103.4 52.8±5.2 g 39.7-68.9 Aras-98 86.7±11.8 de 53.3-117.0 64.7±8.8 f 38.0-90.0 Çayırlı 151.3±23.6 a 85.8-222.9 77.4±13.1 a 42.5-130.3 Elkoca-05 92.3±10.9 b 66.9-129.5 74.9±10.0 b 47.4-104.3 Göynük-98 89.5±10.7 c 60.8-120.6 69.3±9.4 d 47.0-96.8 Karacaşehir-90 42.5±4.3 i 32.3-54.6 36.0±3.7 i 26.4-45.4 Kantar-05 85.0±11.5 e 52.7-117.7 52.8±7.3 g 30.8-70.7 Noyanbey-98 94.3±11.4 b 64.2-126.6 72.0±9.9 c 34-105.3 Önceler-98 71.4±8.7 h 50.5-94.6 52.8±6.2 g 37.7-70.5 Terzibaba 74.2±8.8 g 51.7-96.1 43.0±6.3 h 28.5-58.5 Yakutiye-98 89.8±11.6 c 59.5-124.4 67.6±8.7 e 44.6-87.9 Yunus-90 88.9±10.9 cd 57.0-119.7 68.0±9.2 de 42.2-91.2 Equivalent
diameter (mm) Akman-98Aras-98 10.0±0.5 e10.5±0.7 d 8.8-11.58.2-12.2 8.2±0.4 f9.1±0.6 e 7.1-9.47.0-10.7
Çayırlı 13.8±1.1 a 10.5-16.9 9.9±0.8 a 7.4-12.9 Elkoca-05 10.8±0.6 b 9.2-12.8 9.7±0.7 b 7.8-11.5 Göynük-98 10.7±0.6 c 8.8-12.4 9.4±0.6 d 7.7-11.1 Karacaşehir-90 7.3±0.4 h 6.4-8.3 6.8±0.4 h 5.8-7.6 Kantar-05 10.4±0.7 d 8.2-12.2 8.2±0.6 f 6.3-9.5 Noyanbey-98 10.9±0.7 b 9.0-12.7 9.6±0.7 c 6.6-11.6 Önceler-98 9.5±0.6 g 8.0-11.0 8.2±0.5 f 6.9-9.5 Terzibaba 9.7±0.6 f 8.1-11.1 7.4±0.5 g 6.0-8.6 Yakutiye-98 10.7±0.7 c 8.7-12.6 9.3±0.6 d 7.5-10.6 Yunus-90 10.6±0.7 c 8.5-12.3 9.3±0.6 d 7.3-10.8 Perimeter (mm) Akman-98Aras-98 34.8±2.0 f38.0±2.8 d 30.3-40.429.5-45.1 31.0±1.8 h35.0±2.6 f 27.1-36.926.5-42.1 Çayırlı 49.2±4.0 a 36.2-61.6 42.2±3.6 a 31.1-54.3 Elkoca-05 40.3±2.6 b 33.6-47.2 38.0±2.5 b 30.9-45.1 Göynük-98 39.1±2.5 c 32.3-44.6 36.4±2.5 d 29.3-42.1 Karacaşehir-90 25.7±1.4 h 22.3-30.7 24.2±1.3 k 20.6-28.0 Kantar-05 36.8±2.5 e 28.7-43.4 32.0±2.3 g 24.1-39.5 Noyanbey-98 40.0±2.6 b 32.1-47.1 36.9±2.6 c 26.8-46.2 Önceler-98 33.3±2.1 g 27.8-38.7 30.0±1.9 i 24.6-35.2 Terzibaba 33.6±2.0 g 28.1-38.9 28.7±1.9 j 23.8-33.8 Yakutiye-98 38.7±2.7 c 31.6-45.5 35.6±2.4 e 29.3-41.6 Yunus-90 39.0±2.7 c 30.4-45.8 35.9±2.5 e 28.2-42.1
Seed Size and Shape Analysis of Registered Common Bean (Phaseolus vulgaris L.) Cultivars in Turkey Using Digital Photography, Kara et al
Ta r ı m B i l i m l e r i D e r g i s i – J o u r n a l o f A g r i c u l t u r a l S c i e n c e s 19 (2013) 219-234
228
of ‘Göynük-98’, ‘Yakutiye-98’, and ‘Yunus-90’ cultivars were not statistically significant for above parameters determined at width orientation.
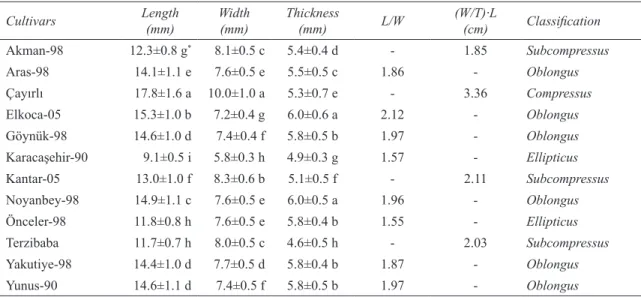
The mean values of length, width, and thickness of common bean cultivars were given in Table 4. The minimum and maximum values ranged between 7.8 and 22.6 mm for length, 4.9 and 11.8 mm for width, and 2.3 and 7.7 mm for thickness. The highest value of length was obtained in ‘Çayırlı’ (17.8 mm), followed by ‘Elkoca-05’ (15.3 mm). The mean values of length were similar to each other for ‘Göynük-98’ (14.6 mm), ‘Yakutiye-98’ (14.4 mm), and ‘Yunus-90’ (14.6 mm). In addition, ‘Önceler-98’ (11.8 mm) and ‘Terzibaba’ (11.7 mm) had a close value. Güvenç & Güngör (1996) reported that the mean values of length for seven common bean cultivars varied between 8.6 and 15.0 mm, supporting our results. In the literature, ‘Barbunia’ followed the ‘Çayırlı’ with a length of 16.68 mm (Cetin 2007). ‘Karacaşehir-90’ had the lowest mean value in terms of length (9.1 mm) and width (5.8 mm). ‘Aras-98’, ‘Noyanbey-98’, and ‘Önceler-98’
had the same mean value of width (7.6 mm). Moreover, the value of width of ‘Göynük-98’ and ‘Yunus-90’ was 7.4 mm. The highest value of width (10.0 mm) was measured in ‘Çayırlı’. The highest value of thickness was obtained with ‘Elkoca-05’ (6.0 mm) and ‘Noyanbey-98’ (6.0 mm) as the lowest value was obtained with ‘Terzibaba’ (4.6 mm). ‘Göynük-98’, ‘Önceler-98’, ‘Yakutiye-98’, and ‘Yunus-90’ had the same value of thickness value of 5.8 mm. Cetin (2007) reported the thickness value of ‘Barbunia’ as 7.51 mm at the moisture content of 18.33%. As seen from Table 4, the common been cultivars were classified according to their size and shape (Şehrali 1988). Six cultivars were oblongus, two cultivars were ellipticus, three cultivars were subcompressus, and ‘Çayırlı’ genotype was
compressus.
As physical properties of agricultural materials, the geometric mean diameter and surface area are functions of the values of length, width, and thickness. Sphericity, defined as the ratio of geometric mean diameter to the greater diameter
Table 4- Length, width and thickness values of the bean cultivars (mean±standard deviation) and classification regarding the shape properties
Çizelge 4- Fasulye çeşitlerinin uzunluk, genişlik ve kalınlık değerleri (ort.±standart sapma) ve şekil özelliklerine göre sınıflandırma
Cultivars Length(mm) Width(mm) Thickness(mm) L/W (W/T)·L(cm) Classification
Akman-98 12.3±0.8 g* 8.1±0.5 c 5.4±0.4 d - 1.85 Subcompressus Aras-98 14.1±1.1 e 7.6±0.5 e 5.5±0.5 c 1.86 - Oblongus Çayırlı 17.8±1.6 a 10.0±1.0 a 5.3±0.7 e - 3.36 Compressus Elkoca-05 15.3±1.0 b 7.2±0.4 g 6.0±0.6 a 2.12 - Oblongus Göynük-98 14.6±1.0 d 7.4±0.4 f 5.8±0.5 b 1.97 - Oblongus Karacaşehir-90 9.1±0.5 i 5.8±0.3 h 4.9±0.3 g 1.57 - Ellipticus Kantar-05 13.0±1.0 f 8.3±0.6 b 5.1±0.5 f - 2.11 Subcompressus Noyanbey-98 14.9±1.1 c 7.6±0.5 e 6.0±0.5 a 1.96 - Oblongus Önceler-98 11.8±0.8 h 7.6±0.5 e 5.8±0.4 b 1.55 - Ellipticus Terzibaba 11.7±0.7 h 8.0±0.5 c 4.6±0.5 h - 2.03 Subcompressus Yakutiye-98 14.4±1.0 d 7.7±0.5 d 5.8±0.4 b 1.87 - Oblongus Yunus-90 14.6±1.1 d 7.4±0.5 f 5.8±0.5 b 1.97 - Oblongus
Türkiye’de Tescilli Fasulye (Phaseolus vulgaris L.) Çeşitlerinin Dijital Fotoğraflama Kullanılarak Boyut ve Şekil Analizi, Kara et al
Ta r ı m B i l i m l e r i D e r g i s i – J o u r n a l o f A g r i c u l t u r a l S c i e n c e s 19 (2013) 219-234
229
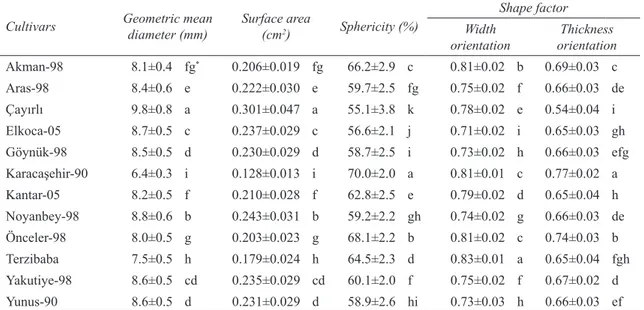
(Mohsenin 1986), has widely been used to express quantitatively the shape of an agricultural product (Kara 2012). Among the common bean cultivars, ‘Karacaşehir-90’ gave the lowest value of geometric mean diameter (6.4 mm) and the highest sphericity value (70%) (Table 5). The value of surface area of ‘Çayırlı’ (0.301 cm2) was higher 2.35 times higher than that of ‘Karacaşehir-90’ (0.128 cm2). The second highest value of surface area was determined in ‘Noyanbey-98’ (0.243 cm2). ‘Elkoca-05’ (0.237 cm2) had a similar surface area with ‘Yakutiye-98’ (0.235 cm2) while ‘Akman-98’ (0.206 cm2) had a similar surface area with ‘Önceler-98’ (0.203 cm2).
When the shape factor is one, it means that the seed is in circular form in a plane. In the study, the shape factor values of seeds were determined at two orientations, i.e., width and thickness. As can be observed in Table 5, the mean values of shape factor of the cultivars obtained at the thickness
orientation were in agreement with the mean values of sphericity.
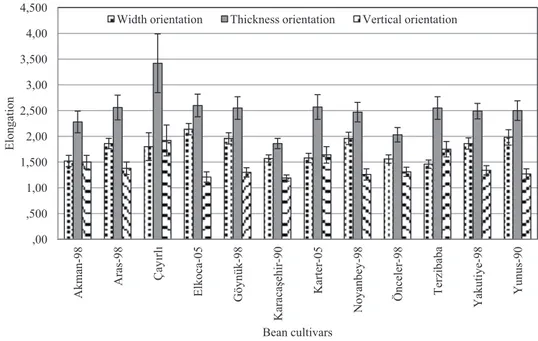
Figure 5 shows the mean elongation values of the common bean cultivars calculated for width, thickness, and vertical orientations. ‘Terzibaba’, shape factor of which is the highest value at the width orientation, had the lowest elongation value at the same orientation. While the shape factor of ‘Elkoca-05’ was the lowest mean value at the width orientation, its elongation value had the highest mean value at the same orientation. These results showed that there was a negative relationship between the shape factor determined at the width orientation and elongation values. The lowest elongation value (1.86) was obtained from thickness orientation for ‘Karacaşehir’ cultivar. The elongation value obtained from thickness orientation was the highest (3.42) in ‘Çayırlı’ cultivar. The means of shape factor of both cultivars determined at the thickness orientation was inversely correlated
Table 5- Means of geometric mean diameter, surface area, sphericity and shape factor of bean cultivars (mean±standard deviation)
Çizelge 5- Fasulye çeşitlerinin geometrik ortalama çap, yüzey alanı, küresellik ve şekil faktörü ortalamaları (ort.±standart sapma)
Cultivars Geometric mean diameter (mm) Surface area(cm2) Sphericity (%)
Shape factor Width
orientation orientationThickness
Akman-98 8.1±0.4 fg* 0.206±0.019 fg 66.2±2.9 c 0.81±0.02 b 0.69±0.03 c Aras-98 8.4±0.6 e 0.222±0.030 e 59.7±2.5 fg 0.75±0.02 f 0.66±0.03 de Çayırlı 9.8±0.8 a 0.301±0.047 a 55.1±3.8 k 0.78±0.02 e 0.54±0.04 i Elkoca-05 8.7±0.5 c 0.237±0.029 c 56.6±2.1 j 0.71±0.02 i 0.65±0.03 gh Göynük-98 8.5±0.5 d 0.230±0.029 d 58.7±2.5 i 0.73±0.02 h 0.66±0.03 efg Karacaşehir-90 6.4±0.3 i 0.128±0.013 i 70.0±2.0 a 0.81±0.01 c 0.77±0.02 a Kantar-05 8.2±0.5 f 0.210±0.028 f 62.8±2.5 e 0.79±0.02 d 0.65±0.04 h Noyanbey-98 8.8±0.6 b 0.243±0.031 b 59.2±2.2 gh 0.74±0.02 g 0.66±0.03 de Önceler-98 8.0±0.5 g 0.203±0.023 g 68.1±2.2 b 0.81±0.02 c 0.74±0.03 b Terzibaba 7.5±0.5 h 0.179±0.024 h 64.5±2.3 d 0.83±0.01 a 0.65±0.04 fgh Yakutiye-98 8.6±0.5 cd 0.235±0.029 cd 60.1±2.0 f 0.75±0.02 f 0.67±0.02 d Yunus-90 8.6±0.5 d 0.231±0.029 d 58.9±2.6 hi 0.73±0.03 h 0.66±0.03 ef
Seed Size and Shape Analysis of Registered Common Bean (Phaseolus vulgaris L.) Cultivars in Turkey Using Digital Photography, Kara et al
Ta r ı m B i l i m l e r i D e r g i s i – J o u r n a l o f A g r i c u l t u r a l S c i e n c e s 19 (2013) 219-234
230
with the elongation values. At the same orientation, the elongation values of ‘Elkoca-05’, ‘Kantar-05’, ‘Aras’, ‘Terzibaba’, ‘Göynük’, ‘Noyanbey’, ‘Yakutiye’ and ‘Yunus-90’ cultivars ranged from 2.47 to 2.60, values of which were considerably close each other. Shape factor obtained from thickness orientation for the same cultivars ranged from 0.65 to 0.67. The elongation values obtained from the vertical orientation changed 1.19 to 1.92. ‘Karacaşehir-90’ had the lowest elongation value while the highest elongation value was determined at the vertical orientation for ‘Çayırlı’ cultivar.
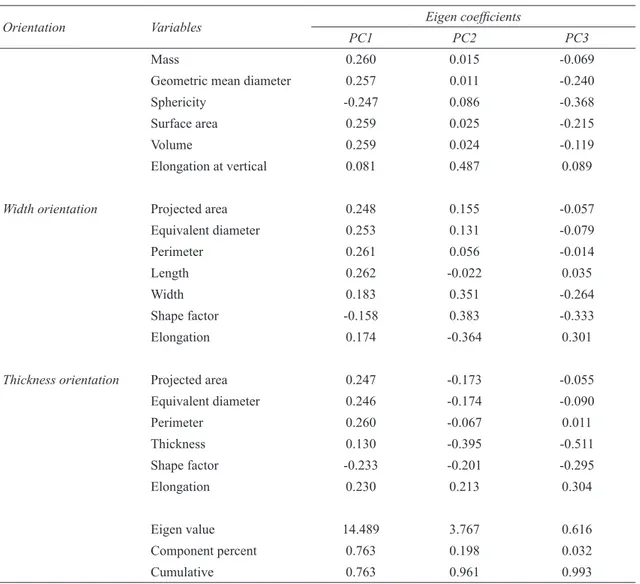
In order to explain the relationship between variables and detect the most important factors of variability, principal component analysis was applied to mean values. The principal components (PCs) showing the proportion and cumulative variance of the variables are presented in Table 6. The first three components, namely PC1, PC2, and PC3, formed 76.3%, 19.8%, and 3.2% of the variation, respectively, for a total of 99.3%. Considering the size properties, it can be concluded that the values
of length, width and thickness are correlated with the components PC1, PC2 and PC3. The variables of length and width had positive correlation with their components as the thickness variable had a negative correlation with its component.
The most important variables of PC1 are seed mass, geometric mean diameter, surface area, volume, projected area at two orientations, equivalent diameter, perimeter and length. PC1 was positively correlated with all variables. It can be said that these variables can ensure the grouping common bean cultivars in terms of the geometric and gravimetric properties. On the other hand, PC1 includes only length variables among the size variables and this means that the length variable is more important in grouping the cultivar than the other size variables. The elongation values determined at the length orientation, shape factor and width values determined at the width orientation are the most important variables of PC2, having a positive correlation. The elongation values determined at the width orientation is important variable of PC2
11
the same orientation, the elongation values of ‘Elkoca-05’, ‘Kantar-05’, ‘Aras’, ‘Terzibaba’, ‘Göynük’, ‘Noyanbey’, ‘Yakutiye’ and ‘Yunus-90’ cultivars ranged from 2.47 to 2.60, values of which were considerably close each other. Shape factor obtained from thickness orientation for the same cultivars ranged from 0.65 to 0.67. The elongation values obtained from the vertical orientation changed 1.19 to 1.92. ‘Karacaşehir-90’ had the lowest elongation value while the highest elongation value was determined at the vertical orientation for ‘Çayırlı’ cultivar.
Figure 5- Elongation values determined at three different orientations (width, thickness and vertical) Şekil 5- Üç farklı oryantasyonda (genişlik, kalınlık ve dik) belirlenen uzanım değerleri
In order to explain the relationship between variables and detect the most important factors of variability, principal component analysis was applied to mean values. The principal components (PCs) showing the proportion and cumulative variance of the variables are presented in Table 6. The first three components, namely PC1, PC2, and PC3, formed 76.3%, 19.8%, and 3.2% of the variation, respectively, for a total of 99.3%. Considering the size properties, it can be concluded that the values of length, width and thickness are correlated with the components PC1, PC2 and PC3. The variables of length and width had positive correlation with their components as the thickness variable had a negative correlation with its component.
The most important variables of PC1 are seed mass, geometric mean diameter, surface area, volume, projected area at two orientations, equivalent diameter, perimeter and length. PC1 was positively correlated with all variables. It can be said that these variables can ensure the grouping common bean cultivars in terms of the geometric and gravimetric properties. On the other hand, PC1 includes only length variables among the size variables and this means that the length variable is more important in grouping the cultivar than the other size variables. The elongation values determined at the length orientation, shape factor and width values determined at the width orientation are the most important variables of PC2, having a positive correlation. The elongation values determined at the width orientation is important variable of PC2 having a negative correlation. The variables in PC2 can ensure grouping the cultivars depending on shape factor and width values. In PC3, the shape factor values determined at the thickness orientation had a positive correlation.
,00 ,500 1,00 1,500 2,00 2,500 3,00 3,500 4,00 4,500 Akm an -98 Aras -98 Çay ırl ı El koca -05 Göy nük -98 Kara ca şehir -90 Kart er -05 Noy anbe y-98 Önce le r-98 Te rz iba ba Yakuti ye -98 Yunus -90 El ongat ion Bean cultivars
Width orientation Thickness orientation Vertical orientation
Figure 5- Elongation values determined at three different orientations (width, thickness and vertical) Şekil 5- Üç farklı oryantasyonda (genişlik, kalınlık ve dik) belirlenen uzanım değerleri
Türkiye’de Tescilli Fasulye (Phaseolus vulgaris L.) Çeşitlerinin Dijital Fotoğraflama Kullanılarak Boyut ve Şekil Analizi, Kara et al
Ta r ı m B i l i m l e r i D e r g i s i – J o u r n a l o f A g r i c u l t u r a l S c i e n c e s 19 (2013) 219-234
231
having a negative correlation. The variables in PC2 can ensure grouping the cultivars depending on shape factor and width values. In PC3, the shape factor values determined at the thickness orientation had a positive correlation.
Figure 6 shows the Eigen scores graph related to PC1 and PC2 explaining an important portion of variation. As can be observed in graph, ‘Çayırlı’ was significantly different from the other cultivars
in terms of size, shape, and gravimetric properties. It can be said that ‘Aras-98’, ‘Yakutiye-98’, ‘Göynük-98’, ‘Noyanbey-98’, ‘Yunus-90’, and ‘Elkoca-05’ took place in a second group in respect with their geometric and gravimetric properties. As a third group, ‘Terzibaba’, ‘Kantar-05’, and ‘Akman-98’ had lower length value, higher width value, and lower thickness value than the other cultivars. The cultivars of the third group had also more circular shape at the width orientation. In the
Table 6- Eigen values and coefficients related to shape and size properties of bean seeds Çizelge 6- Fasulye tanelerinin şekil ve boyut özellikleriyle ilgili Eigen değerleri ve katsayıları
Orientation Variables Eigen coefficients
PC1 PC2 PC3
Mass 0.260 0.015 -0.069
Geometric mean diameter 0.257 0.011 -0.240
Sphericity -0.247 0.086 -0.368
Surface area 0.259 0.025 -0.215
Volume 0.259 0.024 -0.119
Elongation at vertical 0.081 0.487 0.089
Width orientation Projected area 0.248 0.155 -0.057
Equivalent diameter 0.253 0.131 -0.079 Perimeter 0.261 0.056 -0.014 Length 0.262 -0.022 0.035 Width 0.183 0.351 -0.264 Shape factor -0.158 0.383 -0.333 Elongation 0.174 -0.364 0.301
Thickness orientation Projected area 0.247 -0.173 -0.055
Equivalent diameter 0.246 -0.174 -0.090 Perimeter 0.260 -0.067 0.011 Thickness 0.130 -0.395 -0.511 Shape factor -0.233 -0.201 -0.295 Elongation 0.230 0.213 0.304 Eigen value 14.489 3.767 0.616 Component percent 0.763 0.198 0.032 Cumulative 0.763 0.961 0.993
Seed Size and Shape Analysis of Registered Common Bean (Phaseolus vulgaris L.) Cultivars in Turkey Using Digital Photography, Kara et al
Ta r ı m B i l i m l e r i D e r g i s i – J o u r n a l o f A g r i c u l t u r a l S c i e n c e s 19 (2013) 219-234
232
fourth group, ‘Önceler-98’ was closer to the axis of PC1 because it had higher values of seed mass and volume than ‘Karacaşehir-90’. ‘Karacaşehir-90’ took place at the farthest point in the left side of PC1 axis, due to its lowest mean values of variables in PC1 component. These cultivar groups determined by PCA (Figure 6) were in agreement with the classification presented in Table 4. Therefore, the estimates of PCA support the results of cultivar classification according to Şehrali (1988).
4. Conclusions
Based on the results of this study, the following conclusions could be drawn:
• ‘Çayırlı’ genotype had the highest mean value in terms of some geometric and gravimetric properties such as seed mass, volume, geometric mean diameter, surface area, projected area, equivalent diameter, perimeter, length and width while ‘Karacaşehir-90’ had the lowest value.
• The thousand seed mass value of ‘Çayırlı’ was 3.65 times higher than that of ‘Karacaşehir-90’. • The highest value of true density was obtained
from ‘Karacaşehir-90’ and ‘Göynük-98’, while the lowest value was determined in ‘Önceler-98’. • The highest thickness value (6 mm) was
obtained from ‘Elkoca-05’ and ‘Noyanbey-98’, while ‘Terzibaba’ had the lowest thickness value (4.6 mm).
• The mean values of sphericity of the cultivars investigated varied in the range of 58.7% - 70.0%. ‘Karacaşehir-90’ had the highest value of sphericity.
• ‘Terzibaba’ was closer to the circular shape at the width orientation. Conversely, ‘Elkoca-05’ had the lowest value of shape factor. At the thickness orientation, the highest and lowest values of shape factor were measured in ‘Karacaşehir-90’ and ‘Çayırlı’, respectively.
• The results of principal component analysis were in agreement with those of estimates of variance Figure 6- PCA plot of the first two principal components exposing relationships among the bean cultivars Şekil 6- Fasulye çeşitleri arasındaki ilişkiyi gösteren ilk iki temel bileşenin PCA grafiği
Türkiye’de Tescilli Fasulye (Phaseolus vulgaris L.) Çeşitlerinin Dijital Fotoğraflama Kullanılarak Boyut ve Şekil Analizi, Kara et al
Ta r ı m B i l i m l e r i D e r g i s i – J o u r n a l o f A g r i c u l t u r a l S c i e n c e s 19 (2013) 219-234
233
analysis. The principal component analysisshowed that the variables of seed mass, volume, geometric mean diameter, surface area, projected area, equivalent diameter and perimeter were important in grouping the cultivars depending on the size and shape properties.
• The classification was compatible with the Principal Component Analysis. The data regarding the size and shape properties of the cultivars showed that ‘Aras-98’, ‘Elkoca-05’, ‘Göynük-98’, ‘Noyanbey-98’, ‘Yakutiye-98’ and ‘Yunus-90’ cultivars were oblongus, ‘Karacaşehir-90’ and ‘Önceler-98’ cultivars were ellipticus; ‘Akman-98’, ‘Kantar-05’ and ‘Terzibaba’ were subcompressus, and ‘Çayırlı’ genotype was compressus.
• This study showed that there were differences in size, shape and gravimetric features among the bean cultivars. The obtained data could be important in the view of selecting equipment for the separating, sizing, transportation, packaging and storage of the bean seed. They are also important for the design of seed drills and food processing systems.
References
Abdullah M Z, Mohamad-Saleh J, Fathinul-Syahir A S & Mohd-Azemi B M N (2006). Discrimination and classification of fresh-cut starfruits (Averrhoa
carambola L.) using automated machine vision
system. Journal of Food Engineering 76: 506–523 Beyer M, Hahn R, Peschel S, Harz M & Knoche M
(2002). Analysing fruit shape in sweet cherry (Prunus
avium L.). Scientia Horticulturae 96: 139-150
Boydas M G, Sayinci B, Gozlekci S, Oztürk I & Ercisli S (2012). Basic physical properties of fruits in loquat (Eriobotrya japonica (Thunb. Lindl.) cultivars and genotypes determined by both classical method and digital image processing. African Journal of
Agricultural Research 7(29): 4171-4181
Cetin M (2007). Physical properties of barbunia bean (Phaseolus vulgaris L. cv. ‘Barbunia’) seed. Journal
of Food Engineering 80: 353-358
Costa C, Antonucci F, Pallottino F, Aguzzi J, Sun D W & Menesatti P (2011). Shape analysis of agricultural products: a review of recent research advances and
potential application to computer vision. Food and
Bioprocess Technology 4(5): 673–692
Ercisli S, Sayinci B, Kara M, Yildiz C & Ozturk I (2012). Determination of size and shape features of walnut (Juglans regia L.) cultivars using ımage processing.
Scientia Horticulturae 133, 47-55
FAOSTAT data (2012). http://faostat.fao.org/site/567/ default.aspx#ancor – Production. Crops (accessed 01.02.2013)
Fıratlıgil-Durmuş E, Šárka E, Bubník Z, Schejbal M & Kadlec P (2010). Size properties of legume seeds of different varieties using image analysis. Journal of
Food Engineering 99(4): 445-451
Güvenç İ & Güngör F (1996). Türkiye’de tescilli fasulye çeşitlerine ait tohumların fiziksel özellikleri ve besin bileşimleri. Atatürk Üniversitesi Ziraat Fakültesi
Dergisi 27(4): 524-529
IBM SPSS® Statistics (2010). IBM Company© Version
19, SSS Inc.
Jahns G, Nielsen H M & Paul W (2001). Measuring image analysis attributes and modelling fuzzy consumer aspects for tomato quality grading. Computers and
Electronics in Agriculture 31: 17–29
Kara M (2012). Biyolojik Ürünlerin Fiziksel Özellikleri. Atatürk Üniversitesi Ziraat Fakültesi Ders Yayınları No: 242, Erzurum, 397s (in Turkish)
Kays S J (1991). Postharvest Physiology of Perishable Plant Products. Van Nostrand Reinholt, New York (cited by Kays, 1999)
Kays S J (1999). Preharvest factors affecting appearance.
Postharvest Biology and Technology 15: 233–247
Koc A B (2007). Determination of watermelon volume using ellipsoid approximation and image processing.
Postharvest Biology and Technology 45: 366–371
McCabe W L, Smith J C & Harriot P (1986). Unit Operations of Chemical Engineering. McGraw-Hill Book Company, New York
Mohsenin N N (1986). Physical Properties of Plant and Animal Materials. Gordon and Breach Science Publisher, New York
Morimoto T, Takeuchi T, Miyata H & Hashimoto Y (2000). Pattern recognition of fruit shape based on the concept of chaos and neural networks. Computers and
Electronics in Agriculture 26: 171-186
Olajide J O & Ade-Omowaye B I O (1999). Some physical properties of locust bean seed. Journal of Agricultural
Seed Size and Shape Analysis of Registered Common Bean (Phaseolus vulgaris L.) Cultivars in Turkey Using Digital Photography, Kara et al
Ta r ı m B i l i m l e r i D e r g i s i – J o u r n a l o f A g r i c u l t u r a l S c i e n c e s 19 (2013) 219-234
234
Omid M, Khojastehnazhand M & Tabatabaeefar A (2010). Estimating volume and mass of citrus fruits by image processing technique. Journal of Food Engineering
100: 315–321
Ozturk I, Kara M, Ercisli S & Kantar F (2010). Physical and chemical grain properties of new registered common bean cv. ‘Kantar-05’. Akademi Sains
Malaysia 39(5): 725-730
Rashidi M, Gholami M & Abbassi S (2009). Cantaloupe volume determination through image processing.
Journal of Agricultural Science and Technology 11:
623-631
Sadrnia H, Rajabipour A, Jafary A, Javadi A & Mostofi Y (2007). Classification and analysis of fruit shape in long type watermelon using image processing.
International Journal of Agriculture and Biology 1:
68–70
Sayinci B, Ercisli S, Ozturk I, Eryilmaz Z & Demir B (2012). Determination of size and shape in the ‘Moro’ blood orange and ‘Valencia’ sweet orange cultivar and its mutants using image processing. Notulae
Botanicae Horti Agrobotanici Cluj-Napoca 40(1):
234-242
SigmaScan®Pro (2004). SigmaScan®Pro 5.0 User’s
Manual. Systat Software Inc., 501 Canal Blvd. Suite E, Point Richmond, CA 94804
Şehrali S (1988). Yemeklik Tane Baklagiller. Ankara Üniversitesi Ziraat Fakültesi Yayın No: 1089, Ders Kitabı No: 314, Ankara
Wycislo A P, Clark J R & Karcher D E (2008). Fruit shape analysis of vitis using digital photography.
HortScience 43(3): 677– 680
Van Eck J W, Heijden G W A M & Polder G (1998). Accurate measurement of size and shape of cucumber fruits with image analysis. Journal of Agricultural
Engineering Research 70: 335–343
Venora G, Grillo O, Shahin M A & Symons S J (2007). Identification of Sicilian landraces and Canadian cultivars of lentil using an image analysis system.
Food Research International 40: 161–166
Yurtlu Y B & Yeşiloğlu E (2011). Mechanical behaviour and split resistance of chestnut under compressive loading. Tarım Bilimleri Dergisi-Journal of