Procedia - Social and Behavioral Sciences 116 ( 2014 ) 2568 – 2572
1877-0428 © 2013 The Authors. Published by Elsevier Ltd. Open access under CC BY-NC-ND license.
Selection and/or peer-review under responsibility of Academic World Education and Research Center. doi: 10.1016/j.sbspro.2014.01.612
ScienceDirect
5th World Conference on Educational Sciences - WCES 2013
Development of Health Education Attitude Scale for Primary
School Teachers
Fatma Cildir Pelitoglu
a*, Sami Ozgur
baResearch Assistant, Balikesir University, Faculty of Necatibey Education, Balikesir, TURKEY b Assistant Professor, Balikesir University, Faculty of Necatibey Education, Balikesir, TURKEY
Abstract
One of the most important factors influencing health education in primary education is the attitude of the teacher towards health and health education. The purpose of the study is to develop an attitude scale oriented at health education for teachers teaching in primary education. The first stage of the study consists of attempts to determine the attitude of primary school teachers towards health education. In the following stage, these attitudes have been converted to a measurable form. For this purpose, first of all an item pool was constituted. Afterwards, items selected from this pool were converted to a five point Likert type scale. This scale was applied based on voluntariness to 267 prospective teachers studying in the final year of the Elementary Teaching, Science Teaching, and Biology Teaching Departments at the Balıkesir University, Necatibey Faculty of Education. As a result of the validity and reliability analyses conducted and the expert opinions obtained, a 35 item scale on attitudes of teachers towards health education was formed.
Keywords: Health, health education, primary school teacher, attitude scale
1. Introduction
There is no separate discipline in Turkey on health education at a primary education level. Health education appears to be an interim discipline (MEB, 2013). In primary education, various teachers are involved in the health education process and thus, one of the most important factors influencing health education is the attitude of the teacher towards health and health education.
Purpose of the study; to determine teacher attitudes towards health education at a primary education level in Turkey and to develop a scale regarding these attitudes.
Significance of the study; health education in primary education is presented to students as an interim discipline by different teachers. For this purpose, an attitude scale for teachers has been attempted to be developed.
Problem of the study; can attitudes of prospective teachers and teachers at primary education level in Turkey on the current health education be measured with a scale to be developed?
1. Method
The study consists of two stages. The first of these is to collect information on what the attitudes of primary school teachers are towards health. In this stage, the responses to the open ended structured questionnaire prepared for
* Corresponding Author: Fatma Cildir Pelitoglu. Tel.: +90-266-2412762-141 E-mail address: [email protected]
© 2013 The Authors. Published by Elsevier Ltd. Open access under CC BY-NC-ND license.
teachers, the literature, expert opinions, and ideas of researchers were benefitted from (MEB, 2013). The other stage is the testing of the extent these determined expressions measure the attitude in the minds of prospective teachers towards health.
2.1. Study Mode
The study aims to describe the attitude of teachers towards health and health education with the existing state through the simple screening model.
2.2. Universe and Sample
Universe of the Study: The universe of this study, in which the induction method was applied, consists of primary
school teachers and prospective teachers at schools in the central district of Balıkesir and village schools affiliated to the central district.
Sample of the study: The sample of the study consists of 267 prospective teachers studying in the final year of the
Elementary Teaching, Science Teaching, and Biology Teaching Departments at the Balıkesir University, Necatibey Faculty of Education.
2.3. Preparation and Development Process of the Scale for the Attitudes of Teachers on Health
If one has a negative attitude towards health, it becomes difficult to provide education on health (Tekindal, 2009). In this context, the scale for primary school and prospective teacher attitudes on health was prepared. The Health Attitude Scale preparation works were actualized in four stages.
Determination of Items: In the item determination stage, information was collected from students studying in the
final year of the Elementary Teaching, Science Teaching, and Biology Teaching Departments at the Balıkesir University, Necatibey Faculty of Education. By obtaining expert opinions, the item pool consisting of 62 items was formed.
Preparation of the Pilot Scale: Attitude expressions were made relevant to the scale in terms of form and
expression. The determined 62 items were graded in a manner that made it possible to respond in a five point Likert format (1=Strongly agree, 2=Agree, 3=Neutral, 4=Disagree, 5=Strongly Disagree). Care was taken so that the items of the scale were represented equally on a positive-negative and behavior-thought-emotion dimension.
Application of the Scale: Work was conducted with the sample group consisting of 267 students studying in the
final year of the Elementary Teaching, Science Teaching, and Biology Teaching Departments at the Balıkesir University, Necatibey Faculty of Education based on voluntariness. The response period for the scale is approximately 60 minutes.
Validity Analysis and Determination of Reliability: After the application of the scale, the data obtained from 267
prospective teachers was entered into the SPSS 16.0 (Statistical Package for Social Science) package program and the validity analysis was conducted and reliability was determined. In the validity works of the scale, the content and construct validity was tested. For content validity, the expert opinions obtained during the determination of attitude expressions were considered to be suitable and adequate. For the purpose of manifesting the construct validity of the scale, the exploratory factor analysis was utilized. (Büyüköztürk, 2004; Bay et al., 2012; Ural and Kılıç, 2006; Tavşancıl, 2010). As a result of the factor analysis conducted, the factors of the scale and the items in each factor were determined by taking load points of items as a basis. By subjecting data to rotation, factors with core values over 1 were taken into account. In this study, where the number of the sample is 267, the lower intercept points of significant factor loads were accepted to be 0.40. Items with high load values in more than one factor were omitted from the tests. (Cathell and Baggaley,1960; Neale and Liebert,1980; Gorsuch, 1974; cited by: Tavşancıl, Keser, 2002; Tavşancıl, 2010; Büyüköztürk, 2004). For the reliability works of the test, the Cronbach alpha coefficient, which is suitable for use with Likert type scales, was calculated (Table 4). In addition to this, the impact of each item on this coefficient was examined (Table 5). In the item distinctiveness procedures, the difference in the means of the 27% low group and the 27% high group constituted according to the total scores of the scale were compared with an independent group t-test. The distinctiveness index of each item was observed. In this stage, statistical significance of 0.05 was taken as a basis (Büyüköztürk, 2004; Tavşancıl, 2010).
2. Findings and Interpretation
2.1. Findings Regarding Factor Analyses
As a result of the factor analysis conducted for the purpose of testing the construct validity of the pilot scale (K=62), primarily information was obtained on the dimensions of the scale. At the end of the principal components factor analysis and the conversion procedure conducted with the Varimax technique, items with a core value greater than 1.00 and a factor load above 0.40 were included in the analysis. Comprehensible and non repetitive items were selected. With the obtained expert opinions, 27 items of the pilot scale consisting of 62 items were omitted and a scale consisting of 35 items was obtained. In order to test the relevance to the factor analysis of the scale in the new form of K=35, primarily the Kaiser-Meyer-Olkin (KMO) test of sampling adequacy and in order to determine the correlation between the variables, the Bartlett test was applied.
Table 1. KMO and Bartlett's Test Values
Kaiser-Meyer-Olkin Measure Sampling
Adequacy Bartlett's Test of Sphericity
Approx. Chi-Square df Sig. (p)
0,968 1,20 595 ,000
The KMO (K=35) determined for the relevance of the sample is 0,968. This value demonstrates that the used data are suitable for factor analysis in terms of the size of the sample. It was observed that the result of the Bartlett Test was significant. In such a case, it can be said that the correlations between variables are high and the data come from multiple normal distribution. The obtained findings demonstrate that the sample size worked on in order to conduct the factor analysis is adequate and suitable for the analysis of data (Table 1).
The K=35 items scale was evaluated with the principal components factor analysis. When determining the relevance of items in the measuring instrument for the factor analysis, item variance values, the rates of factors for explaining total variance and the load values of factors in each item were observed (Table 2).
Table 2. Total Variance Accountability Percentages For a 35-Item Scale for Health Attitudes of Teachers
In Table 2 when the initial core values were observed, as the first factor meets %56,209 of the variance caused by it prior to conversion, the presence of a general factor may be mentioned (Büyüköztürk, 2004). Since the load value of the first factor of the 35th item in the component matrix prior to conversion is 0.635 and above it and in a slope
graph a highly accelerated decrease was observed after the first factor, this makes one think that the scale has a general factor (Büyüköztürk, 2004) (Figure 1) (Table 2); however, when these items that are present together were examined, the data were reviewed after the conversion by receiving expert opinion as a significant factor name is not given.
It is observed that the items subjected to Varimax conversion (K=35) were grouped under two factors, whose core values were higher than 1 in the measurement instruemnt. As the two significant factors emerging after the conversion were defined more easily in terms of items they contained, this resulted in preferring these values. After conversion the first factor’s accountability percentage for total variance is 42.434; the second factor’s percentage is 32.053 and these two factors’ accountability percentage for total variance is 74.487. Accordingly, it was obsereved that the two factors emerging together as a significant factor in the analysis accounted for most of the total variance in items and the variance regarding the scale (Table 2). This situation was tested with Cattel’s “scree” and the following graph was obtained (Figure 1).
Figure 1. Scree Plot Graph of Factors
As is seen in the figure above, a highly accelerated decrease is observed after the first factor in the graph. A less accelerated decrease is observed after the second factors. The general course of the graph is horizontal in the latter
Initial Eigenvalues Rotation Sums of Squared Loadings
Component Total % of Variance Cumulative % Total % of Variance Cumulative %
1 19,673 56,209 56,209 14,852 42,434 42,434 2 6,397 18,278 74,487 11,219 32,053 74,487
factors and an important decrease tendency is not observed. In other words, the contributions of the latter factors in the variance are close to each other. This situation makes one think that the scale is shaped as two factors. Core values regarding these two factors, variance percentages, and total variance percentages are given in Table 2 (Büyüköztürk, 2004; Ural and Kılıç, 2006) (Figure 1) (Table 2). As a result of this factor analysis, two factors in total having accountability at the rate of % 74.487 are found. These factors are named as “attitude towards teaching factor in health education” and “attitude towards learning factor in health education”.
Table 3. Analysis Table For a 35-Item Scale for Health Attitudes of Teachers
In the table above there is a factor contribution of each item as 0.40 and above it after conversion (Table 3). It is seen that the first factor is represented with 20 items between factor load values as minimum 0.626 and maximum 0,946 and this factor is named as “the attitude towards learning factor in health education.” It is seen that the second factor is represented with 15 items between factor load values as minimum 0.589 and maximum 0.945 and this factor is named as “the attitude towards teaching factor in health education”.
3.2. Findings Regarding the Reliability Analysis
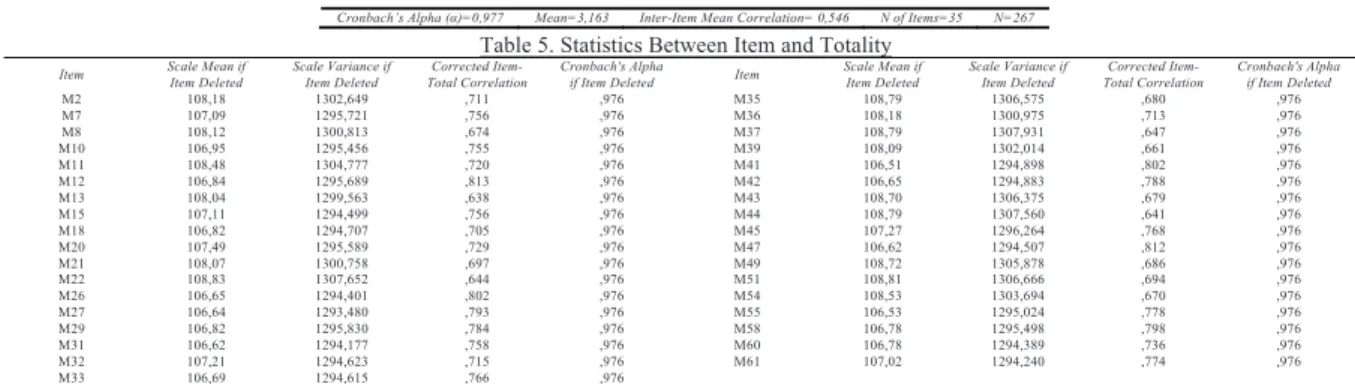
For the reliability analysis of the scale Cronbach alpha coefficient was calculated as 0.977 (Table 4). This value is used to test whether the items forming the measurement instrument are consistent among one another or not. The reliability coefficient varies between 0 and 1 and the reliability increases as this value approaches to 1 (Table 4) (Ural and Kılıç, 2006) (Demir, 2012).
Table 4. The Results of the Reliability Analysis Table 5. Statistics Between Item and Totality
Item Scale Mean if Item Deleted Scale Variance if Item Deleted Total Correlation Corrected Item- Cronbach's Alpha if Item Deleted Item Scale Mean if Item Deleted Scale Variance if Item Deleted Total Correlation Corrected Item- Cronbach's Alpha if Item Deleted
M2 108,18 1302,649 ,711 ,976 M35 108,79 1306,575 ,680 ,976 M7 107,09 1295,721 ,756 ,976 M36 108,18 1300,975 ,713 ,976 M8 108,12 1300,813 ,674 ,976 M37 108,79 1307,931 ,647 ,976 M10 106,95 1295,456 ,755 ,976 M39 108,09 1302,014 ,661 ,976 M11 108,48 1304,777 ,720 ,976 M41 106,51 1294,898 ,802 ,976 M12 106,84 1295,689 ,813 ,976 M42 106,65 1294,883 ,788 ,976 M13 108,04 1299,563 ,638 ,976 M43 108,70 1306,375 ,679 ,976 M15 107,11 1294,499 ,756 ,976 M44 108,79 1307,560 ,641 ,976 M18 106,82 1294,707 ,705 ,976 M45 107,27 1296,264 ,768 ,976 M20 107,49 1295,589 ,729 ,976 M47 106,62 1294,507 ,812 ,976 M21 108,07 1300,758 ,697 ,976 M49 108,72 1305,878 ,686 ,976 M22 108,83 1307,652 ,644 ,976 M51 108,81 1306,666 ,694 ,976 M26 106,65 1294,401 ,802 ,976 M54 108,53 1303,694 ,670 ,976 M27 106,64 1293,480 ,793 ,976 M55 106,53 1295,024 ,778 ,976 M29 106,82 1295,830 ,784 ,976 M58 106,78 1295,498 ,798 ,976 M31 106,62 1294,177 ,758 ,976 M60 106,78 1294,389 ,736 ,976 M32 107,21 1294,623 ,715 ,976 M61 107,02 1294,240 ,774 ,976 M33 106,69 1294,615 ,766 ,976
When the correlation between each item and totality is examined according to Table 5 above, a low correlation is not seen, so it can be said that there are no items that decrease the reliability of the scale. In the final column when the item is deleted, an item that increases the reliability of the scale is not encountered. In this case it may be thought that there is no need to omit any items from the scale.
3.3. Findings Regarding the Item Analysis
The differences between item mean scores of the 27% upper group and 27% lower group that are formed according to total scores of the scale for the item distinctiveness operations were tested by using the independent t-test. The observed significant differences emerging as requested between the groups are an indication of the internal consistency of the test. In this context, first, for N=267 according to total scores a 27 % (n=72) lower and a 27 % upper group (n=72) are defined. An independent t-test was performed for the item average scores of these groups. The distinctiveness index of each item was referred to. In the study 0.05 significance level was based on statistically (Büyüköztürk, 2004).
In the 0.05 significance level the difference between the groups is important if p is 0.05 (Ural, Kılıç, 2006). As any items that do not conform to this situation are not encountered, it may be said that the difference between lower 27%
Items Factors Items Factors Items Factors Items Factors Items Factors Items Factors Items Factors
1 2 1 2 1 2 1 2 1 2 1 2 1 2 M41 ,946 M47 ,903 M29 ,862 M15 ,755 M51 ,945 M49 ,898 M2 ,735 M27 ,944 M31 ,890 M60 ,805 M7 ,750 M35 ,936 M44 ,885 M21 ,668 M26 ,929 M12 ,881 M61 ,786 M45 ,715 M37 ,922 M11 ,834 M8 ,663 M55 ,912 M33 ,865 M10 ,777 M32 ,674 M43 ,916 M54 ,818 M39 ,656 M42 ,911 M58 ,864 M18 ,759 M20 ,626 ,413 M22 ,912 M36 ,750 M13 ,589
and upper 27% groups is important and that the items in their present forms are contained in the scale. If the t value calculated from another perspective is greater than theoretical t value, then the difference between the groups is important. The theoretical t value is 1.97 according to the t table value corresponding to specified significance level (0.05) and degree of freedom (142). The t values calculated according to this are greater than 1.97 and the difference between the groups are significant (Ural, Kılıç, 2006). In this case for these items it may be said that the difference between lower 27% and upper 27% groups is important and thus, these items may be used in the scale. Within the framework of performed analyses, the scale is said to be valid and reliable.
4. Conclusion and Recommendations
As a result of performed analyses of this scale that is prepared to specify teachers and prospective teachers’ attitudes towards health education, it may be expressed that it serves the purpose of measurement and represents the area that is requested to be measured. This study that is limited with the opinions of the researcher and experts is an important step for the health education researches to be performed at the level of primary education in Turkey. This study is capable of both guiding studies to be performed in health education with its contribution to the literature and to the teachers that shall provide this education. In this context, it provides information needed for teachers in health education.
Attitude scales for health education must need to have regional and cultural characteristics as well as containing general information. With such an attitude scale specific to the conditions in Turkey the general information on teachers’ attitudes along with more specific information are measured. As a result of performed analyses in scale two factors were found as “attitude towards teaching factor in health education” and “attitude towards learning factor in health education.” This can be the evidence that the teachers consider the health education not only as an information transfer but also the student dimension.
In this study even if an exploratory factor analysis was performed for the validity of the structure of the scale, for more detailed analyses confirmatory factor analyses should also performed in future studies. It shall be appropriate to repeat it in different environments at different grade levels and to add new data to the research.
References
Bay, E., Mert, O., Alyılmaz, S., Albayrak, F. (2012) Eski Türk Eserlerine İlişkin Tutum Ölçeği Geliştirilmesi. Uluslararası Türkçe Edebiyat Kültür Eğitim Dergisi, sayı 1/2, s. 70-82.
Büyüköztürk, Ş. (2004) Sosyal Bilimler için veri analizi el kitabı; istatistik, araştırma deseni, SPSS uygulamaları ve yorum. PegemA Yayıncılık, 4. Baskı, Ankara.
Demir, M.Ö. (2012) Sosyal Bilimlerde istatistiksel analiz:SPSS 20 kullanım klavuzu, Detay Yayıncılık, 1. Baskı, Ankara. MEB, (2013) http://ttkb.meb.gov.tr/www/ogretim-programlari/icerik/72 (30.01.2013).
Tavşancıl, E. Keser, H. (2002) İnternet kullanımına yönelik Likert tipi bir tutum ölçeğinin geliştirilmesi. Eğitim Bilimleri ve Uygulama 1, (1), 79-100.
Tavşancıl, E. (2010) Tutumların ölçülmesi ve SPSS ile veri analizi. Nobel Yayın Dağıtım, 4. Baskı, Ankara. Tekindal, S. (2009) Duyuşsal özelliklerin ölçülmesi için araç oluşturma. Pegem Akademi, Ankara.
Ural, A., Kılıç, İ. (2006) Bilimsel araştırma süreci ve SPSS ile veri analizi; SPSS 10.0-12.0 for Windows. Detay Yayıncılık, 2. Baskı, s.281-294, Ankara.