INVESTIGATION OF LITHIUM SALTS-NONIONIC
SURFACTANT LYOTROPIC LIQUID CRYSTALLINE
MESOPHASES IN A DYE SENSITIZED SOLAR CELL AS GEL
ELECTROLYTES
A THESIS SUBMITTED TO
THE GRADUATE SCHOOL OF ENGINEERING AND SCIENCE OF BILKENT UNIVERSITY
IN PARTIAL FULFILLMENT OF THE REQUIREMENTS FOR THE DEGREE OF MASTER OF SCIENCE IN CHEMISTRY By EZGİ YILMAZ September, 2015
ii
INVESTIGATION OF LITHIUM SALTS-NONIONIC SURFACTANT LYOTROPIC LIQUID CRYSTALLINE MESOPHASES IN A DYE SENSITIZED SOLAR CELL AS GEL ELECTROLYTE
By Ezgi Yılmaz, September, 2015
We certify that we have read this thesis and have found that it is fully adequate, in scope and in quality, as a thesis for the degree of Master of Science.
Prof. Dr. Ömer Dağ (Advisor)
Asst. Prof. Dr. Ferdi Karadaş
Asst. Prof. Dr. Coşkun Kocabaş
Approved for the Graduate School of Engineering and Science:
Prof. Dr. Levent Onural Director of the Graduate School
iii
ABSTRACT
INVESTIGATION OF LITHIUM SALTS-NONIONIC
SURFACTANT LYOTROPIC LIQUID CRYSTALLINE
MESOPHASES IN A DYE SENSITIZED SOLAR CELL AS GEL
ELECTROLYTE
Ezgi Yılmaz M.S. in Chemistry
Supervisor: Prof. Dr. Ömer Dağ September, 2015
Liquid crystals are one of the most widely studied and used materials in chemistry. The properties of liquid crystals make them interesting to research also for various electrochemical applications. In this context, lithium salts such as LiI, LiCl, LiBr, and LiNO3 can be assembled using non-ionic surfactants into lyotropic
liquid crystalline (LLC) mesophases[1], [2] and used as gel electrolytes in various applications.
In this work, the LLC mesophases of LiI with and without other lithium salts (such as LiCl, LiBr, and LiNO3) were prepared using 10-lauryl ether
(C12H25(CH2CH2O)10OH, denoted as C12EO10) and characterized using the FT-IR
(Fourier Transform Infrared Spectroscopy), Raman spectroscopy, XRD (X-Ray Diffraction), POM (Polarized Optical Microscopy), and AC conductivity measurements. Beside from single salt-surfactant mesophases, we also prepared LiI/I2 redox couple in an LLC phase with the help of a non-ionic surfactant and they
were also characterized using the same techniques. We found out that the mesophases can be prepared as gels by directly mixing salt and surfactant with certain amounts of water or as solutions using excess solvent (such as water, ethanol, or acetonitrile) that can be evaporated to form the LLC mesophases. The water content of both sets of samples is the same upon exposing to the atmosphere
iv
for a certain time and it only depends on the salt amount and humidity under the ambient conditions (around room temperature and 20-25 % RH). The required water/salt ratio for a stable mesophase is around 3.0 which, it is much lower than the water needed to dissolve those salts in an aqueous media. The water/salt mole ratio closely follows the Hofmeister series of anions, where the water amount order is as follows; LiCl>LiBr>LiI>LiNO3, however, the AC ionic conductivity follows
a different order; LiNO3>LiCl>LiBr>LiI. Adding I2 by 1/10 mole ratio of the LiI
into the media does not change the properties of the mesophases. The AC conductivity increases with increasing salt and water content of the mesophases with a typical conductivity of around 0.1 to 1.0 mS/cm-1. The mesophases are also stable in a very broad temperature (below 0 °C to 60-130 °C) and salt concentration (2-10 salt/surfactant mole ratio) ranges.
Finally, the LiI/I2 mesophases were used as gel-electrolytes in dye sensitized
solar cells (DSSCs) as gel-electrolytes and redox couples. A set of samples were prepared with different ratios of the LiI:I2 redox couple (such as, 1:0.1, 1:0.2, 2:0.2,
2:0.3, 3:0.2, 3:0.3, 4:0.4, and 5:0.5) and the solar performances were tested in a DSSC, which contains N719 dye sensitized TiO2 anode and Pt cathode using a solar
simulator. However, the LLC phases have gel like structure and it is hard to infiltrate the gel into the pores of dye modified nano-TiO2 films. To overcome the
diffusion problem, the gel-electrolytes were also prepared as a solution in excess water, ethanol or acetonitrile that evaporates upon infiltration over time. In addition to this, by changing the procedure of preparing the TiO2 paste, improvement on
results was also obtained.
The DSSC provides 0.2 % efficiencies with 0.50 fill factors when gel-electrolytes are used. Since water is used for preparing the LLC phases, we had always lower Voc values. However, when it is prepared as a solution with excess
ethanol, it provides up to 3.33 % efficiencies with 9.58 mA/cm2 short circuit current and 0.6 V open circuit voltage. Also, new procedure for preparing the TiO2 paste
provides us even higher Voc values such as 0.76 V, which is unusual for the water
based LLC electrolytes in this area.
Key Words: Lyotropic Liquid Crystal, Mesophase, Solar Cell, Gel Electrolyte,
v
ÖZET
LİTYUM TUZLARI VE İYONİK OLMAYAN YÜZEYAKTİF
LİYOTROPİK SIVI KRİSTAL FAZLARIN BOYA DUYARLI
GÜNEŞ HÜCRELERİNDE JEL ELEKTROLİT OLARAK
KULLANILMASI
Ezgi Yılmaz
Kimya Bölümü, Yüksek Lisans Tez Yöneticisi: Prof. Dr. Ömer Dağ
Eylül, 2015
Sıvı kristaller, kimyada en çok araştırılan ve kullanılan maddelerden bir tanesidir. Sıvı kristallerin özellikleri bu maddeleri araştırmayı ve çeşitli elektrokimyasal uygulamalarda kullanmayı da ilginç kılmaktadır. Bu amaçla, LiI, LiCl, LiBr, ve LiNO3 gibi lityum tuzları iyonik olmayan yüzey aktif maddeler
yardımıyla liyotropik sıvı kristal (LSK) mezofazları oluşturmak için birleştirilebilir, ve çeşitli uygulamalarda jel elektrolit olarak kullanılabilir.
Bu çalışmada, diğer lityum tuzlarının (LiCl, LiBr, ve LiNO3) ekli olduğu ve
olmadığı, lityum iyodürün LSK mezofazları 10-lauril eter
(C12H25(CH2CH2O)10OH; C12EO10 olarak da ifade edilebilir) kullanılarak
hazırlandı. Bu numuneler, FT-IR (Fourier dönüşümlü infrared spektroskopisi), Raman spektroskopisi, XRD (X-ışını kırınımı), POM (polarize optik mikroskopisi), ve alternatif akım iletkenlik ölçümleri kullanılarak karakterize edildi. Ayrıca, LiI/I2
redoks çifti iyonik olmayan yüzey aktif maddeler yardımıyla LSK mezofazında hazırlandı, ve yine yukarıda bahsedilen teknikler kullanılarak karakterize edildi. Bu mezofazlar hem belirli oranlarda tuz ve yüzey aktif maddeyi karıştırıp, az miktarda su eklenerek jel olarak; hem de fazla miktarda çözücü (su, etanol, ya da asetonitril) eklenerek çözelti olarak hazırlanabilir. Çözelti olarak hazırlanan numunelerin fazla miktarda olan çözücüleri buharlaştıktan sonra LSK mezofazlarını oluşturdukları görüldü. Numunelerin jel ya da çözelti olarak hazırlanmaları farketmeksizin, havayla etkileşime girdiklerinde son kalan su miktarlarının aynı olduğu görüldü.
vi
Numunelerin içinde bulunan su miktarlarının; tuz miktarına ve ortamdaki neme bağlı olduğu görüldü; ve yapılan ölçümler sonucunda su/tuz stokiyometrik oranı 3.0 olarak hesaplandı. Bu su miktarı, kullanılan lityum tuzlarını sulu ortamda çözmek için gerekli olan su miktarından çok daha azdır; ve anyonların Hofmeister serisini izler. Kullanılan tuzlar içinde en çok su tutanı LiCl olmakla birlikte, yapının içindeki su miktarının sıralaması LiCl > LiBr > LiI > LiNO3 şeklinde olmasına
rağmen iletkenlik sonuçlarının LiNO3 > LiCl > LiBr > LiI sıralamasını izlediği
görüldü.
Numunelere lityum iyodür tuz miktarının onda biri kadar I2 eklemek
oluşturulan mezofazların özelliklerini değiştirmemektedir. Ayrıca, tuz ve su miktarları arttıkça iletkenliğin de arttığı gözlemlenmiştir. Bunun dışında, oluşturulan mezofazların geniş bir sıcaklık aralığında ve çok uzun süre kararlı olduğu söylenebilir.
Son olarak, oluşturulan LiI/I2 mezofazlar boya duyarlı güneş hücrelerinde
jel elektrolik olarak kullanıldı. Farklı oranlarda birçok numune hazırlandı, ve en iyi sonuç verenin LiI/I2 oranının 10 olduğu numuneler olduğu gözlemlendi. 1:0.1,
2:0.2, 3:0.3, 4:0.4, ve 5:0.5 şeklinde hazırlanan numuneler içinde de en iyi verimin 2:0.2 numunesine ait olduğu görüldü. Bu numuneler boya duyarlı güneş hücrelerinde test edildi. Bu güneş hücreleri yapılırken N719 kodlu boya, TiO2
kaplanmış anot, ve Pt kaplanmış katot kullanıldı. Fakat, jel elektrolit olarak hazırlanan numunelerin, titanyum dioksitin yapısında bulunan gözeneklerin içine girmesi çok zor olduğundan verimlerin de düşük olduğu görüldü. Bu sorunu çözmek için, bu numuneler çözelti olarak hazırlanıp o şekilde test edildi. Çözücü olarak su, etanol, ve asetonitril denendi, ve en iyi sonucun etanol ile olduğu görüldü. Ayrıca başta kullanılan TiO2 prosedürü değiştirilerek optimal hale getirildi.
Boya duyarlı güneş hücrelerinde jel elektrolitler kullanıldığında alınan verim 0.2 %, ve doluluk oranı 0.50 olarak hesaplandı. Su bazlı sistemde çalışıldığı için voltaj değerleri diğer çalışmalara göre daha düşük çıkmaktadır. Fakat, jel elektrolitteki bazı problemleri çözmek amacıyla fazla miktarda etanol kullanılarak çözelti şeklinde hazırlanan elektrolitlerle 3.33% verim, 0.6 V voltaj, ve 9.58 mA/cm2 akım elde edilmiştir.
Anahtar Kelimeler: Liyotropik Sıvı Kristal, Mezofaz, Güneş Hücresi, Jel
vii
ACKNOWLEDGEMENTS
First of all I would like to thank my supervisor, Professor Ömer Dağ, for sharing his ideas with me for 3 years. Every day I learned a lot from him, about chemistry disciplines, scientific methods, life and working principles in all parts of life. I cannot thank him enough for his patience during my research and his kind and encouraging advices. Thanks to him, I learned to study and research systematically and this is the thing that will always help me throughout my life. Without him, I could not finish this program, I could not learn this much and I could not have gone this far; and because all of these, I will be always grateful to him.
I also would like to thank my examining committee members, Ferdi Karadaş and Coşkun Kocabaş for their very valuable time and feedbacks on my thesis.
I also would like to thank Professor Jayasundera Bandara for 3 months of working with me. He taught me lots of things and his works and thoughts became really important and useful for this project in terms of efficiency improvements. Without his help, I could not make this much progress.
I am grateful to all my group members, too, for all of these years. Even after the former group members left, they were still by my side with their guidance. I would like to thank Elif Berna Olutaş, specially, for her time and help on my research topic.
For being successful, it is important to have kind and loving people around, to overcome the all kinds of difficulties with them. I am really lucky in this term, to have lots of people who care for me and try to do their best to help me during this hard period. This is why, I cannot thank enough to Doğa Derman, Sezin Bal, Ethem Barış Öztürk, and Fırat Çimenli for their beautiful and unrequited friendships throughout the 7 years; Tuğçe Esra Uslu, Ersin Altın, Gökçen Sakıncı and my all other lovely friends in my club who have been second family to me, and many other people who were there for me. Most importantly and specifically, I would like to thank to Arda Topuzlu for his patience, his help and his caring in every little time of this period.
viii
Lastly but most importantly, I would like to thank to my mother, father, and my sister. They live far away from me for past 7 years but they were always by my side at the same time. They believed in me for everything and without their beliefs I could not do anything.
ix
CONTENTS
ABSTRACT ... iii ÖZET... v ACKNOWLEDGEMENTS ... vii CONTENTS ... ixLIST OF FIGURES ... xii
LIST OF TABLES ... xvii
LIST OF ABBREVIATIONS ... xviii
CHAPTER 1 ... 1
1. INTRODUCTION ... 1
CHAPTER 2 ... 3
2. BACKGROUND ... 3
2.1. Liquid Crystals ... 3
2.1.1. Lyotropic Liquid Crystalline (LLC) Mesophases ... 7
2.1.2. Poly(ethylene oxide) Type Surfactant Systems (CmEOn + H2O) ... 10
2.1.3. Additives in CmEOn + H2O Type Surfactant Systems ... 11
2.2. Salt-Surfactant System ... 14
2.3. Soft Confinement Effect and Origin of Salt-Surfactant Mesophases ... 18
2.4. Dye Sensitized Solar Cells ... 19
2.5. Electrolytes for Dye Sensitized Solar Cells ... 24
2.5.1. Solid-State Electrolytes for Dye Sensitized Solar Cells... 24
2.5.2. Liquid Electrolytes for Dye Sensitized Solar Cells ... 24
2.5.3. Gel Electrolytes for Dye Sensitized Solar Cells... 26
2.5.4. Most Widely Used Redox Couple: Iodide/Triiodide ... 26
2.5.5. Additives for Electrolytes in Dye Sensitized Solar Cells ... 29
CHAPTER 3 ... 30
3. EXPERIMENTAL ... 30
3.1. Materials ... 30
x
3.2.1. Preparation of the LiX-xH2O-C12EO10 Gel Samples ... 30
3.2.2. Preparation of the Gel Samples with Redox Couple ... 30
3.2.3. Preparation of the Solution Phase Samples with Redox Couple ... 31
3.3. Fabrication of the Solar Cells ... 31
3.3.1. Preparation of Blocking Layer Solution... 31
3.3.2. Preparation of Mesoporous Titania Films and Working Electrodes ... 31
3.3.3. Preparation of Dye Solution ... 32
3.3.4. Preparation of Pt Solution and Counter Electrodes ... 32
3.3.5. Assembly of Dye Sensitized Solar Cells ... 32
3.4. Instrumentation ... 35
3.4.1. The Polarized Optical Microscope (POM)... 35
3.4.2. The X-Ray Diffraction (XRD) ... 35
3.4.3. The Fourier Transform–Infrared Spectroscopy (FT-IR) and Attenuated Total Reflectance (ATR) ... 36
3.4.4. The Raman Spectroscopy ... 36
3.4.5. The AC Impedance Spectroscopy ... 36
3.4.6. UV-VIS Spectroscopy ... 37
3.4.7. The Solar Performance Measurements ... 37
CHAPTER 4 ... 38
4. RESULTS AND DISCUSSION ... 38
4.1. Lyotropic Liquid Crystalline (LLC) Mesophases of 10-Lauryl Ether and LiCl and LiI ... 38
4.1.1. Characterization of LiCl - C12EO10 - Water LLC Mesophases ... 39
4.1.2. Characterization of LiI - C12EO10 - Water LLC Mesophases ... 51
4.1.3. Summary of Lithium Salts-Surfactant Systems ... 62
4.2. LLC Mesophases of LiI – I2 – C12EO10 – Water Systems ... 63
4.2.1. LiCl – LiBr – LiNO3 Addition to the Redox Couple ... 73
xi
4.3. LLC Mesophases as Electrolytes in DSSCs & I-V Curves ... 81
4.3.1. Summary of DSSCs ... 87 CHAPTER 5 ... 90 5. FUTURE WORK... 90 CHAPTER 6 ... 91 6. CONCLUSIONS ... 91 BIBLIOGRAPHY ... 93
xii
LIST OF FIGURES
Figure 2.1. The phase transformation from solid to liquid and an illustration of them
in terms of orientation of molecules... 3
Figure 2.2. The representation of molecules in calamitic (left) and discotic (right)
LCs. ... 4
Figure 2.3. A representation for isotropic, nematic and smectic phases,
respectively. ... 5
Figure 2.4. Discotic nematic (left) and discotic columnar (right) LC phase. ... 5 Figure 2.5. Schematic representation of amphiphilic molecule which contains
hydrophobic and hydrophilic parts... 6
Figure 2.6. Schematic representation of micelle (left) and vesicle (right) structure
of a surfactant. ... 6 1Figure 2.7. The POM image of a sample with corkscrew structure.[25] ... 8 2Figure 2.8. A schematic representation for mesophases of LLCs, on top lamellar (left) and bicontinuous cubic (right), at bottom hexagonal (left) and cubic (right) phases.[23] ... 9 3Figure 2.9. An illustration for phase transition between LLC mesophases as concentration of surfactant increased. ... 9 4Figure 2.10. Phase behavior of C10EO
8 with the change in the content of water.[32]
... 11 5Figure 2.11. Phase diagrams of C12EO
7 + H2O system with the addition of LiCl
(squares), NaCl (triangles), CsCl (diamonds) and none (circles)[38] ... 12 6Figure 2.12. The effects of NaX salts on the cloud points of different surfactants.[39] ... 13 7Figure 2.13. The effects of NaX salts addition on the phase diagrams of C12EO7.[40] ... 14
8Figure 2.14. Hydrogen bonding between coordinated water molecules of TMS and ethylene oxide units of surfactant.[45] ... 15 9Figure 2.15. The phase diagram of ZnX-C12EO
10 (ZnX is [Zn(H2O)6](NO3)2)
system.[49] ... 17 10Figure 2.16. The schematic representation for working principle of a DSSC.[65] ... 20
xiii
Figure 2.17. I-V curve of a real cell (red line), an ideal one (dashed lines), and Pmax
(with blue line).[67] ... 21
Figure 2.18. Schematic representation of shunt and series resistance in cell.[67] 22
11Figure 2.19. The molecular structures of N3 (left) and N719 (right) dyes... 23 12Figure 2.20. Energy scheme for DSSC with Ru-based dye, TiO2 semiconductor and I-/I3- redox couple.[113] ... 28
13Figure 2.21. Kinetics of DSSC with the approximate time constants.[113] ... 28
Figure 3.1. A representative working electrode after all the steps. ... 32 Figure 3.2. Dye sensitized solar cell with working electrode on top and counter
electrode at the bottom. ... 33
Figure 3.3. Dye sensitized solar cell with clips to hold them together. ... 33 Figure 4.1. Photos of the 3-1-9 ratio of LiCl salt LLC with high viscosity. ... 39 Figure 4.2. The POM images of LiCl-oligo-water systems of 3-1-3 ratios covered
with glass (left) and open to air (right)... 40
Figure 4.3. The POM images of LiCl-oligo-water systems of 3-1-4.5 ratios covered
with glass (left) and open to air (right)... 40
Figure 4.4. The POM images of LiCl-oligo-water systems of 3-1-6 ratios covered
with glass (left) and open to air (right)... 41
Figure 4.5. The POM images of LiCl-oligo-water systems of 3-1-7.5 ratios covered
with glass (left) and open to air (right)... 41
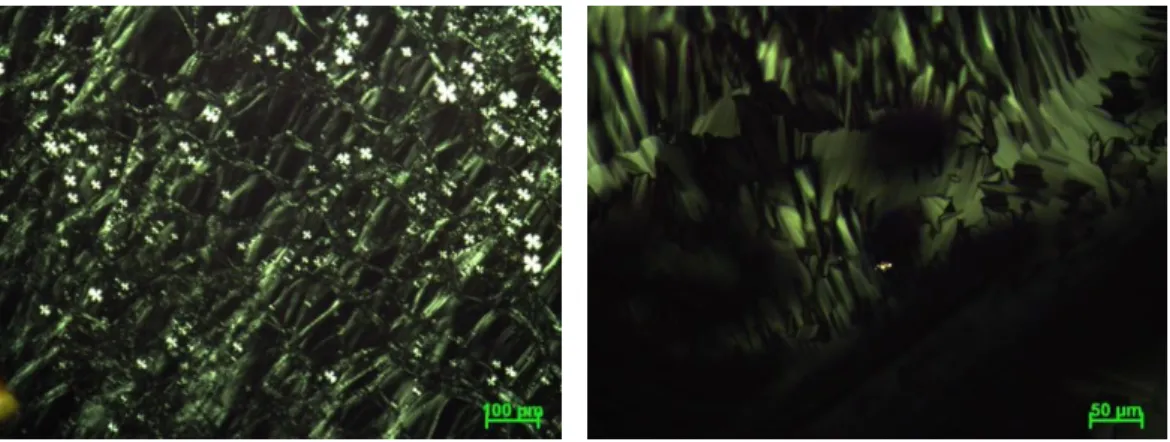
Figure 4.6. The POM images of LiCl-oligo-water systems of 3-1-9 ratios covered
with glass (left) and open to air (right)... 41
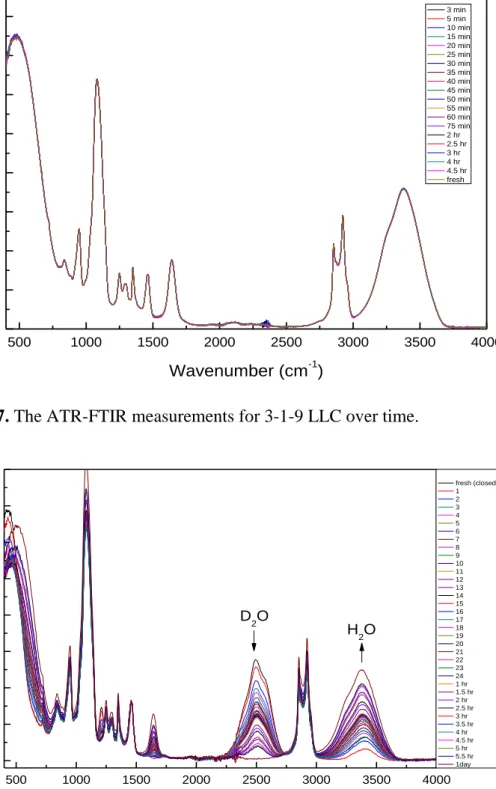
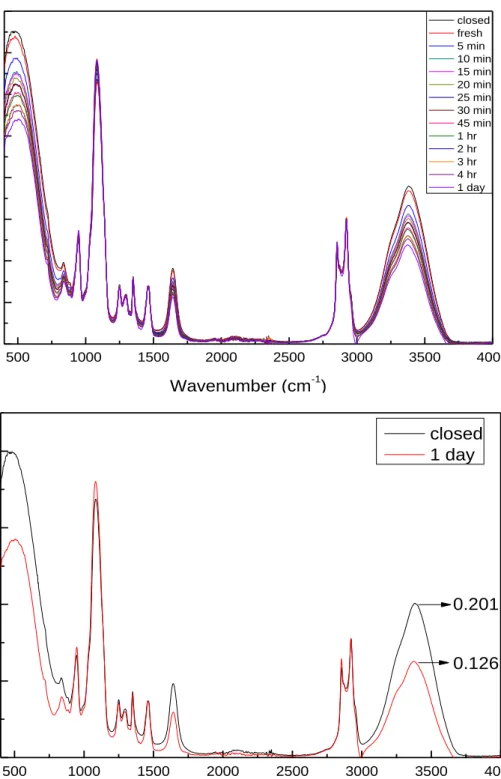
Figure 4.7. The ATR-FTIR measurements for 3-1-9 LLC over time. ... 43 Figure 4.8. The ATR-FTIR spectra of 3-1-9 LiI-C12EO10- D2O instead of H2O. 43 Figure 4.9. The ATR-FTIR spectra for 3-1-12 mole ratio over time (top) and the
normalized results to compare fresh one with the 1 day-aged one (bottom). ... 44
Figure 4.10. Normalized ATR-FTIR spectra of 3-1-12 (left) and 3-1-9 (right) are
shown. When calculation is done by using these normalized intensities, 3-1-12 sample is seen to have 0.177 a.u. intensity which is the same with 3-1-9 sample. 45
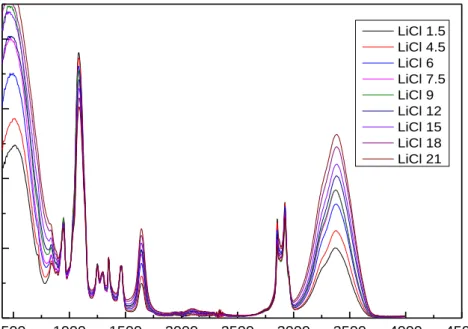
Figure 4.11. The calibration curve for LiCl - C12EO10 - water samples. ... 46 Figure 4.12. The ATR-FTIR results for all the samples with different mole ratios
of water... 47
Figure 4.13. The ATR-FTIR spectra of LiCl samples (left) and the calibration curve
xiv
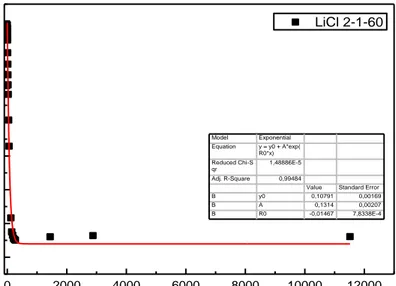
Figure 4.14. Weight measurement for the sample with 2-1-60 mole ratio over time.
... 49
Figure 4.15. Weight measurements for the samples with 3-1-90 (top) and 4-1-120
(bottom) mole ratios. ... 50
Figure 4.16. The photos of highly viscous liquid crystalline 2 LiI (left) and 3 LiI
(right) samples. ... 51
Figure 4.17. The POM images of 2 LiI with 2,3,4,5, and 6 mole ratios of water
from top to bottom, respectively. The images on the left side belong to the fresh samples, and the images on the right side belong to the 3 days aged samples. .... 51
Figure 4.18. The XRD patterns for fresh LiI samples with different amounts of
water. ... 52
Figure 4.19. The XRD patterns of 2 mole ratio of LiI samples with different water
content after 1 week. ... 53
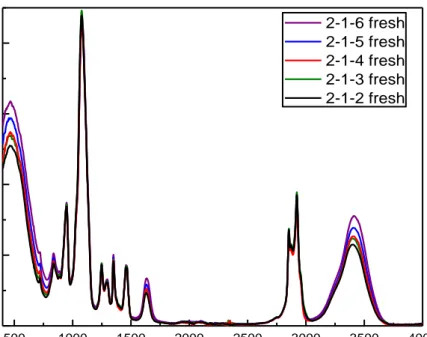
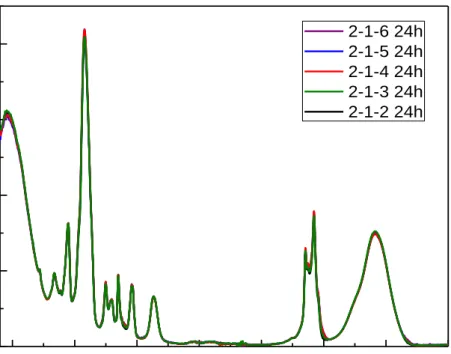
Figure 4.20. The ATR-FTIR spectra of fresh 2 LiI samples with different water
content. ... 53
Figure 4.21. The ATR-FTIR spectra for all LiI samples in Figure 4.20 after 24
hours. ... 54
Figure 4.22. The ATR-FTIR spectra of the sample with 2-1-6 ratio over time. .. 54 Figure 4.23. The POM images of 3 LiI sample with 3 (top, left), 4.5 (top, right), 6
(bottom, left), and 9 (bottom, right) mole ratios of water closed with a glass (left) and open to the air (right). ... 55
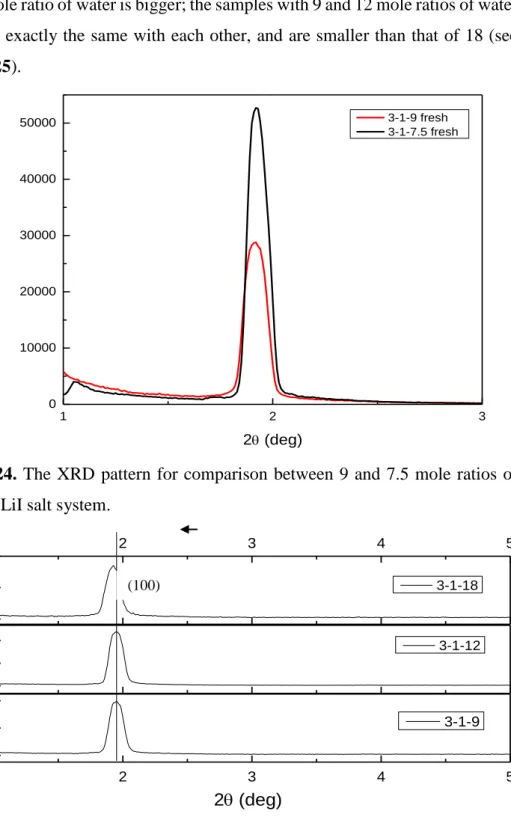
Figure 4.24. The XRD pattern for comparison between 9 and 7.5 mole ratios of
water in 3 LiI salt system. ... 56
Figure 4.25. The XRD pattern for higher amount of water in 3 LiI salt system. . 56 Figure 4.26. The ATR-FTIR spectra for all fresh LiI samples with different water
amount (top) and for sample with 3-1-9 mole ratio over time (bottom). ... 57
Figure 4.27. The ATR-FTIR spectra for the 3 LiI samples with higher water content
(top) and the calibration curve for them (bottom). ... 58
Figure 4.28. The ATR-FTIR spectra with different mole ratios of LiI with 60 mole
ratio of water (left), and the calibration curve obtained from it (right)... 59
Figure 4.29. The ATR-FTIR spectra for LiCl and LiI samples to see the shifting in
water bending mode frequencies. ... 59
Figure 4.30. A schematic representation of the local structures of water and LiCl
xv
Figure 4.31. Weight measurements for the LiI samples with 2-1-60 (top) and
3-1-90 (bottom) mole ratios. ... 61
Figure 4.32. The XRD pattern of the sample with 1-0.1 ratio LiI-I2 with a 2 mole ratio of water. ... 64
Figure 4.33. The ATR-FTIR spectra for 1-0.1 gel samples with the mole ratio of
water 1, 2, 3, and 60. ... 64
Figure 4.34. The photos of the 2-0.2 gel samples with different amount of water
(left to right 2, 4, 6, and 8). ... 65
Figure 4.35. The POM images of the 2-0.2 gel with 4 mole ratio of water after 2
days (left), and 2-0.2-60 sample after spin coating and evaporating all excess water (right)... 65
Figure 4.36. The XRD patterns of fresh (top) and 1 week aged (bottom) 2-0.2
samples with different mole ratios of water. ... 66
Figure 4.37. The ATR-FTIR spectra for the examination of hydration water amount
for 2-0.2 gels. ... 67
Figure 4.38. The change in water amount in the 2-0.2-60 sample over time,
determined using a 4 digit balance. ... 67
Figure 4.39. The ATR-FTIR spectra for the sample 2-0.2-60 mole ratio prepared
using D2O instead of H2O. ... 68 Figure 4.40. The POM images of the samples with 3-0.3-9 (LiI-I2-H2O) mole ratios
(left) and 3-0.3-90 mole ratios after spin coating and evaporating of all water (right). ... 69
Figure 4.41. The XRD patterns for fresh 0.3 samples (top), and 1 week aged
3-0.3 samples (bottom) with different water content. ... 69
Figure 4.42. The ATR-FTIR spectra for the examination of hydration water amount
for the 3-0.3 gels with various amount of water. ... 70
Figure 4.43. The change in the water amount in the 3-0.3-90 sample over time,
determined using a 4 digit balance. ... 70
Figure 4.44. The POM images of 4-0.4-8 (top, left), 4-0.4-12 (top, right), 4-0.4-16
(bottom, left), and 4-0.4-24 samples. ... 71
Figure 4.45. The XRD patterns of the fresh samples with 4-0.4-8 and 4-0.4-12 mole
ratios. ... 72
Figure 4.46. The XRD patterns for the fresh 4-0.4 samples with 16, 20, and 24 mole
xvi
Figure 4.47. The ATR-FTIR spectra for the 4-0.4 LiI-I2-C12EO10 samples with
different amount of water. ... 73
Figure 4.48. POM images of the 5-0.5-60 samples after spin coating and
evaporating all excess water... 73
Figure 4.49. The POM images of the samples with 0.2, 0.4, 0.6 (top), 0.8, and 1.0
(bottom) addition of LiCl, respectively, to the 2-0.2 LiI-I2 sample. ... 74 Figure 4.50. The POM images of the samples with 0.2, 0.4 (top), 0.6, 0.8 (middle),
and 1.0 (bottom) addition of LiBr, respectively, to the 2-0.2 LiI-I2 sample. ... 75 Figure 4.51. The POM images of the samples with 0.2, 0.4 (top), 0.6, 0.8 (middle),
and 1.0 (bottom) addition of LiNO3, respectively, to the 2-0.2 LiI-I2 sample. ... 76 Figure 4.52. The ATR-FTIR spectra of the LiCl-LiI-I2 samples after 1 day. ... 76
Figure 4.53. The ATR-FTIR spectra of the LiBr addition to the 2-0.2 LiI-I2 samples after 1 day. ... 77
Figure 4.54. The ATR-FTIR spectra of the LiNO3 addition to the 2-0.2 LiI-I2
samples after 1 day. ... 77
Figure 4.55. The ATR-FTIR spectra of 0.2 mole ratio of LiBr, LiCl, and LiNO3
added samples after 1 day. ... 78
Figure 4.56. The ionic conductivity data of the LiCl, LiBr, and LiNO3 additions to the LiI-I2 samples, and the sample with no additions. ... 79 Figure 4.57. The UV-vis absorption spectra of the LiI-I2 samples upon addition of the other lithium salts. ... 80
Figure 4.58. The I-V curve of the 2-0.2 LiI-I2 sample prepared with an excess water. ... 82
Figure 4.59. The I-V curve of 2-0.2 gel dissolved in excess ethanol. ... 83 Figure 4.60. The comparison of I-V curves of 2-0.2 gel samples dissolved in excess
ethanol, and the effect of water on it. ... 83
Figure 4.61. The I-V curves of DSSCs with 2-0.2 samples prepared as solution,
and the effect of water on efficiencies. ... 84
Figure 4.62. The I-V curves of DSSCs with different procedures of TiO2 layers 85
Figure 4.63. The I-V curves of the 2-0.2 (LiI-I2) samples with LiCl, LiBr, and LiNO3 additions. ... 86 Figure 4.64. The UV-Vis absorption spectra of the LiI-I2 electrolytes with and without LiNO3, LiCl, and LiBr added upon dissolving from the electrodes. ... 87
xvii
LIST OF TABLES
Table 3.1. Preparation of the samples with LiCl-C12EO10-H2O system. ... 33 Table 3.2. Preparation of the samples with LiI- C12EO10-H2O system. ... 34 Table 3.3. Preparation of gel and solution phase electrolytes with redox couple. 34 Table 3.4. Preparation of the solution phases of LiCl added redox couple
samples. ... 34
Table 3.5. Preparation of the solution phases of LiBr added redox couple
samples. ... 35
Table 3.6. Preparation of the solution phases of LiNO3 added redox couple samples. ... 35
Table 4.1. The conductivity results of LiCl-C12EO10-H2O samples ... 48 Table 4.2. The conductivity results for LiCl, LiBr, and LiNO3 additions to the LiI-I2 samples. ... 79 Table 4.3. The photovoltaic characteristics of DSSCs with different
xviii
LIST OF ABBREVIATIONS
LC Liquid Crystal
LLC Lyotropic Liquid Crystal
TLC Thermotropic Liquid Crystal
CTAB Cetyl Trimethyl Ammonium Bromide
SDS Sodium Dodecyl Sulfate
C12EO10 Decaethylene glycol monododecyl ether
CMC Critical Micelle Concentration
Lα, Lβ Lamellar Phase
I1, I2 Cubic Phase
V1, V2 Bicontinuous Cubic Phase
H1, H2 Hexagonal Phase
L1 Micellar Phase
CPP Critical Packing Parameter
TMS Transition Metal Salts
DSSC Dye Sensitized Solar Cell
HOMO Highest Occupied Molecular Orbital
LUMO Lowest Unoccupied Molecular Orbital
VB Valence Band
CB Conduction Band
FTO Fluorine doped Tin Oxide
ITO Indium doped Tin Oxide
FF Fill Factor
Voc Open Circuit Voltage
Isc Short Circuit Current
Jsc Short Circuit Current Density
Rsh Shunt Resistance Rs Series Resistance WE Working Electrode CE Counter Electrode N719 Di-tetrabutylammonium cis-bis(isothiocyanato)bis(2,2’-bipyridyl-4,4’dicarboxylato) Ruthenium(II)
xix
AN Acetonitrile
EtOH Ethanol
IL Ionic Liquid
POM Polarized Optical Microscope
XRD X-Ray Diffraction
FT-IR Fourier Transform-Infra Red
ATR Attenuated Total Reflectance
UV-VIS Ultra Violet-Visible
1
CHAPTER 1
1. INTRODUCTION
Between solid and liquid phases of materials, there is also one more phase, which is called liquid crystalline phase. In liquid crystalline phase, material shows the properties of both solid and liquid phases. A material which is in liquid crystalline phase can be liquid-like in terms of viscosity but it can show oriented crystalline structure, which can be observed under a microscope or diffracts x-rays at small angles, like solids.
These oriented crystalline structures can be birefringent or non-refringent. Birefringent materials are also called anisotropic (properties change with direction) materials and non-refringent means isotropic (properties of them are uniform in all directions). Birefringence was first mentioned in 1669, but the explanation of it came later, in the 19th century. Augustin-Jean Fresnel used polarization to explain this effect. When it is inspected between two crossed polarizing filters, the crystals display colorful futures; this is called birefringence due to double refractive index. First liquid crystalline state of a material was discovered accidentally by Friedrich Reinitzer, in 1888, when he saw the material that he studied had two different melting points[3]. The name liquid crystal was given by Otto Lehmann.
There are two major types of liquid crystalline phases that are thermotropic (TLC), lyotropic (LLC) mesophases. Thermotropic phases of liquid crystals go into phase transformation by temperature changes. Lyotropic liquid crystalline phases exhibit phase transformation with the change in concentration of solvent, which is usually water.
Also there are many mesostructures in the categories of liquid crystals. These are nematic, smectic, chiral nematic, chiral smectic, columnar phases for rod-like thermotropic liquid crystals; discotic nematic and discotic columnar phases for disc-like thermotropic liquid crystals; and cubic, bicontinuous cubic, hexagonal, lamellar phases for lyotropic liquid crystals.
Liquid crystals are used in many areas due to their unique properties. For instance, they have really high ionic conductivity in some cases and because of that they are used as electrolytes. Their advantages can be listed as ionic mobility, high
2
conductivity and so on. Thanks to these properties and easiness of preparation they are really useful for solar cell applications.
People are still investigating the liquid crystals because of the unique and useful properties of them mentioned above.
3
CHAPTER 2
2. BACKGROUND
2.1. Liquid Crystals
Liquid crystal (LC) is the phase between solid and liquid. This is why, liquid crystalline materials exhibit the properties of both solid and liquid. They have organized and oriented structures like solids and they flow like liquids, Figure 2.1.
Solids have intermolecular forces for keeping their molecules oriented together. Liquids are isotropic materials since they do not show long-range orientational order, which means that they show same optical, mechanical and magnetic properties independent of directions in space, they have single refractive index. From liquid to liquid crystal phase, there is a change in orientation; they show anistropic behavior by becoming more oriented than molecules in a liquid substance. In liquid crystal phase, some molecules have ordered arrangement due to intermolecular forces but some of them are random.[4] If solids are considered to have layers, and the molecules show very well-ordered orientation in these layers; then it can be said that liquid crystals have still layers but the molecules show random orientation in these layers.
Some phases of liquid crystals are anisotropic unlike liquids as mentioned. This is why they are birefringent under a polarizing optical microscope. Birefringent means that they exhibit two refractive index. When light travels faster or slower in one direction than the other, due to the difference in refractive indices,
Figure 2.1. The phase transformation from solid to liquid and an illustration of them
4
the birefringence is observed. This phenomena was first explained by Erasmus Bartholin with his work with calcite crystals.[5]
Liquid crystals have many phases in terms of mesostructures or orientations and properties. If the molecular weight is low, these phases of LCs can be categorized as thermotropic and lyotropic phases. In some liquid crystal phases, when the temperature is too high or too low, this phase is lost. It means that phase transition depends on temperature. This kind of liquid crystals are called thermotropic LCs and they do not need solvent.[6] However, in addition to the function of temperature, lyotropic LCs depend also on concentration of the ingredients forming the LLCs. In LLCs, concentration and type of solvent molecules are important parameters.
To explain the TLCs, it is needed to look at the shapes of molecules. For instance, calamitic liquid crystals are one group of TLCs and their molecules are rod-shaped. The other group of TLC is discotic and in this case, their molecules are disc-shaped, Figure 2.2.[7]
Figure 2.2. The representation of molecules in calamitic (left) and discotic (right)
LCs.
Calamitic liquid crystals have molecules in which one molecular axis is longer than the others. Since they have rod-like shapes they can arrange along different axes. This varying orientation produces different subphases such as nematic (N) and smectic (Sm).[8] If molecules are aligned along their long axes but the ends of the molecules are not parallel to each other, this phase is called nematic. However, in smectic phase, molecules are parallel to each other and they form separate layers. There are more than one kind of smectic phase depending on the position of their long axes. Nematic phase is the less ordered than smectic phase.
5
When temperature is too high, the material shows isotropic property since it is in liquid phase. As temperature decreases, the phase transition is from isotropic to nematic. It is called nematic-isotropic transition temperature and it is different for every material.[9] After further decreasing in temperature, a phase transition from nematic to smectic is observed.
Besides from these, there is also cholesteric phase, which is also called chiral nematic phase (N*). Only chiral molecules can form this phase. This phase was first discovered in 1888 in cholesterol derivatives and the name was coined because of that.[3] The other phase is called chiral smectic phase (Sm*) and the liquid crystals which exhibit this phase, have ferroelectric properties, see Figure
2.3.
Figure 2.4 shows a representation of discotic liquid crystals. They tend to
form either discotic columnar phases by stacking its molecules in one direction; or discotic nematic phase in which disc-like molecules are oriented in layers, similarly.
Figure 2.3. A representation for isotropic, nematic and smectic phases,
respectively.
Besides TLCs, there is a more important type in this category and it is called lyotropic liquid crystal (LLC). In this phase, there is again temperature dependence; however, there is also another parameter which is the concentration of the solvent and surfactant. On the contrary to TLCs, a solvent is needed for lyotropic type. The
6
molecules of LLCs have both hydrophilic head groups and hydrophobic chains (amphiphilic molecules, see Figure 2.5), and they aggregate in the presence of an appropriate solvent (water is generally used). Some amphiphiles are phospholipids, fatty acids and they can be used as detergents. Surfactants are detergent-like amphiphilic materials. They contain both hydrophobic and hydrophilic parts. Hydrophilic part can be ionic or non-ionic and it determines the surfactant’s type (anionic, cationic or non-ionic). Sodium dodecyl sulfate (SDS, anionic surfactant)[10]; cetyltrimethylammonium bromide (CTAB, cationic surfactant)[10]; and decaethylene glycol monododecyl ether (C12EO10, non-ionic
surfactant) are three of the most studied surfactants. The tail part is the hydrophobic part, and it can be hydrocarbon chains (8-10 carbon chain), which do not mix with water, if water is the solvent in the LLC media.
Aggregation of these molecules in a solvent is a self-assembly (micellization) process[11] and it happens because of hydrophobic effect. Hydrophilic groups are arranged so that hydrophobic parts do not contact with water. Hydrophilic parts form hydrogen bonding with water by breaking the hydrogen bonding between water molecules, Figure 2.6. The self-assembly of these molecules produce micelles and vesicles. The resulting structure differs on an account of the type of surfactant, concentration, and type of solvent. The most influential parameter is the concentration of solvent.
Figure 2.5. Schematic representation of amphiphilic molecule which contains hydrophobic and hydrophilic parts.
Figure 2.6.Schematic representation of micelle (left) and vesicle (right) structure of a surfactant.
7
Surfactants are surface active materials. When they are used in very low concentrations, surfactant molecules are aligned in a way that they are at the surface of the solvent. Therefore, they can reduce the surface tension of the solvent (such as water, most common solvent) at the interface between the water and air.[12] The concept of aggregation of surfactants is a subject of an increasing interest, that includes type of solvents and also mixtures of some solvents.[13]–[17]
The aggregate of surfactant molecules is called micelle, as mentioned above, since it is thermodynamically stable[18]. One of the most important parameters in terms of determining the structure of micelles is the length of the hydrophobic non-polar tail of the surfactant molecules. The number of the amphiphilic molecules in them is also important and it is called aggregation number. Besides from these parameters, there is also a critical micelle concentration (CMC), which is important for a micelle to form. If the surfactant concentration is above CMC, the micelle formation starts. At high concentrations of amphiphilic molecules in water, above CMC, the number of formed micelles increases continuously, and therefore viscosity of the material solution increases. This situation causes the formation of the lyotropic liquid crystalline phase.
2.1.1. Lyotropic Liquid Crystalline (LLC) Mesophases
Concentration of the surfactant, temperature, molecular structure are all determinants for resulting phases of lyotropic liquid crystals.[19] These phases of lyotropic liquid crystals are called mesophases[20] and they can be categorized as lamellar phase (L), discontinuous cubic phase (I), bicontinuous cubic phase (V), and hexagonal phase (H).
Lamellar phase (L) is also an anisotropic phase.[7], [21] In this phase, surfactant molecules form bilayers in terms of arrangement. They contain water between these bilayers and this is why a material which is in lamellar phase is less viscous than in hexagonal phase. The subscript of L can take α (due to liquid-like alkyl chains) or β (due to ordered gel-like alkyl chains).[22] The characteristic texture of Lα under polarized optical microscope is mosaic-like texture and it is
called streaky texture.[23] For Lβ, the characteristic texture is called twisted-ribbons
8
1Figure 2.7. The POM image of a sample with corkscrew structure.[25]
Cubic phase (I) is optically isotropic and there is no texture to be observed under POM in this phase. In the cubic phase, the concentration of micelles is high, therefore they tend to pack together. A material, which is in a cubic LLC phase is extremely viscous, compared to a hexagonal LLC phase. The micelles are usually packed in a body-centered cubic (bcc) arrangement, however, face-centered cubic (fcc) and clathrate (both type 1 and type 2) packing are also possible.[21] If molecules in the micelles are aligned normal (hydrophilic parts are facing to the solvent molecules), I takes 1 as a subscript (I1) and if they are reversed it takes 2 as
the subscript (I2). There is also bicontinuous cubic phase[26] (V) which does not
exhibit any optical isotropy, same as all other cubic phases.
Hexagonal phase (H) is optically anisotropic on the contrary to cubic phase. This is why they exhibit birefringent texture under polarized optical microscope.[7], [21] This phase can be categorized into two, hexagonal phase (H1) and reversed
hexagonal phase (H2), depends on whether micelles are normal or reversed. For
normal arrangement, non-polar tails of surfactant molecules are directed inwards, whereas for reversed arrangement non-polar tails of surfactant molecules are directed outwards.[23] 2D hexagonal phase gives specific texture, which is called fan texture. Besides from 2D, there is also 3D hexagonal phase of LLCs, where the shape of the micelles are cylindrical and spherical, respectively.
In terms of viscosity, lamellar phase is less viscous than hexagonal phase, and hexagonal phase is less viscous than cubic phases.
1 Reprinted with permission from (Frankel DA, O’Brien DF. Supramolecular Assemblies of Diacetylenic
9
To explain phase transition between those mesophases, it can be said that; I1 H1 V1 Lα; and this order of phase transition occurs with an increasing in
the surfactant concentration. Also with increasing concentration, for some systems, inverted phases can be also be obtained (see Figure 2.9[27]).
Since there are more than one factor (temperature, hydrocarbon unsaturation, hydration etc.) for LLC phases to prefer a structure, it is useful to predict the shape of them by using a shape parameter. This shape parameter is called critical packing parameter (CPP). It is defined as;
2 Reprinted with permission from Forrest BJ, Reeves LW. New lyotropic liquid crystals composed of finite
nonspherical micelles. Chem Rev. 1981;81(1):1-14. doi:10.1021/cr00041a001 .Copyright (1981) American Chemical Society.
3 [Goodby JW, Görtz V, Cowling SJ, et al. Thermotropic liquid crystalline glycolipids. Chem Soc Rev.
2007;36(12):1971-2032. doi:10.1039/b708458g] - Reproduced by permission of The Royal Society of Chemistry.
2Figure 2.8. A schematic representation for mesophases of LLCs, on top lamellar (left) and bicontinuous cubic (right), at bottom hexagonal (left) and cubic (right) phases.[23]
3Figure 2.9. An illustration for phase transition between LLC mesophases as concentration of surfactant increased.
10 𝑠 = 𝑣𝑐
𝑎0𝑙𝑐
where 𝑣𝑐 is the volume of the hydrophobic chain, 𝑎0 is the area of the hydrophilic core and 𝑙𝑐 is the length of the hydrophobic chain.[28] If s < 1/3 it is spherical micellar unit, if s is 1/2 it can be said as hexagonal (cylindrical), and if it is around 1, lamellar structure can be predicted.[29]
2.1.2. Poly(ethylene oxide) Type Surfactant Systems (CmEOn + H2O)
CmEOn type non-ionic surfactants include both hydrophobic (alkyl) and
hydrophilic (ethylene oxide) parts in a single molecule. m is the number of carbon atoms in alkyl chain, and n is the number of ethylene oxide of the surfactant molecule. Ethylene oxide part is hydrophilic head and the alkyl chain is hydrophobic tail part. When the number m is increased, the efficiency of packing surfactant molecules into micelles is also increased.[30] Besides from the number m, also the temperature has an effect. When the temperature is increased, the hydrophilicity of the surfactant molecules is also increased and hydrophobicity is decreased.[31]
In these systems, when the water content in the mixture is increased (when surfactant concentration is decreased), the phase transformation occurs from I2
H2 V2 Lα V1 H1 I1, see Figure 2.10.[32], [33]
In these phase diagrams, phase behavior of all CmEOn type surfactants is
similar. However, when the number n is increased, i.e. the number of the ethoxy groups is increased; it means that surfactant molecule becomes more hydrophilic. Therefore, the phase diagram can shift to the left, since it becomes more likely to form normal micelle liquid crystals.[34]
11 4Figure 2.10. Phase behavior of C10EO
8 with the change in the content of water.[32]
2.1.3. Additives in CmEOn + H2O Type Surfactant Systems
Salts as additives can change the shape parameter(s) of LCs. If salts are added to this system, phase behavior is affected dramatically, not by the cations but by the anions.[35] According to the work of Hofmeister and Lewith; SO42- > HPO4
2-> CrO42- > CO32- > F- > Cl- > Br- > NO3- > I- > ClO4- > SCN- is the series of anions
for salting out or salting in processes. Also there is another series for the cations, which is; NH4+ > K+ > Na+ > Li+ > Mg2+ > Ca2+ > guanidinium. These ions can be
categorized into two separate groups. One of them is kosmotropic, the other one is chaotropic ions. This categorization can be done by depending on their abilities to interact with water, and to change its structure. Kosmotropic ions, with high charge density, can interact with water strongly; and chaotropic ions, with low charge density, cannot.[36]
4 Reprinted from Nibu Y, Inoue T. Phase Behavior of Aqueous Mixtures of Some Polyethylene Glycol Decyl
Ethers Revealed by DSC and FT-IR Measurements. J Colloid Interface Sci. 1998;205(2):305-315., Copyright (1998), with permission from Elsevier
12
Kosmotropic (structure-maker or lyotropic) ions are the ones on the left side of the series. From right to left, surface tension of the solvent is increased. Thus, solubility of organic compounds in water is decreased, and hydrophobic interaction is strengthened. This leads to a process, which is called salting out. Aggregations can occur because of salting out process. On the other hand, chaotropic (structure-breaker or hydrotropic) ions are the ones on the right-hand side of the Hofmeister series. Just as the opposite of kosmotropes; from left to right, surface tension of the solvent is decreased. Therefore, solubility of nonpolar molecules in water is increased, causing to the process, which is called salting in. This gives result to the increase in solubility of salt.[35]–[37]
As it is mentioned above, the solubility of organic compounds can be greatly changed by these ions. Surfactants are also considered as organic compounds. In this context, it can be said that, these additives can change the solubility of CmEOn
type surfactants in water. From left of the Hofmeister series to the right side, cloud point and critical micelle concentration of surfactant molecules decreases. For instance, from the phase diagram in Figure 2.11, it can be said that adding different cations gives the effect as CsCl < NaCl < LiCl in terms of expanding the Lα phase
region. Smaller the cation which is added, the bigger the expansion is, due to the fact that Li+ has the strongest hydration. Strongest hydration requires larger amount
of water. That is why, Lα region is expanded the most in the case of smaller
cation.[38]
5Figure 2.11. Phase diagrams of C12EO
7 + H2O system with the addition of LiCl
13
For another example, Sharma et al. studied cloud points of surfactants. Cloud point is that the temperature above which the surfactant is no longer soluble in water. According to Figure 2.12, the cloud points of surfactants decrease with F -> Cl- > Br- > I- anions.[39] The reason is that, water molecules which are close enough to each other, do not form hydrogen bonds with ethylene oxide parts. Therefore, kosmotropic ions cause dehydration of ethylene oxide units; this is why cloud point drops in the case of kosmotropic ions (from right to left in Hofmeister series).
Also, besides from these studies, Inoue et al. investigate the anion effect in this series with C12EO7 + H2O systems. They used NaCl, NaI, NaClO4 salts as
additives with different concentrations of surfactants. As a result, they found that, since Cl- anion is in a border between kosmotropes and chaotropes, its influence is weak. In this case, Na+ (as a kosmotrope) takes the role for shrinking the H1 region
while it expands the Lα region. In other two cases, ClO4- anion is located on the
right side of I-, so it has more chaotropic effect on the surfactant. Thus, hydration of ethylene oxide unit is more in the case of ClO4- addition. That is why, Lα region
is became smaller and H1 region is became larger, see Figure 2.13.[40]
5 Reprinted with permission from LQ, Minamikawa H, Harada K, Inoue T, Chernik GG. Effect of inorganic
salts on the phase behavior of an aqueous mixture of heptaethylene glycol dodecyl ether. Langmuir. 2003;19(25):10487-10494. doi:10.1021/la030182l. Copyright (2003) American Chemical Society.
6 Reprinted from Sharma KS, Patil SR, Rakshit AK. Study of the cloud point of C12En nonionic surfactants:
Effect of additives. Colloids Surfaces A Physicochem Eng Asp. 2003;219(1-3):67-74., Copyright (2003), with permission from Elsevier.
6Figure 2.12. The effects of NaX salts on the cloud points of different surfactants.[39]
14
2.2. Salt-Surfactant System
The salt addition to the liquid crystalline systems has been investigated over the years. In these studies, it was found that the structure of liquid crystalline mesophases (hexagonal, cubic or lamellar depending on the type of salts, counter ions and concentrations) depend on the interactions of water molecules with surfactant molecules. Consequently, the added salts were dissolved in this hydrophilic environment and influence those interactions.[41]–[44]
In 2001, Dag group discovered a new liquid crystalline system with transition metal salts and non-ionic surfactants. In this study, non-ionic surfactants are oligo (ethylene oxide) type surfactants (such as C12EO10) and transition metal
(Co2+, Ni2+, Zn2+, and Cd2+) nitrate salts (TMS). Here, the transition metal aqua complexes undergo self-assembly process with the addition of non-ionic surfactants, and they form liquid crystalline phases, see Figure 2.14. For Cd2+ salts, all ratios up to 3.5/1 mole ratio of salt/surfactant give hexagonal LLC phase with characteristic fan texture. Above that ratio, the phase is cubic up to 4.5 and becomes disordered liquid above 4.5 mole ratio. The case for Ni2+ and Co2+ salts, this ratio is 3.2/1 mole ratio.[45] The interesting point in here is that, when the metal ions are in the system the ratio for forming stable LC phases is four times higher than that of surfactant-water systems.
7 Reprinted from Inoue T, Yokoyama Y, Zheng LQ. Hofmeister anion effect on aqueous phase behavior of
heptaethylene glycol dodecyl ether. J Colloid Interface Sci. 2004;274(1):349-353., Copyright (2004), with permission from Elsevier.
7Figure 2.13. The effects of NaX salts addition on the phase diagrams of C12EO7.[40]
15
In 2004 and 2005, they expanded their investigation, and they found out that just like oligo (ethylene oxides), pluronics (P65, P85, P103, and P123) with TMS also form LLC phase. This time not only nitrates were tried, but also chlorides and perchlorates were investigated. They all form lyotropic liquid crystalline phases with the help of oligo (ethylene oxides) and pluronics. However, in the pluronic systems, lamellar and tetragonal mesophases of LLCs are also observed in addition the more common mesophases such as hexagonal and cubic.[45]–[47] The salt-surfactant LLC phase formation is sensitive to Hofmeister series in terms of solubility of the TMS. Also, temperature has an impact on phase formation. At high temperatures, the LLC phase of non-ionic surfactant with TMS melt but upon cooling it reforms.[46] The system with two surfactants (charged surfactants in addition to non-ionic 10-lauryl-ether) and the effect of charged surfactant were also investigated in the [Zn(H2O)6](NO3)2 + C12EO10 + H2O system. In this study, SDS
and CTAB were used as anionic and cationic surfactants, respectively. Later the salt-surfactant mesophases were extended to alkali and alkaline metal salts (see latter).[1] The structure of LLC can be changed by changing the concentration of metal salts, temperature, or counter ions. For example, nitrate salts of lithium form hexagonal LLC phases, whereas perchlorate salts form cubic, isotropic LLC phases.[45]–[48]
8Figure 2.14. Hydrogen bonding between coordinated water molecules of TMS and ethylene oxide units of surfactant.[45]
8 Reprinted from Celik O, Dag Ö. A new lyotropic liquid crystalline system:oligo(ethylene oxide) surfactants
with [M(H2O)n]Xm Transition metal complexes. Angew Chem Int Ed.;113(20):3915-3919 (2001), with permissions from John Wiley & Sons.
16
In these systems, ethylene oxide units of the surfactant molecules do not undergo chemical reaction with the metal center. It means, when the metal salts are added, water molecules stay in the coordination sphere. These coordinated water molecules of transition metal salts form hydrogen bonding with the ethylene oxide units of the surfactant. This causes the formation of LLC phase. Due to the fact that the hydrogen bonding of these systems is much stronger than that of surfactant-water systems; thus salt-surfactant systems have higher isotropization points (IPs). The IP or melting point can be as high as 110 ºC in the hexagonal phase.[45]
Besides from structure, there is one more important point, and that is the solubility of TMS in these systems. For instance, the overall charge is decreased in the nitrate salt-surfactant mesophases by coordination of the nitrate ion to the metal ion center that enhances the solubility of TMS in the LLC media.[45] However, when sulfate salts of transition metals are used, the solubility is found to be very small to form LLC mesophase.[45]
In addition to the Co2+, Zn2+ is also one of the most commonly and widely studied metal in these systems. According to a work of Dag and his group, salt species are in the molten phase and additionally they act as a solvent in the [Zn(H2O)6](NO3)2-C12EO10 LLC mesophases. The first phase diagram of the
salt-surfactant has been constructed from the zinc nitrate system, the phase behavior of salt-surfactant is very similar to the water-surfactant systems. The V1 H1 I1
L1 phase transition are observed with increasing the solvent amount (see Figure 2.15). However, what is interesting is that these mesophases show unexpected
behaviors at low temperatures on the contrary to the rest of the LLC systems. A glass transition temperature is observed around -52 °C and the phase is transformed into a very stable mesostructured solid below that temperature.[49]
17
After studying transition metal salts with various types of surfactants, Dag and his group started to investigate non-transition metal salts in the same system such as LiNO3, LiCl, and LiClO4. It has been found out that lithium salts also form
LLC mesophases with little amount of water and oligo (ethylene oxide) type surfactants (CmEOn) over a broad range of compositions.[50] Just like in the case
of transition metal salts, alkali metal salts are hydrated and they act like a solvent in this system. One of the most important and useful property of lithium salt-surfactant LLC mesophases is their high ionic conductivity (7.0 x 10⁻³ S/cm) that
gives rise the possibilities for them to be used as gel-electrolytes.[50]
In 2014, the LiNO3 and LiCl salts were investigated using some pluronics
to enhance the study of alkali metal salts LLC systems.[51] The lithium salt-pluronic LLC mesophases also form over a broad range of salt concentrations. From 5 to 15 salt/surfactant mole ratio, they form hexagonal and birefringent LLC mesophases and with the increase in salt content they transform first to cubic phase, then to disordered phase and finally to a liquid phase. However, at low concentrations surfactant leaches out and creating two different salt-rich and salt free phases by undergoing a phase separation. Their conductivities are still high and can be used as gel-electrolytes as well.[51]
9 Reprinted with permission from Albayrak C, Özkan N, Dag Ö. Origin of lyotropic liquid crystalline
mesophase formation and liquid crystalline to mesostructured solid transformation in the metal nitrate salt-surfactant systems. Langmuir. 2011;27(3):870-873., Copyright (2011) American Chemical Society.
9Figure 2.15. The phase diagram of ZnX-C12EO
10 (ZnX is [Zn(H2O)6](NO3)2)
18
2.3. Soft Confinement Effect and Origin of Salt-Surfactant Mesophases
The properties of a material are changed enormously, when there is a change in the size of that material. The morphology, chain dynamics, and many other material properties such as glass transition temperature, solubility, and mechanical properties exhibit a change from bulk material to nano-sized material. This can be explained by confinement effect (CE). Confinement effect can be divided into two categories; one of them is hard confinement effect, and the other one is soft confinement effect. Hard confinement effect is about the effect on solid materials, whereas soft confinement effect is about soft materials such as polymers,[52], [53] liquids,[54], [55] and liquid crystals.[56], [57] Here, the soft confinement effect will be explained in detail.
The theory behind this effect is explained by the confinement effect. When the particles are confined in small pores, for instance, their properties can be modified. The important point is the change in the surface area-to-volume ratio. When size is decreased, this ratio increases. This way the amount of surface atoms increases in terms of percentage; thus the properties of the nano-sized particles exhibit difference in compare to the bulk materials, due to the fact that these properties are all size-dependent properties.[58] It is known that freezing and melting point of these confined materials were depressed drastically.[59]–[62] For example, for CdS material, melting temperature varies from 1600 to 400 °C when size of the material changes.[59]–[62] In another study, Awschalom and Warnock stated that not only the confinement itself affects the properties, but also the confining geometry plays a critical role. The confining walls change the confining geometry and it leads to a change in the behavior of liquids.[60] The reason for melting point to decrease is that again high surface area-to-volume ratio (SA/V). High SA/V ratio leads to surface atoms to have less neighboring atoms for the formation of bonds. Thus, they have lower cohesive energy in compared to bulk materials. Cohesive energy is the thermal energy which is needed for a free atom to form a solid. This is why the melting temperature is proportional to the cohesive energy. Thus, when a material has high SA/V ratio, it means that it has a lower cohesive energy, and lower melting temperature. This change in melting temperature can be calculated by Gibbs-Thomson effect with an equation;
19 ∆𝑇 =2𝛾𝑠𝑙𝑣𝑇0
∆𝐻𝑓𝑑
where ∆𝐻𝑓 is the bulk heat of fusion, 𝛾𝑠𝑙 is the interface energy between solid and liquid, 𝑣 is the molar volume, 𝑇0 is the melting temperature of bulk material, and d is the diameter of the particle.[63], [64] With this equation, the change in the melting point of a confined material can be calculated from the melting temperature of its bulk.
Besides from the change in the melting temperature, the electrical and optical properties can also exhibit differences in confined materials, due to quantum size effects. When the size is decreased, the electronic excitations shift to higher energy levels, this can cause a change in the density of electronic energy levels. Thus, optical and electrical properties of materials can be changed by modifying the size of the particles.[58] Because of these changes in terms of the properties of nano-sized materials, salt-surfactant mesophases are started to be investigated and studied widely.
2.4. Dye Sensitized Solar Cells
Dye sensitized solar cells (DSSCs) are widely investigated as photovoltaic devices due to low-cost and their simplicity. DSSCs consist of an anode, electrolyte, and cathode. Anode is usually dye sensitized TiO2 that is coated over a transparent
electrode (usually fluoride doped tin oxide, FTO). The electrolyte is an acetonitrile solution of KI/I2 (as a redox couple) and the cathode is a Pt nanoparticle coated
FTO electrode. In acetonitrile, I- and I2 forms I3- ion. The working principle of
DSSCs (see Figure 2.16) is that the incident visible light is absorbed by dye molecules, anchored over TiO2 particle, the excited dye molecules transfer their
electron(s) to the conduction band (CB) of TiO2 and get oxidized. TiO2 conducts
these electrons to the counter electrode, where a reduction process takes place. The reduced I3- (that is 3I-) donates the electron back to regenerate the dye molecule and
20
10Figure 2.16. The schematic representation for working principle of a DSSC.[65]
The process is outlined as following: 𝐷 + ℎ𝑣 → 𝐷∗ (𝑑𝑦𝑒 𝑒𝑥𝑐𝑖𝑡𝑎𝑡𝑖𝑜𝑛) 𝐷∗ → 𝐷++ 𝑒− (𝑒𝑙𝑒𝑐𝑡𝑟𝑜𝑛 𝑖𝑛𝑗𝑒𝑐𝑡𝑖𝑜𝑛) 𝐷∗ → 𝐷(+ℎ𝑣) (𝑑𝑦𝑒 𝑟𝑒𝑙𝑎𝑥𝑎𝑡𝑖𝑜𝑛) 𝐷++ 𝑅 → 𝐷 + 𝑅+ (𝑑𝑦𝑒 𝑟𝑒𝑔𝑒𝑛𝑒𝑟𝑎𝑡𝑖𝑜𝑛) 𝐷++ 𝑒− → 𝐷 (𝑟𝑒𝑐𝑜𝑚𝑏𝑖𝑛𝑎𝑡𝑖𝑜𝑛 𝑡𝑜 𝑜𝑥𝑖𝑑𝑖𝑧𝑒𝑑 𝑑𝑦𝑒 𝑚𝑜𝑙𝑒𝑐𝑢𝑙𝑒𝑠) 𝑅++ 𝑒− → 𝑅 (𝑟𝑒𝑐𝑜𝑚𝑏𝑖𝑛𝑎𝑡𝑖𝑜𝑛 𝑡𝑜 𝑜𝑥𝑖𝑑𝑖𝑧𝑒𝑑 𝑟𝑒𝑑𝑜𝑥 𝑠𝑝𝑒𝑐𝑖𝑒𝑠)
The reason for dye coating on TiO2 nanoparticles is that, TiO2 is a
semiconductor with a very large band gap and cannot absorb visible light. To effectively absorb the sun light, it is necessary to sensitize using dye molecules. In the counter electrode, platinum nanoparticles act as a catalyst for the reduction of I3- ion. However, instead of Pt; carbon, graphene, gold can also be used. Finally the
electrolyte (it can be in a solid-state, liquid, or liquid crystalline form) provides charge transportation via redox couple.[66]
By completing the circuit, the solar energy is converted into electrical energy. There are two important parameters to define effectiveness of a DSSC; one is a fill factor (FF) and the other one is power conversion efficiency (η). The FF of a cell is defined as maximum power (Pmax = Imax * Vmax, see Figure 2.17) divided
by open circuit voltage (voltage at I = 0 intercept, Voc) times short circuit current
10 Reprinted from Nazeeruddin MK, Baranoff E, Grätzel M. Dye-sensitized solar cells: A brief overview. Sol
21
(current at V= 0 intercept, Isc). Power conversion efficiency is defined by the
multiplication of the short circuit photocurrent density (Jsc, Isc per area), open
circuit voltage, and fill factor divided by intensity of incident light (Pin).
𝐹𝐹 =(𝐼𝑚𝑎𝑥 ∗ 𝑉𝑚𝑎𝑥) (𝐼𝑠𝑐∗ 𝑉𝑠𝑐) = 𝑃𝑚𝑎𝑥 (𝐼𝑠𝑐∗ 𝑉𝑜𝑐) 𝜂 = 𝐽𝑠𝑐∗ 𝑉𝑜𝑐∗ 𝐹𝐹 𝑃𝑖𝑛
With a solar simulator, I-V curve of the photovoltaic cell can be measured. Here, by looking at the FF, the shape of the I-V curve can be determined. The FF of an ideal cell should be 1 (rectangular shape), however this is impossible in real cells due to resistances of electrolytes or many imperfections in the both electrodes. Therefore, FF can be in a range between 0 and 1.
To have higher FF, there are two important parameters; one of them is to have high shunt resistance (Rsh), and the other one is to have low series resistance
(Rs), Figure 2.18. Increasing the shunt resistance means that the current flows from
the cell, so the current is not split. Also, decreasing the series resistance causes even less losses of the photo generated current, so the open circuit voltage could be higher.[67] Series resistance is a resistance of the electrolyte. So, when a highly conductive electrolytes are used, the series resistance would be lower. Shunt resistance is occurred due to the anode electrode.
Figure 2.17. I-V curve of a real cell (red line), an ideal one (dashed lines), and Pmax
(with blue line).[67]
Voc*Isc
22
In the I-V curve, the line, which is parallel to the x-axis changes by changing the shunt resistance, and the one, parallel to the y-axis changes as the series resistance change. If the shunt resistance is maximized and the series resistance is minimized, as much as possible, then the FF will be the highest since the I-V curve gets closer to the ideal shape.[67]
There are some other parameters that affect the efficiency and fill factor of a solar cell, such as the temperature of the cell. When the temperature applied to the crystals, which are used for the formation of photovoltaic cells, is increased, the band gap of semiconductor material (usually TiO2) is decreased. Therefore, open
circuit voltage is decreased. At higher temperatures, a better diffusion of the electrolyte can be achieved. Thus photocurrent is increased a little bit by increasing temperature. Despite the increase in current, this increase is not effective to cancel out the decreasing voltage values. Secondly, the other parameter is the initial light intensity. When light intensity is decreased, solar performance is also decreased.[68]
The working principle seems simple, however, there are many factors that affect the efficiency of a solar cell, such as blocking layer, defects on TiO2, surface
area for both dye and TiO2 particles, density, viscosity of electrolyte solution, redox
couple efficiency for regeneration of the oxidized dye molecules and so on. TiO2 is coated on the anode side as a mesoporous semiconductor thin film
that has large surface area and no toxicity. These properties make the titania ideal for coating the FTO surface to use as part of the anode in the DSSCs. It is also called working electrode (WE). Some other metal oxides have also been tested, such as ZnO[69], [70], SnO2[71], Nb2O5[72] and etc. due to the fact that they have different
Fermi energy. However, the best performance has been achieved from the anatase TiO2 nanoparticles. Anatase has the highest Fermi energy (Ef), therefore usually Figure 2.18. Schematic representation of shunt and series resistance in cell.[67]