P.â l P â ti »HL i ñ Ä ¡H£. ¡5 ‘H Iİ5
A THESIS
^'■l i * f !? *■■ f. i, ''!, V« ' -í JI· ->■' 5 Ί ,■ v‘.', ····'' 5*’ í Ï > *·|" ·'■'>" V····'" Vt>l ψ ^ ( y { ¡ < ^ ' ' i ’iC äTH£ ÍhjS üTí'ü i £
Oc¿Гѵ'^г.ч'\:'с.'г::'-;-ті
OF BäLKENT игЛѵВаЗіТѴ
FOñ THS DSG;FS£· OF
Т / (
7 ^ 7 / Д
' / r / j t/33S
FEMTOSECOND OPTICAL PARAMETRIC
AMPLIFIERS BASED ON BETA-BARIUM BORATE
CRYSTALS
A THESIS
SUBMITTED TO THE DEPARTMENT OF ELECTRICAL AND ELECTRONICS ENGINEERING
AND THE INSTITUTE OF ENGINEERING AND SCIENCES OF BILKENT UNIVERSITY
IN PARTIAL FULFILLMENT OF THE REQUIREMENTS FOR THE DEGREE OF
MASTER OF SCIENCE
By
Kahraman Güçlü Köprülü
Tl¿
■ké^ Ί3 9 ό
e -fi
I certify that I have read this thesis and that in my opinion it is fully adequate, in scope and in quality, as a thesis for the degree of .Master of Science.
.Assist. Prof. Dr. Orhan .Aytür (Supervisor)
I certify that I have read this thesis and that in my opinion it is fully adequate, in scope and in quality, as a thesis for the degree of Master of Science.
l ·
-Prof. Dr. Abdullah .Atalar
I certify that I have read this thesis and that in my opinion it is fully adequate, in scope and in quality, as a thesis for the degree of .Master of Science.
/A)
.Assoc. Prof. Dr. irşadı .Aksun
Approved for the Institute of Engineering and Sciences:
. Mehn5iet:^aray ' Prof. Dr.
ABSTRACT
FEMTOSECOND OPTICAL PARAMETRIC
AMPLIFIERS BASED ON BETA-BARIUM BORATE
CRYSTALS
Kahraman Güçlü Köprülü
M.S. in Electrical and Electronics Engineering
Supervisor: Assist. Prof. Dr. Orhan Ay tür
September 1996
In this thesis we describe our experiments to construct and evaluate non degenerate and degenerate optical parametric amplifiers (OP.-\) based on beta- barium borate (BBO ) crystals. VVe used a mode-locked Titanium.Sapphire laser at a wavelength of 830 nm and a pulse duration of 140 fs. The Ti:Sapphire laser was frequency doubled with a type-I BBO crystal. The frequency dou bled output of the laser was used to pump our OP.As. For 800 mVV’ of laser output, 300 mVV of maximum output power at the second harmonic was ob tained, corresponding to a 38% conversion efficiency. Both type-I and type-II BBO crystals were used for parametric amplification. The type-II crystal re sulted in a nondegenerate OPA due to the orthogonal polarizations of the signal and the idler beams. A degenerate OP.A was achieved with the type-I crystal. Phcise sensitive nature of the degenerate OPA, and phase insensitive nature of the nondegenerate OP.A were observed. The maximum gain of the degenerate OPA was measured to be 1.45, whereas the maximum gain of the nondegenerate OP.A was measured to be 1.0 2.
Keywords: optical parametric amplification, parametric gain, nonlinear crystals, BBO, second harmonic generation, ultrafast lasers, TiiSapphire.
ÖZET
BETA-BARYUM BORAT KRİSTALİ TEM ELLİ
FEMTOSANİYE OPTİK PARAMETİK YÜKSELTİCİLER
Kahraman Güçlü Köprülü
Elektrik ve Elektronik Mühendisliği Bölümü Yüksek Lisans
Tez Yöneticisi: Yar. Doç. Dr. Orhan Aytür
Evlül 1996
Bu tezde, dejenere ve dejenere-olmayan beta-baryum borat (BBO ) kristali bazlı optik parametrik yükselticiler (ОР.Л.) oluşturmak ve değerlendirmek için yaptığımız deneysel çalışmalar anlatılmaktadır. Dalga boyu 830 nm ve darbe uzunluğu 140 fs olan bir Titanyum:Safir lazeri kullandık. Tip-I BBO kristali kullanılarak Ti:Safir lazerinin frekansı ikiye katlanmıştır. Frekansı katlanmış lazer ışını OP.A.’ları pompalamak için kullanılmıştır. 800 mVV lazer çıkışı için %38 dönüşüm verimine karşılık gelen en yüksek 300 mVV ikinci harmonik elde edilmiştir. Parametrik yükseltme için hem tip-I hem de tip-II BBO kristali kullanılmıştır. Tip-II BBO kristali sinyal ve fazlalık ışınlarının birbir lerine dik polarizasyonları yüzünden dejenere-olmayan parametrik yükseltme sağlamıştır. Tip-I kristal ile dejenere bir OP.\ başarılmıştır. Dejenere OPA’nın faza bağımlılığı ve dejenere-olmayan OP.A’nın fazdan bağımsızlığı gözlenmiştir. Dejenere OPA’nınen yüksek kazancı 1.45, dejenere-olmayan OP.A’nınki ise 1.0 2
olarak ölçülmüştür.
Anahtar kelimeler, optik parametrik yükseltme, parametrik kazanç, doğrusal olmayan kristaller, BBO, ikinci harmonik üretimi, ultra hızlı lazer ler, Titanyum:Safir.
ACKNOWLEDGMENTS
I would like to express my sincere gratitude to Dr. Orhan Aytûr for his supervision, guidance, suggestion, and especially encouragement through the development of this thesis.
I would like to thank Dr. .\bdullah Atalar and Dr. Irşadi Aksun for reading the manuscript and commenting on the thesis.
I am indebted to Tolga Kartaloğlu for his help during the development of the thesis and experimental work.
I would like to thank İlhan Altug and Serdal Elver of Bilkent Uninersity’s Purchasing Department, and Mûrûvet Parlakay for all their help.
I would also like to express my thanks to the Turkish Scientific and Tech nical Research Concuil and NATO for their partial support of this work under Grant No. EEEAG-118 and Grant No. TU-MI.VIIC, respectively.
TABLE OF CONTENTS
1 INTRODUCTION
1
2 THEORY OF OPTICAL PARAMETRIC AMPLIFICATION
42 .1 Nonlinear M aterials... 4 2 .2 Three Wave Mixing in Second-Order Nonlinear Materials . . . . 6
2.3 Nondegenerate Optical Parametric .Amplification 9 2.4 Degenerate Optical Parametric .Amplification... 14
2.0 Second Harmonic Generation 16
2.6 Phase M atching... 18
3
EXPERIMENTAL WORK
22
3.1 The L a s e r ... 23
3 .2 Beta-Barium Borate C ry sta l... 24
3.3 Second Harmonic Generation 27
3 .4 Optical Parametric Am plification... 30 3.4.1 The Pump B e a m ... 30 3.4.2 Parametric .Amplification Using Focused Gaussian Beams 31 3.4.3 Effect of Group Velocity M ism a tc h ... 33 3.4.4 Detection of Ultrashort P u lses... 33
3.4.5 Degenerate Optical Parametric .Amplification .34 3.4.6 Nondegenerate Optical Parametric .Amplification -38
4 CONCLUSIONS
42
LIST OF FIGURES
2 .1 Schematic and energy diagram for optical parametric amplifica tion... 10 2 .2 Spatial evolution of signal and idler field intensities for a non
degenerate optical parametric amplifier for the case of no phase mismatch in the constant pump appro.ximation... 11
2.3 Dependence of parametric gain on the pump field intensity for constant length of interaction... 12
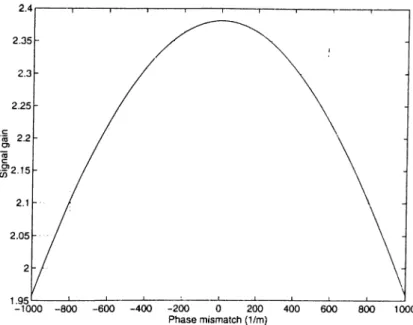
2.4 The signal gain of a nondegenerate optical parametric amplifier as a function of ... 13 2.5 Spatial evolution of signal and idler and pump photon fiuxes for
nondegenerate optical parametric amplified for the case of no phase mismatch... 14 2.6 Parametric gain of nondegenerate optical parametric amplifier
(NOPA) and degenerate optical parametric amplifier (DOP.A) when k
L
— 1 as a function of phase difference between the pump and the signal... 16 2.7 Schematic and energy diagram for second harmonic generation. 17 2.8 Spatial evolution of the fundamental and second harmonic fieldintensities for the case of perfect phase matching and the bound ary condition of no second harmonic field at the input... 18 2.9 Directions of polarizations for tui, U2, and wa for type-1 and
type-II phase matching in three wave mi.xing (tui -f- u.>2 = oj^)· . . 19
2.10 9 and 6 angles defined due to spherical coordinates... 20
3.1 Schematic of the optical parametric amplification e.xperiment. 23 3.2 Principal refractive indices for BBO crystal... 24 3.3 Phase matching curve for second harmonic generation in a type-I
BBO crystal. 2-5
3.4 Phase matching curve for second harmonic generation in a type-II BBO crystal... 2-5
3.5 E.xperimental setup for second harmonic generation... 27 3.6 .Average power of the second harmonic as a function of the av
erage power of the fundamental at the input of the crystal when the focal length of LI is 1 cm... 29 3.7 Average power of the second harmonic as a function of the av
erage power of the fundamental at the input of the crystal when the focal length of Ll is 2.5cm... 29 3.S .\verage power of the second harmonic as a function of the av
erage power of the fundamental at the input of the crystal when the focal length of Ll is 5cm ... 30 3.9 Generation of the pump beam using focused Gaussian beams
and a type-I BBO crystal... 31 3.10 Experimental setup for degenerate optical parametric amplifica
tion... 34 3.11 Beam geometry within the BBO crystal (not to scale). 35 3.12 Comparison of experimental results with the computer simulation. 36 3.13 Amplification and deamplification response of degenerate optical
parametric amplifier for different power levels of the signal. . . . 37 3.14 Ratio of the pump power at the output to the pump power at
the input for degenerate optical parametric amplifier for ampli fication and deamplification fesponses... 37
3.15 Experimental setup for nondegenerate optical parametric ampli fication... 39 3.16 Parametric gain of nondegenerate optical parametric amplifier
as a function of average power of the pump beam. The signal and the pump beams have the same polarization. 40 3.17 Parametric gain of nondegenerate optical parametric amplifier
as a function of average power of the pump beam. The signal and the pump beams have orthogonal polarizations... 41
Chapter 1
IN T R O D U C T IO N
Optical properties of most materials are modified by the presence of intense light. Usually, the response of the material to the optical field is a nonlinear function of optical intensity. Nonlinear optics is the study of phenomena that occur as a consequence of this property of optical materials. Typically, with or dinary light sources, one cannot reach the intensity levels that are high enough to observe nonlinear effects. Only laser light is sufficiently intense to modify the optical properties of a material system by a discernible amount.
Experiments in nonlinear optics began right after the invention of the laser [1]. The first experiment in nonlinear optics was performed by Franken [2], where the frequency of a ruby laser was doubled using a quartz crystal as the nonlinear medium. In frequency doubling two photons at the same frequency combine to produce one photon at twice that frequency. Frequency doubling is one example of a broader class of nonlinear processes called three-wave mixing. Many experiments have been performed since then to demonstrate mixing of three optical waves. Other three-wave mixing processes are sum frequency gen eration, where two photons at different frequencies are combined to produce one photon at the sum frequency, and difference frequency generation, where one photon is split into two photons at lower frequencies. Theoretical analysis of difference frequency generation has shown that amplification of light waves in a second-order nonlinear medium is possible. This process, called optical parametric amplification, was first demonstrated by Wang and Racette [3] in 1965. Since then, parametric amplificMion has widely been investigated as an alternative to laser amplification.
The high optical intensities required to observe nonlinear effects are hard to attain with continuous wave (cw) lasers. The ad\ent of pulsed lasers has solved this problem by providing very high intensities for a short duration of time., Further developments in laser technology have led to the usage of ultrafast laser systems that have pulsewidths on the order of 1 ps or less. These developments have opened up new research areas in optics.
.Another important technological advance is the production of new materi als with higher nonlinearities. Nowadays, most widely used nonlinear optical crystals are potcissium titanyl phosphate (K T P ), beta-barium borate (BBO ), and lithium triborate (LBO). These materials not only have high nonlinearities, but they are also broadly transparent and chemically stable. The usage of both pulsed Icisers and these highly nonlinear crystals has made optical parametric amplification a fruitful research area in nonlinear optics.
The gain produced by parametric amplifiers can be used to construct optical oscillators. .An optical parametric amplifier placed inside an optical cavity provides gain much like a laser medium does in lasers. This cavity, pumped by an e.xternal laser source is called an optical parametric oscillator (OPO). Using OPOs, frequency down-conversion of laser outputs has become possible. This has important technological consequences, since lasers operate at a limited number of wavelengths and OPOs can e.xtend this range to longer wavelengths. .Moreover, OPOs can be wavelength tuned whereas most lasers operate at a single wavelength. Furthermore, e.xtension to shorter wavelengths is possible by frequency doubling with another crystal inside the cavity. Optical parametric oscillation was first demonstrated by Giordimane and .Miller [4] in 1965. With the improvements in ultrafast laser systems, synchronously pumped optical parametric oscillators [5] have been developed to generate tunable femtosecond and picosecond pulses.
.Another important aspect of optical parametric amplification is the possi bility of generating non-classical optical fields. According to quantum theory, a laser operating well above threshold emits light in a quantum state called the coherent state [6]. For a coherent state, the number of photons over an obser vation period shows a Poisson distribution, which means that the variance of the photon number (quantum noise) is equal to the average number of photons. This sets a so called quantum limit to the minimum amount of noise that a classical optical field can have at best. After Yuen [7] theoretically showed the existence of squeezed states, it was discovered that these states can be gen erated using optical parametric amplifiers [8]. Squeezed states have reduced
quadrature amplitude noise compared to the coherent states, and provide de tection below the quantum limit [9]. Another method to provide detection below the quantum limit is also introduced using the benefit of highly corre lated output photon streams (twin beams) of OPAs. A noise reduction of more than 6 dB is possible using pulsed twin beams of light [10].
In this thesis, we designed and implemented femtosecond optical parametric amplifiers based on BBO crystals. VV'e used a mode-locked Titanium.Saphire laser as our source. First, the output of the laser was frequency doubled using a BBO crystal. The second harmonic was used to pump our optical parametric amplifiers. The remaining portion of the field at the fundamental frequency was used as the signal input to the amplifier after being attenuated. .At the output of the amplifier a third field, called the idler, was generated whose frequency is equal to the difference of the pump and the signal frequencies, which is equal to the frequency of the signal for our case.
We implemented two different types of optical parametric amplifiers. When the idler and the signal were indistinguishable from each other, the gain of the optical parametric amplifier Wcis dependent on the phase difference between the pump and the signal beams. This amplifier is called a phase sensitive amplifier. When the signal and the idler were distinguishable, due to their orthogonal polarizations, we observed that the gain of the optical parametric amplifier was independent of phase, resulting in a phase insensitive amplifier.
Chapter 2 presents the theoretical background for three wave mixing in second-order nonlinear media. In Chapter 3, properties of the laser and BBO crystals are described, the experimental work is presented, and . In this chap ter, results are compared with computer simulations. Finally, remarks and conclusions are provided in Chapter 4.
Chapter 2
TH EO R Y OF O PTICA L
PA R A M E T R IC
A M PL IFIC A T IO N
This chapter discusses optical nonlinearities. and how nonlinear materials can be used for three wave mixing. The coupled field equations that characterize three wave mixing and some special case solutions, such as optical parametric amplification and second harmonic generation, are presented next. Finally, phase matching considerations are discussed.
2.1 Nonlinear Materials
.All optical materials have some nonlinearity. To observe nonlinear effects ex perimentally, the nonlinearity of the material and the driving field intensity must be high enough. Some materials, which have higher nonlinearities with respect to others, show nonlinear responses to driving fields with high intensi ties provided by lasers. These are referred to a5 nonlinear materials.
In a non-magnetic material, the constitutive relations can be written as [1 1]
D = cqE + P (2·!)
B = fioH (2.2)
where y.Q and to are permeability and permitivity of free space, E and H are the electric and magnetic fields, D and B are the electric and magnetic flux densities, and P is the induced polarization, respectively. For linear materials, the polarization is related to the electric field by [1 1]
P = e o f · E (2.3)
where is known a.s the linear susceptibility tensor. The product of this tensor with a vector is known as the tensor product. One can always choose a Cartesian coordinate system such that only the diagonal elements of this tensor are nonzero. The elements of this tensor can be frequency dependent, to account for dispersion in the material.
For nonlinear materials, the polarization can be expressed as a power series of the electric field as [1 1]
P = ■ E + cqE ■ X · E + cqE · (E · X ■ E) + h.o.t = p(i) -f. p(2) p(3) ^ h.o.t.
^3)
(2.4) ^ 2)
where \ and x are the second and third order nonlinear susceptibility tensors. is called linear polarization and P^"^ is called nth order nonlinear polarization (n > 1). Usually, the effect of the second-order nonlinearity is much greater than all of the higher order nonlinearities. Therefore, one can neglect the effect of higher order nonlinearities if the second-order nonlinearity is nonzero. In centrosymmetric materials, which have inversion symmetry, the elements of even order susceptibility tensors vanish, which means that the second-order susceptibility also vanishes. In such materials, only the third order nonlinear effect is dominant.
In the analysis of nonlinear interactions, it is convenient to express the electric and second-order nonlinear polarization field vectors as discrete sums of frequency components as
E ( r .i) = i E [ E , ( r ) i ^ " - ' + E ,( r )-6- '" - ‘] (2..5) n
= ( E + P , . (2.6)
^ n
The summations are over positive frequency components. When these expres sions are substituted into Equation 2.4, we find that the second-order nonlinear polarization can be written as
where D is the number of distinct permutations of the applied frequencies and [1 1]. Since is associated with the time dependence and E,i is associated with the time dependence the second-order nonlinear polar ization resulting from their product is at a frequency of o,Vi -I- * ’„· Therefore, Y is e.xpressed as a function of these three frequency arguments where the first argument is always the sum of the other two. Similarly
I
= ^Z>CoE,(r)-Y‘V = ^ ' , - - m ) - E ; ( r )
(2.S) (•2.9)
The reason for why the nonlinear polarization plays an important role is that a time varying polarization can act as the source of new components of the electromagnetic field. Equations (2.7), (2.S), and (2.9) show the existence of coupling between the fields at frequencies and {ujm + u.’„ = in second-order nonlinear medium. This fact implies that three wave mixing is possible in second-order nonlinear medium. In the following section, we will describe how second-order nonlinearity can be used for three wave mixing.
2.2 Three Wave Mixing in Second-Order
Nonlinear Materials
Maxwell’s equations in a material where no free currents or charges are present can be written as
V D V X E V B V x H
Using Equations (2.1) and (2.2) one can derive the wave equation as ,/
1 ^2
V X V X E (r ,l) + ^ g ^ E ( r ,( ) = P ( r ,i) (2.14) where P (r, <) is defined in Equation (2.4). Since we are considering materials that exhibit second-order nonlinearities, we ignore all higher order terms. We
0 (2.1 0) d B dt (•2.1 1) 0 (•2.1-2) d B dt ■ (•2.13) 6
further say that
V · E = 0, (2.15)
which is a direct consequence of Equation (2.1 0) in homogeneous media. Using Equation (2.15), writing the polarization as the sum of linear and nonlinear parts, and replacing (1 + X^**) with n~. we end up with the equation
(2.16) where we have used the vector identity V x V x
E =
V( V ·E) — V ’E.
Replac ing (1 4· ,^^*) with is exactly true for isotropic materials. For anisotropic materials, this assumption is still valid if the propagation is along one of the principal axes, but otherwise fails sinceD
andE
vectors are no longer parallel to each other. This is known as the walk-off effect in biréfringent materials. If we assume that walk-off is small and does not destroy the nature of three wave mixing in the length of the interaction, we can think of n as the effective refractive index seen by the electric field at that specific polarization.For plane waves at frequencies u;i, u;2, ^'3 (j.^3 = u-’i +^.•2) propagating along the z-axis we can write
Ei {r, t )
= Re^E,(-)e-'^
= R e [A .(r)6^'<"'’‘- ‘ -'> (2.17) (2.18) P p ’(r ,i) = Re [?['**(r)e^<"'-‘-^-->
where i = 1,2,3. Now w'e can write the wave equation in Fourier domain cis V^(A3(z)e-^*’ ^) + i ^ A 3(z)e-^*=-’ = (2.19)
Using Equation (2.7) Рз^^(-^) can be written as
= f o E i ( : : ) · x ' ' ( u , ’3 — -^'1 + u ; 2 ) · E - 2 ( r ) . = (2) Substituting A .(2) У М з(2)е"^*^^ A,{z)a.i = 3 _ 2Д з ^ M i l e -Аз. dz dz (
2
.20
) (2 .2 1 ) (2
.22
)where a, is the unit vector in the direction of A,, and using the slowly varying envelope approximation [1 1] cPA-iit) dz^
<
d.4.3(c) dz (2.23)we end up with the equation
d :
= - J — Aa--).42(c)e-^^^-’
TI3C (2.24)
where
i\k ~ ^2 — k^ (2.2.5)
is the phase mismatch per unit length, and
dz —^ 8 3 · (ai · X (0/3 = w’l -f u.’2) · 8 2) (2.26) is the effective second-order nonlinear coefficient. Similarly,
■m'2 we get
for fields at uji and
az TiiC (2.27)
az rtic (2.28)
where
d\ = - a i · (a2 · X (o.’i = —■jJ2 + ^’3) ■ as)
¿2 = ^ ^2 · (a3 · X (û,'2 = w'3 — u;i) · a2). In a lossless medium, permutation symmetry requires [1 1]
d\ = ¿2 = <^3 = d = d*.
(2.29) (2.30)
(2.31) Equations (2.24), (2.27), and (2.28) describe the interaction of three collinear plane waves in a medium under the slowly varying amplitude approxima tion. The general solutions to A\, A2·, and A3 are in terms of Jacobi elliptic functions [1 2]. Given the field amplitudes at the input plane (* = 0) of a nonlinear material, these general solutions can be used to calculate field am plitudes at the output plane (z = L). The initial values are important since they determine the type of nonlinear ihteraction.
Possible types of nonlinear interactions in second-order nonlinear medium are sum frequency generation (SFG), difference frequency generation (DFG),
and second harmonic generation (SHG). In SFG, the fields at two different frequencies, u\ and are combined to produce an output at the sum frequency ■\-uJ2· SHG is the degenerate case of SFG in which the two input fields have the same frequency. .As a result, a field twice at the input frequency is present at the output. In DFG, the fields at two different frequencies, ^.’3 and are combined to produce an output at the difference frequency u,'2 = u.'3—u.7i. The theoretical analysis of DFG shows that the field at ^.’1 is amplified during the process. Therefore, DFG is also called optical parametric amplification.
In this thesis we restrict ourselves to optical parametric amplification and second harmonic generation cases only. The recison for why second harmonic generation is investigated is that it is used as a pump source for our optical parametric amplifier e.xperiments.
2.3 Nondegenerate Optical Parametric Am
plification
Optical parametric amplification is the process where the frequencies .^.’1 and are mi.xed to produce the difference frequency ^'2 = >^,’3 In this interaction, the photons at frequency W3 are split into photons at frequencies and cj-2
accounting for an increase in the number of photons at frequency .As a result, the intensity of the field at is amplified and photons at frequency u-i are created. The field at frequency ujz is called the pump since it is the energy source for the fields at the other tw'o frequencies. The field at frequency uy is called the signal since it is the amplified field and the field at frequency u>2 is called the idler.
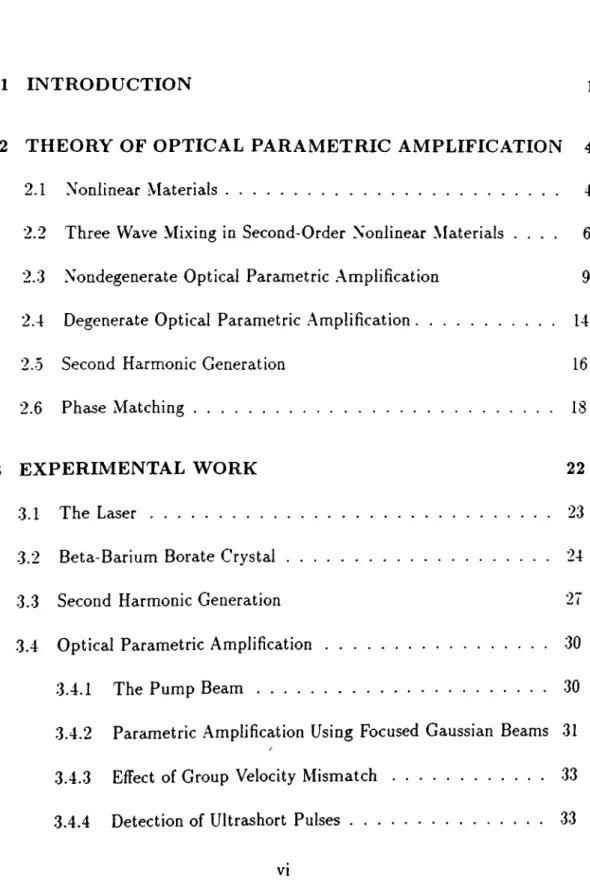
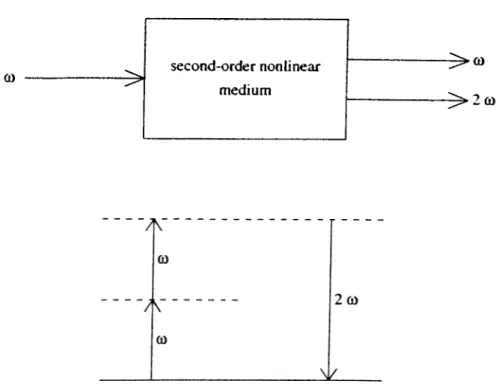
The signal and idler fields may be distinguished from each other by their frequencies, polarizations, or directions of propagation. If all these properties are the same, than the signal and idler are indistinguishable from each other. This situation is referred to cis the degenerate case. If at least one of the properties is different, then the signal and idler fields are distinguishable, and the interaction is nondegenerate. Figure 2.1 shows the schematic and energy diagram for optical parametric amplification.
We use the subscripts s, i, and p instead of 1, 2, .3 to represent the signal, idler, and pump waves. Putting the initial conditions such that the pump field
ü) pump signal second-order nonlinear medium pump siena] ■ > “ s idler >»03· =03-0) l p s
Figure 2.1: Schematic and energy diagram for optical parametric amplification. The dashed lines are virtual states.
is much stronger with respect to the signal and idler fields, i.e. Ap is assumed not to be depleted during the interaction and stays constant, the coupled mode equations become
dz n^c
^ dz = - íUiC2 íÍ a; ( , . ) V " ' ·
(2.M)
(2.33) For \ k — 0, which is referred to as the phase matched case, the solution to these equations can be written as [13]A ,(2) = i4,(0) cosh(/cz) - sinh(/cz) (2.34)
A,(z) = /4,(0) c o s h ( « z ) s i n h ( / c z ) (2.35) n.uq
where <t>p is the pump phase, i.e., Ap = jTpje·''’»’. The value of k is
(2.36) eon,n,np<r
where Ip is the intensity of the pump beam which is related to the amplitude of the electric field by
Ip=\np^c\A p\\ (2.37)
Since the input idler field is zero (/4,(0) = 0), the solutions become
/4,(z) = /4,(0)cosh(Kz) (2.38)
J < h I T l5IV {
niWs/4*(0) sinh(Kc). (2.39) The parametric gain g for a medium of length L is defined as
2
= cosh^(«:L).
9 =
A.{L)
A,{0)
(2.40)The gain for the idler wave is
a> =
L·!¿l
^ ~
/.(0) ■
n..A,(L)
A,(0) = — sinh^(A.’Zi^ (2.41)
These solutions show us the phase insensitive nature of the nondegenerate optical parametric amplifier. The field phases depend on the pump phase, but the intensity of the signal and the idler beams do not. Because of this independence, this amplifier is sometimes called a phase insensitive amplifier.
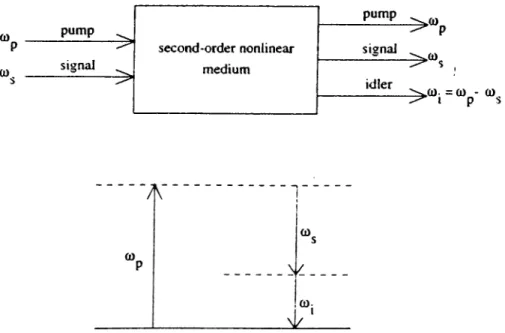
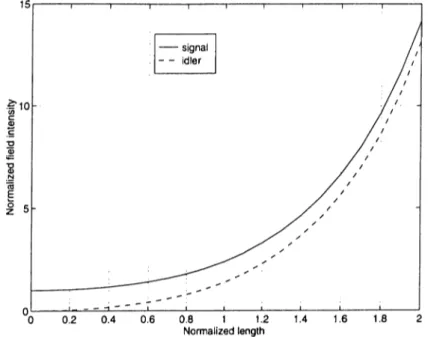
Figure 2 .2 shows the evolution of the signal and idler intensities for a non degenerate optical parametric amplifier. The signal and the idler are assumed to have the same frequency {ui = ujs) but still nondegenerate (due to polar izations). The signal intensity, (hence the parametric gain) is a rnonotonically increasing function of crystal length. Figure 2.3 shows how the parametric gain depends on the pump intensity. The parametric gain is a rnonotonically
Figure 2.2: Spatial evolution of signal and idler field intensities for a nonde generate optical parametric amplifier for the case of no phase mismatch in the constant pump approximation. The horizontal axis is normalized with respect to K~^ and the vertical axis is normalized with respect to the intensity of the signal at z = 0.
Figure 2.3: Dependence of parametric gain on the pump field intensity for constant length of interaction. The horizontal axis is normalized with respect to the value of the pump intensity satisfying kL = 1.
increasing function of the pump intensity. One can expect this since nonlinear effect is more efficient for higher pump intensities.
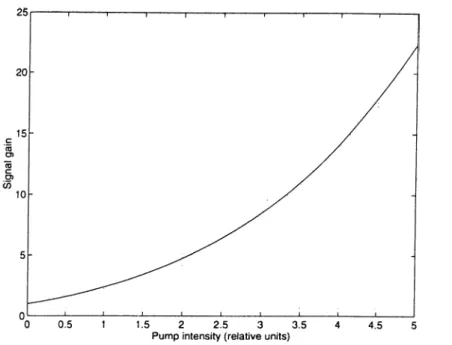
When the interaction is not phase matched, i.e. LS.k / 0, the signal gain is modified to [13] g = cosh^(/c^L) w'here
/2
2
K = K — (2.42) (2.43) for the range \AkL\ < 2, under the assumption of a strong pump beam. Figure 2.4 shows the signal gain as a function of the phase mismatch for K = 100 0 m "' and L = 1 mm. For nonzero A k a decrease in the signal gain is introduced which states that the nonlinear effect in question is less efficient. This fact is not only true for optical parametric amplification, but also for other types of nonlinear interactions (SFG, DFG, and SHG). For all types of nonlinear interactions A k = 0 has to be satisfied for efficient generation of the fields [1 1].The solutions up to now describe the evolution of the fields under the as sumption of an undepleted pump field. More general solutions, that take pump depletion into account, are in terms of Jacobi elliptic functions. Under the as sumption of undepleted pump field, these functions reduce to the solutions
Figure 2.4: The signal gain of a nonclegenerate optical parametric amplifier as a function of A k. The gain has a maximum where AA; = 0.
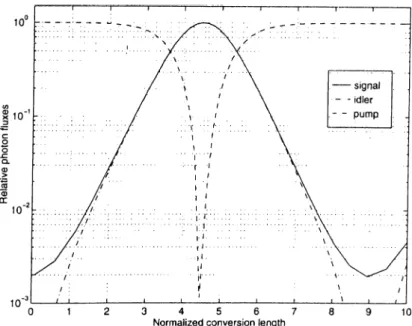
given here [1 2]. If we extend the length of the interaction or the pump inten sity, we can no longer assume that the pump is not depleted since for every photon created at the signal frequency, a photon at the pump frequency is an- hilated. .A.s a result, the field intensity of the pump decreases as the interaction goes on, and when all the pump photons are anhilated the field intensities of the signal and the idler reaches to a maximum. Figure 2.5 shows the exact solution of the coupled wave equations. The photon flux of the signal at the input is 1/500 of the photon flux of the pump and the photon flux of the idler at the input is zero. The relation between the photon flux and intensity is
and the normalization length is given by
(2.44)
K - ' =
2uj,u!i(PIp{0)' (2.45)
The figure shows that when the pump begins to get depleted, the gain for the signal and the idler begin to saturate. When the pump photon flux is zero, all of the pump is converted to signal and idler frequencies. After this point back conversion starts and signal and idler photons combine to produce pump photons.
Figure 2.5: Spatial evolution of signal and idler and pump photon fluxes for nondegenerate optical parametric amplified for the case of no phase mismatch. The horizontal axis is normalized with respect to k~^ and the vertical axis is
normalized with respect to the photon flux density of the pump at the input.
2.4 Degenerate Optical Parametric Amplifi
cation
In degenerate optical parametric amplification the signal and idler beams are indistinguishable, having the same freciuency, polarization, and propagation direction. Substituting cUp = 2cu and cuj = cu,· = u>, Equations (2.32) and (2.33) reduce to
(2.46)
dz TiojC
where
A k = k2u, — 2k^ (2.47)
under the assumption of a strong pump beam. For the phase matched case the solution to this equation is given by [13]
Au,{z) = /4(^(0) cosh(/«2) - ;e-’'^^“'A *(0)sinh(K2) (2.48) ,/
where A20J = and
9,.,2^2 A.
(2.49)
=
2uj^onln2u,(A
Since phase is relative, we can arbitrarily choose the phase of one of the fields. If we choose the phase of the signal to be zero, i.e. .4.^(0) is real, then the pump phase is also the phase difference between pump and the signal. The intensity of the signal can'be written as
1
|cosh(«:c) - sinh(A.-r)f (2..50) This amplifier is sometimes called a phase sensitive amplifier since the output field intensity of the signal depends on the phaise between the pump and the signal beams. .As a result, the parametric gain is also phase dependent and can be written as
9 =
A.,{L)
A.(0) = |cosh(/c/i) — sinh(«Z)l\ (2.0 1)The gain curve reaches to a ma.ximum and minimum at (¿-¿w = ^/2 and (h->^ =
—7
t/2,
respectively. For <i>2u — ±^/2 the gain is calculated to be5 =
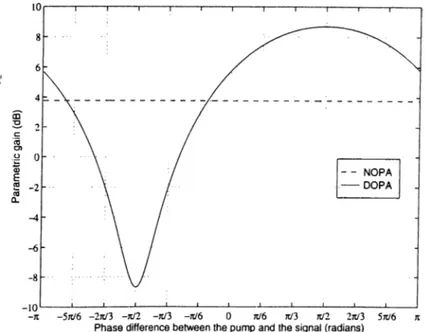
(->.52)Figure 2.6 shows the response of phase sensitive and insensitive optical parametric amplifiers for the same value of kL. The maximum gain that the
phase sensitive amplifier can reach is greater than that of the phase insensitive amplifier. The product of the maximum and minimum gain is always unity. Because of the pha.se sensitive nature of the amplifier the response is not always amplification. The gain curve always has a region below unity which means that the signal is deamplified at this point.
Equation 2.46 describes the evolution of the signal field in degenerate optical parametric amplification under the <issumption that the pump is much stronger than the signal, i.e. stays constant during the interaction. When the field intensities of the pump and the signal are comparable this equation is no longer valid. For the amplification case, photons at the pump frequency are anhilated to create photons at the signal frequency accounting for a decrease at the pump field. .As a result the gain begins to saturate just like it does in the case of the nondegenerate optical parametric amplifier. For the deamplification case, however, the photons at the signal frequency combine to create photons at the pump frequency accounting for an increase in the pump field. .As a result, the pump field increases and the deamplification is enhanced.
Figure 2.6: Parametric gain of nondegenerate optical parametric amplifier (NOPA) and degenerate optical parametric amplifier (DOPA) when /cL = I as a function of phase difference between the pump and the signal.
2.5 Second Harmonic Generation
Second harmonic generation is a special case of three wave mixing where the photons at frequency u are mixed with themselves to generate photons at frequency 2u. The differential equations for second harmonic generation are the same as the equations for degenerate optical parametric amplification except for the initial conditions. In second harmonic generation, the aim is to convert the field at u to the field at 2u>, i.e. we want to deplete the field at u and create a field at 2u. For this reason, we can no longer neglect the ^ variation of any of the beams, i.e. none of the fields are constant. Figure 2.7 shows the schematic and energy diagram for second harmonic generation.
The coupled equations for second harmonic generation are
= - j —
dz n^cdA2M
_
,
ri2ujCK{z)e-where (2.53) (2..54) (2.55) — k2uj
is the phase mismatch per unit length. Fntroducing the normalized length
^ = z jl (2.56)
Q) second-order nonlinear medium
- ^ 0 )
-^2&)
Figure 2.7: Schematic and energy diagram for second harmonic generation.
/ =
(2.07)and giving the initial condition A-iu = 0 at the input, the amplitudes of the solutions to these coupled equations for the phase matched case can be given as [1 1]
1.4,^(c)| = |.4,^(0)isech^ -42w(^)| = |/iu,(0)]tanh^.
(2.58) (2.59)
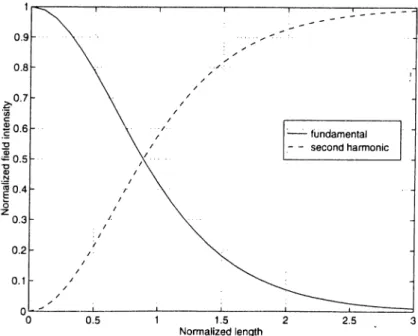
Figure 2.8 shows the spatial evolution of the fundamental and second- harmonic field intensities for the case of perfect phase matching and the bound ary condition of no second harmonic field at the input. We see that when sec ond harmonic field intensity at the input is zero, all of the incident radiation is converted to second harmonic in the limit ^ > oo. If the second harmonic field intensity at the input is not zero the evolution of intensities depends on the phase between the fundamental and second harmonic just like it does in the case of phase sensitive amplification [11]. This phase sensitive nature is expected since the coupled equations are the same for both.
Figure 2.8: Spatial evolution of the fundamental and second harmonic field intensities for the case of perfect phase matching and the boundary condition of no second harmonic field at the input. The intensity is normalized with respect to the intensity of the fundamental at the input.
2.6 Phase Matching
In Section 2.3, it is said that the nonlinear effect in question is less efficient for nonzero A k in all three wave interactions. To achieve AA; = 0 the equations
riiUi + Tl2iO-2 - n-iOJz Lü\ + Ul2 —
(2.60) (2.61) have to be satisfied simultaneously. For isotropic crystals this is impossible if the crystal has a refractive index that is a monotonie function of frequency within the band of interest. The most common way to achieve phase match ing is to use biréfringent crystals for which the refractive index is dependent on the polarization and the direction of propagation of optical field. Unlike isotropic crystals, we do not have a unique refractive index for an optical field with frequency cu. In order to achieve phase-matching, the highest frequency wave (jJ-i is polarized in the direction that gives it the lowest possible refrac tive index. There are two choices for the polarizations of the lower-frequency waves[14]. If the waves at frequencies u\ and u>2 have the same polarization which is orthogonal to the polarization of the wave at frequency cua, this is called type-I phase-matching. For type-II phase matching, the waves at fre quencies u>i and u)2 have orthogonal polarizations and one of them has the same polarization with the highest frequency wave U3. Figure 2.9 shows the
Figure 2.9: Directions of polarizations for oji, uj2, and ^.-3 for type-1 and type-II phase matching in three wave mixing (tui -|- u>2 = ^.'3).
directions of polarization of the waves in type-I and type-II phase matching. One can always choose a Cartesian coordinate system such that only the diagonal elements of the linear susceptibility tensor of the biréfringent crystal are nonzero. This coordinate system defines the principal axes of the crystal. The nonzero elements of this tensor correspond to refractive indices
ÏX = [1 + (2.62)
~ "h
Xÿyl
^ (2.63)= (1 + ,v ,.r'" (2.64)
indices. For the situation where
7*" ^ (2.65)
the crystal is said to be biaxial. By convention, j
:,
t/, z are the axes which satisfyrix < Uy < n,· (2.6 6) If two of the indices are the same, the crystal is said to be uniaxial. For uniaxial crystals, X, y , z are the axes which satisfy
^Tix = Uy (2.67)
where 2-axis is called the optic axis and rix and rij, are called the ordinary refractive indices. If then the crystal is called negative uniaxial whereas it is called positive uniaxial if > Ux.
Since phase matching in our experiments is achieved using uniaxial crystals, in this section we will only deal with uniaxial crystals. In uniaxial crystals.
z (optic axis)
Figure 2.10: 0 and d> angles defined due to spherical coordinates.
light polarized perpendicular to the plane containing the propagation vector k and the optic axis is said to have the ordinary polarization. Such light experiences ordinary refractive index. Light polarized in the plane containing k and the optic axis is said to have extraordinary polarization and experiences a refractive index ne{9) that depends on the angle 0 between the optic axis and k according to the relation
I
sin^ 6 cos^ 0::
I--- :r~·
nt
(2.68)n,{0)^
Figure 2.10 shows the 0 and o angles which are defined due to spherical coor dinates.
According to the definitions of type-I and type-II phase-matchings, the field at frequency o;3 must have lowest possible index. For negative unia.xial crystals this corresponds to extraordinary polarization and phase matching condition becomes
ne(u;3,0)a;3 = n^(u;i)a;i -f ni(u;2)u;2 (2.69) for type-I. Similarly for type-II phase matching the condition is
n^{ul^y0)ui-i = ne[uj\^0)u:\ -h (2.70) where wi and u?2 is interchangeable. For positive uniaxial crystals the field at frequency have ordinary polarization. Phase matching conditions for positive uniaxial crystals are
nx{u >3) = T l e i u ; i j 0 ) u J i + ne {o J2,0 )l^2
^1(^3) = + Tlg{u;2,^)<^2 20
(2.71) (2.72)
for type-I and type-II, respectively.
The dependence of n^, and on frequency are given by Sellmeier equations [14]. Using'Sellmeier equations, Equations (2.69), (2.70), (2.71), and (2.72) can be solved numerically to give us a 0 angle corresponding to o^i, a.’2. and a.’3. The angular orientation of the crystal should be adjusted precisely to this angle to achieve the phcise matching condition. This method is widely used and is called angle tuning.
C hapter 3
E X P E R IM E N T A L W O R K
All of the experiments b<ised on nonlinear effects in optical materials depend on the intensity of the opticcil beams. The interaction strength usually increases with optical intensity. In Chapter 1, it was noted that pulsed lasers are ideal for reaching the high intensities required by these experiments. Recent ex periments showed that optical parametric amplification can be achieved using Q-switched lasers whose pulse energies are in the order of 1 0 0m.J and pulse durations in the order of 100 ns [1 2]. This yields a peak power level of .3.\IW. That much of power focused to a spot size of 30 /¿m gives a peak intensity of 10*® VV/m^ which is high enough to achieve parametric conversion using typical nonlinear materials.
Our experiments that are described in this chapter are aimed at construct ing and evaluating OP.As that are pumped by an ultrafast laser. The duration of pulses that are used in our experiments are in the order of 100 fs. In Sec tions 3.1 and 3.2 the properties of the lгıser source and the nonlinear crystals that we used are outlined. Our optical parametric amplifier (OP.A) experi ments and results are described in Section 3.4 together with comparisons with computer simulations.
Figure 3.1 shows a simplified schematic of our optical parametric amplifier experiments. We use a mode-locked TitaniumrSaphire laser as our ultrafast source. The output of this laser at a wavelength of 830 nm (infrared) is first frequency doubled to 415 nm (blue). The second harmonic is used the pump of our optical parametric amplifier. The remaining portion of the field at the fundamental frequency is used eis the signal input to the amplifier after
Attenuator
Mode-locked Second 830 nm n , Optical 830 nm .
830 niTij Signal LJ 830 nm ^
Ti:Sapphire Harmonic Parametric
Laser Generation --- ! 415 nm Amplifier 415 nm j 1 Pump ·’ Amplified Signai -> Idler Residual Pump
Figure 3.1: Schematic of the optical parametric arnplificatioQ experiment.
being attenuated. For the degenerate OP.A case, there are amplified signal and residual pump beams at the output of the amplifier, whereas an idler beam is also present at the output for the nondegenerate case.
3.1
The Laser
A mode-locked Titanium:Sapphire (TirAL^Os) laser (Coherent model .Mira- 900F) is used in our experiments. The wavelength of the laser can be tuned in the 700-1000 nm rajige. The longitudinal modes of the laser are separated from each other by 76 MHz. Kerr-lens mode-locking is employed to achieve nearly transform limited pulses of approximately 12 0 fs at a repetition rate of 76 MHz.
There are two phenomena which aifect pulse shaping in the Ti:Saphire laser, namely group velocity dispersion (GV'D) and self phase modulation (SPM). Contributions to the total GVD of the laser cavity arise from all optical com ponents. These have positive GVD creating a frequency chirp on the pulse where the red frequency components travel faster than the blue. SPM is a re sult of intensity dependent refractive index, which is caused by the third-order nonlinearity in TirSaphire crystal. Nearly transform limited soliton-like pulses occur if these opposite chirp contributions cancel each other on each round trip in the laser cavity. In Mira-900F the amount of SPM is not enough to compensate positive GVD by itself, therefore a reduction of positive GV'D is necessary. Mira-900F has an intracavity prism pair designed to provide the necessary negative GVD. Introducing different amounts of negative GVD into the cavity, nearly transform limited, qucisi-soliton pulses in the 10 0 -2 0 0 fs range can be obtained.
Since high peak power is important in our experiments, we adjust the wavelength of the laser to 830 nm at which the laser output power reaches a maximum. At this wavelength the output of the laser is 800 mVV resulting in an instantaneous peak power of 75 KW. We measure the duration of our
laser pulses with an autocorrelator (Femtochrorne model FR103XL). At this wavelength we measured the autocorrelation of our pulses to be 210 fs. When deconvolved assuming a hyperbolic secant pulse shape, the pulse duration is deduced to be I40fs.
3.2 Beta-Barium Borate Crystal
Beta-Barium Borate [j3 — Ba2B0 4) is a 3m point group [14] negative uniaxial crystal whose transparency range is between 0.198 — 2.6 ;um. The Sellmeier equations describing the dispersion relations for n , and can be written as[14] 0.0184 n i = 2.7045 + n. = 2.3730 + A2 -0 .0 1 7 9 0.0128 A2 - 0.0156 - 0.0155A^ - 0.0044A^ (3.1) (3.2) Figure 3 .2 shows the principal indices for beta-barium borate (BBO ) crystal. Since BBO is a negative uniaxial crystal n. is always smaller than
The phase matching angle 0 for the BBO crystal can be found using Equa tions (2.69), (2.70), (3.1), and (3.2) for type-I and type-II phase matching for various wavelengths (See Section 2.6). Figure 3.3 and Figure 3.4 show the phase matching angles for second harmonic generation in type-I and type-II
Figure 3.2; Principal refractive indices for BBO crystal. 24
F'igure 3.3: Phase matching curve for second harmonic generation in a type-1 BBO crystal. The horizontal axis shows the wavelength of the fundamental beam in ;<m and the vertical axis shows the value of 9 in degrees.
BBO crystals, respectively, both as functions of the wavelength of the funda mental. Although these angles are calculated for second harmonic generation, they are also valid for our degenerate and nondegenerate optical parametric amplification experiments, since the idler and the signal field has twice the wavelength of the pump field. For these configurations, the horizontal axis is the wavelength of the signal.
Figure 3.4: Phase matching curve for second harmonic generation in a type-II BBO crystal. The horizontal axis shows the wavelength of the fundamental beam in /¿m and the vertical axis shows the value of 9 in degrees.
Figure 3.3 and Figure 3.4 show that the entire range of the Ti;Sapphire laser can be frequency doubled using both t\-pe-I and type-II BBO crystals. This also implies that all of the range of the Ti:Sapphire Iciser can be used as the signal input to BBO based optical parametric amplifiers if the frequency doubled output of the laser is used cis the pump beam.
The effective nonlinear coefficient of the BB O crystal at any 0 and o angle (See Figure 2.1 0) can be calculated using Equation (2.26). The effective non linear coefficient is dependent on the polarizations of the three waves and also on the direction of propagation. For 3m point group crystals, this coefficient is calculated to be [14]
d = d,3i sin 9 — ¿22 cos 9 sin 3o (3.3) for type-1 and
d = ¿22 cos^ 9 cos 3o (3.4)
for type-II phase matching. For the BBO crystal d^i and ¿22 are [14] I
¿31
=
= 0.12 X lO-^^'m/V
¿22 = ^Xyyy = 1.78 X lO-'^m/V.
(3.5) (3.6) The value of 9 is calculated from the phase matching condition whereas the value of p is chosen to ma.ximize the effective nonlinear coefficient. The op timum value of p is 90° for type-I phase matching whereas it is 0° or 60° for type-II phase matching, independent of the wavelength.
Three BBO crystals are used during the experiments. The wavelengths corresponding to these crystals are pointed with circles on Figure 3.3 and 3.4. First one is a type-I BBO crystal that is cut at ^ = 29° and <f> = 90°. Its dimensions are 7 x 7 x 0 .5 mm. It has A/4 anti-reflection (.AR) coatings at the input and the output. The ranges of .AR coatings at the input and the output are 700-900 nm and 350-450 nrn respectively. This crystal is used for second harmonic generation to pump the nondegenerate OPA, and for parametric amplification in the degenerate one.
The second crystal is a type-II BBO crystal that is cut at ^ = 40° and (f) = 0°. Its dimensions are 7 x 7 x 2 mm. It has AR coatings that are the same as the previous crystal described. This crystal is used for parametric amplification in the nondegenerate OPA.
The second crystal is a type-I BBO crystal that is cut at ^ = 51° and <f> = 90°. Its dimensions are 6 x 6 x 0.3 mm. This crystal is used for second harmonic
generation to pump degenerate OPA. Actually this is our autocorrelator’s BBO; on the phase matching curve its angle corresponds to a wavelength of 510 nm for the fundamental. By rotating the crystal about 20° we can achieve frequency doubling at 830 nm using this crystal.
3.3 Second Harmonic Generation
Second harmonic generation is an important part of our experiment since it is used to generate our pump beam. Figure 3.5 shows the experimental setup for second harmonic generation. The laser output is focused with the lens (L l) into the type-I BBO crystal. Focusing is necessary to increase the intensity of the fundamental beam at the BBO crystal for efficient conversion to second harmonic. Another lens (L2) is used to collimate the fundamental and the second harmonic. Ll and L2 are fused silica plano-convex lenses that are AR coated for 830nm and 415 nm, respectively. Our Iciser output is p-polarized (parallel to the plane of the optic table) therefore, due to the nature of type-I phase matching the second harmonic is s-polarized (perpendicular to the plane of the optic table). A dichroic beam splitter (DBS) is used to separate the fundamental and the second harmonic. We use a type-I BBO crystal at ^ = 90° and <i> — 29° whose thickness is 0 .5 mm. The effective nonlinear coefficient of the crystal at this angle is 1.61 pm/V. The Iciser output has a wavelength of 830 nm, resulting in a second harmonic beam generated at 415 nm.
To calculate the expected power of the generated second harmonic we have used the plane wave theory. The conversion efficiency to the second harmonic is defined as
_ h Á L ) V =
/ ^0) = tanh^ (3.7)
Figure 3.5: Experimental setup for second harmonic generation.
where ^ is given by the Equations (2.56) and (2.57). To calculate the con version efficiency correctly /.^(0) is taken as the instantaneous peak intensity of the fundamental beam at the input of the crystal. Since the laser output has Gaussian distribution in the transverse plane the intensity profile is not uniform. The most of the power of the laser output is confined into the beam radius and we can think the instantaneous peak intensity as
LiO ) = ^
ttVv * (3.8)
where Ppeak is the instantaneous peak power of the laser and \V is the beam radius [16] in the crystal. We assume that the intensity distribution is uniform within the beam radius and zero elsewhere ignoring the Gaussian beam profile.
In biréfringent crystals D and E vectors are not parallel to each other if the propagation is not along one of the principal axes. This results in an effect known «is walk-off [16] that causes the beams to walk away from each other as they propagate in the crystal. As a result, a limit to the length of the interaction is introduced. The interaction length determined by walk-off depends on the beam radius in the crystal and cannot be ignored if it is less than the crystal length. For the type-I BBO crystal used in this setup, the walk-off angle between the fundamental and the second harmonic is calculated as 3.8°.
To demonstrate the effect of walk-off in second harmonic generation, we experimented with lenses with different focal lengths. First w'e used lenses with 1 cm focal lengths for LI and L2. For this case, the beam diameter in the crystal is 14,5/xm (calculated), which results in an effective length of 0.22 mm. Figure 3.6 shows the average power of the second harmonic beam as a function of the average power of the fundamental beam at the input of the crystal when the focal length of both lenses are 1 cm.
When we increcise the focal length of Ll the beam radius inside the crys tal increases, accounting for an increase in the effective length determined by walk-off in the crystal. Although the effective length increases, the conversion efficiency is less for this configuration, since the conversion is strongly depen dent on the intensity of the fundamental beam. To observe this effect, we used lenses with focal lengths of 2.5 and 5cm for L l. Figure 3.7 and 3.8 shows the conversion to the second harmonic using these lenses. There is a considerable decrease in the conversion to the second harmonic. For both configurations, the effective interaction length is calculated to be more than the crystal length, therefore the interaction length is the length of the crystal.
Figure 3.6: Average power of the second harmonic as a function of the average power of the fundamental at the input of the crystal when the focal length of LI is 1 cm.
For the setup where the focal length of LI is 1 cm, the average power of the second harmonic is 300 mW for a 800 mW average power of the fundamental at the input of the crystal. This corresponds to a conversion efficiency of 38%. The pulsewidth of the fundamental is measured to be 140 fs whereas it is 70 fs for second harmonic.
Figure 3.7: Average power of the second harmonic as a function of the average power of the fundamental at the input of the crystal when the focal length of LI is 2 .5 cm.
Figure 3.8: Average power of the second harmonic as a function of the average power of the fundamental at the input of the crystal when the focal length of LI is 5 cm.
3.4 Optical Parametric Amplification
Although plane wave analysis together with the concept of effective length due to walk-off provides a sufficiently accurate model for second harmonic genera tion in our experiments, this is not powerful enough approach for investigating femtosecond optical parametric amplification. There are a number of compli cations that the model should handle, some of which are due to the ultrafast nature of the experiments, and others are due to the Gaussian transverse pro files of the beams. All of these effects have to be taken into account in a comprehensive model of our OPA experiments.
3.4.1
The Pump Beam
The second harmonic at 415 nm is used to pump our optical parametric am plifiers. The frequency doubling part of our experiment is described in detail in Section 3.3. We have chosen the focal lengths of LI and L2 as 1cm since the conversion efficiency is maximum with these lenses. Figure 3.9 shows the beam geometry using focused Gaussian beams and a type-I BBO crystal.
Ideally the fundamental and the second harmonic are both Gaussian beams, with the beam waist of the second harmonic being 1/v^ of the beam waist
TYPE I BBO
Figure 3.9: Generation of the pump beam using focused Gaussian beams and a typed BBO crystal. The dashed line shows the beam waist of the second harmonic which is 1 / ^ 2 of the beam waist of the fundamental. Both the fundamental and the second harmonic have the same confocal distance.
of the fundamental. Both the fundamental and the second harmonic beams have the same confocal distance. However, when lenses with relatively small focal lengths are used the resulting second harmonic does not have a circular transverse profile. This is due to the finite acceptance angle of the crystal [12]. This acceptance angle is narrower in one transverse direction than the other in BBO . -\s a result the transverse profile of the second harmonic is elliptical.
The lenses LI and L2 are manufactured from fused silica which is a relatively low dispersion glciss. However, fused silica still has some dispersion and hence the focal length of the lenses are wavelength dependent. As a result we cannot achieve perfect collimation for the fundamental and the second harmonic with L2 at the same time. This results in a slight phase front mismatch at the OPA.
3.4.2 Parametric Amplification Using Focused Gaus
sian Beams
The plane wave theory of parametric amplification outlined in Chapter 2 is an idealization since it is impossible to generate plane waves. Most lasers produce Gaussian beam outputs, therefore we have to work with Gaussian beams [1-5]. Gaussian beams are characterized by their confocal distance ro· For a Gaussian beam whose confocal length is zq and propagating along the :: direction, the intensity distribution is given by the equation [16]
I { x ,y ,z ) = 2P
TTW'^{zf)exp W ^ z) (3.9)
where P is the optical power and W {z) is the beam radius defined as W {z) = Wo 1 + -
V -0 (3.10)
Wc, is called the beam waist and is related to the confocal distance by the equation
Wo = \Zo 1/2
(3.11)
Our optical parametric amplifiers consists of two lenses, and a BBO crystal. The collimated beams of the pump and the signal are focused into the BBO crystal with the first lens and they are recollimated at the output. Both the pump and the signal beams have Gaussian distributions in the BBO crystal. ,\t the center of the pump beam, where the intensity reaches to its maximum value, we have maximum amplification, whereas the nonlinear interaction is less when we deviate from the center.
We can write the transverse intensity profiles of the pump and the signal beams at the input of the crystal as
nx^ + y^y
lp {x ,y ,0) = /poexp
/ ^ (j,y ,0) = /50 exp
2(x^ + i/^)l
(3.12)
(3.13) where Wp and Wj are the beam waists of the pump and the signal, respectively. If we assume that the phase fronts of the pump and the signal perfectly match and the length of the crystal is smaller than the confocal length of the Gaussian beams, (i.e. the beam radius of the pump and the signal stays constant in the length of interaction), the intensity profile of the signal at the output of the degenerate optical parametric amplifier can be written as [17]
I ,{ x ,y ,L ) = / ,(x ,y ,0)e.xp(±«:(x,(/)L) (3.14) for ± 7t/ 2 phase difference where L is the length of the crystal and
2i>j^(Plpix.y)
K (x,y) = (.3.1.5)
eonjnpC^
For the nondegenerate case the intensity profile of the signal at the output is I,{x , y ,L ) = /,(x,y,0)cosh^(A:(x, t/)Z) (3.16) which is independent of phase. To calculate the gain of our amplifier we have to look at the ratio of the input and output powers and calculate the gain of the amplifier using
9 = f I{x , y, L)dxdy f I{x , y ,0)dxdy' (3.17)
3.4.3 Effect of Group Velocity Mismatch
The diiferent group velocities experienced by the signal and pump pulses play an important role in the OPA. In the presence of dispersion, the group velocity of pulses propagating at Aq can be written as [16]
where
c
y (3.18)
dn
(3.19) where n(A) describes the wavelength dependence of the refractive index. The signal and pump pulses, being at different wavelengths, propagate with differ ent velocities in the crystal. This mismatch causes the pump and the signal pulses to drift away from each other while propagating in the crystal. This phe nomenon, which is known as the group velocity mismatch, is very important and limits the interaction length of the parametric amplification considerably if femtosecond pulses are used [18].
3.4.4 Detection of Ultrashort Pulses
The output signal of the degenerate optical parametric amplifier is detected using a high speed photodetector (Thorlabs 201/579-7227) with a risetime smaller than Ins when terminated with a 50 0 resistance. This detector is silicon p — i — n photodiode and its wavelength range is 300-1100 nm.
The 1 ns risetime of this photodiode is not fast enough to detect pulses at the order of 100 fs. Because of this, the pulse shapes that are seen on the oscilloscope are not the actual shapes of the Iciser output pulses, but the impulse responses of the photodetector. For this reason, the peak of the pulses that are seen on the oscilloscope are proportional to pulse energies, and not the peak pulse power. Therefore, the gain of the OPA that we measure using
this detector is ,
output pulse energy input pulse energy
On the other hand, for pulses with pulsewidths greater than 1 ns, the gain that we measure would be
output peak pulse power
9 = input peak pulse power (3.21)