KADİR HAS UNIVERSITY
GRADUATE SCHOOL OF SOCIAL SCIENCES BUSINESS ADMINISTRATION DISCIPLINE AREA
AN ANALYSIS OF THE VALUE CREATION AND VALUE
CAPTURE PROCESS OF A COMPANY OPERATING IN
THE SHARING ECONOMY: THE CASE OF UBER
AYHAM AL WANNI
SUPERVISOR: ASST. PROF. DR. NUR AYVAZ ÇAVDAROĞLU
MASTER’S THESIS
AN ANALYSIS OF THE VALUE CREATION AND VALUE
CAPTURE PROCESS OF A COMPANY OPERATING IN
THE SHARING ECONOMY: THE CASE OF UBER
AYHAM AL WANNI
SUPERVISOR: ASST. PROF. DR. NUR AYVAZ ÇAVDAROĞLU
MASTER’S THESIS
Submitted to the Graduate School of Social Sciences of Kadir Has University in partial fulfillment of the requirements for the degree of Master in the Discipline Area of Business Administration under the Program of Business Administration
I, AYHAM AL WANNI;
Hereby declare that this Master’s Thesis is my own original work and that due references have been appropriately provided on all supporting literature and resources.
AYHAM AL WANNI
__________________________ DATE AND SIGNATURE 8 / June / 2018
ACCEPTANCE AND APPROVAL
This work entitled AN ANALYSIS OF THE VALUE CREATION AND VALUE CAPTURE PROCESS OF A COMPANY OPERATING IN THE SHARING ECONOMY: THE CASE OF UBER prepared by AYHAM AL WANNI has been judged to be successful at the defense exam held on 08 / 06 / 2018 and accepted by our jury as MASTER’S THESIS.
i
TABLE OF CONTENTS
LIST OF TABLES ... iv LIST OF FIGURES ... vi ABSTRACT ... vii ÖZET ... viii 1. INTRODUCTION ... 11.1. Basic Terminology for the Sharing Economy ... 1
1.2. Network Effect ... 3
1.3. The issues that will determine the fate of the sharing economy ... 3
1.4. The rise of the sharing economy ... 4
1.5. Uber ... 5 1.6. Research Questions: ... 6 1.7. Research Objectives ... 6 2. LITERATURE REVIEW ... 7 3. RESEARCH METHODOLOGY ... 18 3.1. Introduction ... 18 3.2. Research Design ... 18
3.3. Target Population and Sampling Procedure ... 18
3.4. Reliability and Validity of the Research Instruments... 19
3.5. Data Collection Methods ... 19
3.6. Data analysis ... 21
4. DATA ANALYSIS, RESULTS AND DISCUSSION ... 22
4.1. Introduction ... 22
4.2. Response Rate ... 22
4.3. Demographic Information for Uber Riders ... 22
4.3.1. Gender of uber riders ... 22
4.3.2. Age of uber riders... 23
4.3.3. Marital status of uber riders ... 24
4.3.4. Education level ... 24
4.3.5. Income per month ... 25
ii
4.3.7. Frequency of using uber ... 27
4.4. Uber’s rider satisfaction ... 27
4.5. Correlations for Uber’s rider satisfaction ... 33
4.6. Hypothesis testing with two samples in the riders’ demographic conditions: . 38 4.6.1. Gender: ... 39
4.6.2. Age: ... 44
4.6.3. Marital status: ... 48
4.6.4. Education level: ... 53
4.6.5. Income per month: ... 58
4.6.6. Years using uber:... 63
4.6.7. Frequency of using uber: ... 69
4.7. Demographic information for uber drivers... 74
4.7.1. Gender of uber drivers ... 74
4.7.2. Age of uber drivers... 74
4.7.3. Marital status of uber drivers ... 75
4.7.4. Education level ... 76
4.7.5. Income per month ... 76
4.7.6. Owners and renters ... 77
4.7.7. Years driving for uber ... 77
4.7.8. Driving hours per week ... 78
4.8. Uber’s driver satisfaction ... 79
4.9. Correlations for Uber’s driver satisfaction ... 83
4.10. Comparison of the differences between drivers from two demographic groups: ... 87
4.10.1. Gender: ... 89
4.10.2. Age: ... 89
4.10.3. Marital status: ... 90
4.10.4. Education level: ... 92
4.10.5. Income per month: ... 94
4.10.6. Years driving for uber: ... 96
4.10.7. Frequency using uber: ... 98
4.10.8. Car owner or renter: ... 99
4.11. How does uber capture value ... 101
4.11.1. Uber pricing business model ... 101
4.11.2. Uber fares structure ... 102
iii
4.11.4. Surge pricing ... 104
4.11.5. Route-based pricing ... 104
4.12. Findings, Discussion, and Recommendations: ... 105
4.12.1. Uber riders ... 105
4.12.2. Uber drivers ... 108
5. CONCLUSIONS ... 110
References ... 112
iv
List of Tables
Table 3.1 Names of the Facebook groups that the surveys were distributed in ... 20
Table 4.1 Gender of Uber riders ... 22
Table 4.2 Age of Uber riders ... 23
Table 4.3 Marital Status of Uber riders ... 24
Table 4.4 Education Level of Uber riders ... 24
Table 4.5 Income Per Month ... 25
Table 4.6 Financial status of Uber riders ... 26
Table 4.7 Years riding with Uber... 26
Table 4.8 Frequency of Using Uber ... 27
Table 4.9 satisfaction level over services and features of Uber ... 28
Table 4.10 Riders’ agreement level ... 28
Table 4.11 Riders’ satisfaction level for normal taxi ... 29
Table 4.12 Safety actions ... 31
Table 4.13 Safety concerns ... 32
Table 4.14 Safety preference ... 32
Table 4.15 safety reasons to choose normal taxi... 33
Table 4.16 Rider satisfaction Correlations. ... 34
Table 4.17 Gender group statistics ... 39
Table 4.18 Gender t-test ... 41
Table 4.19 Age group statistics ... 44
Table 4.20 Age t-test ... 45
Table 4.21 Marital Status group statistics ... 49
Table 4.22 Marital Status t-test ... 50
Table 4.23 Education Level group statistics ... 53
Table 4.24 Education Level t-test ... 55
Table 4.25 Income Per Month group statistics ... 59
Table 4.26 Income Per Month t-test ... 60
Table 4.27 Years using Uber group statistics ... 64
Table 4.28 Years using Uber t-test ... 66
Table 4.29 Often Using Uber group statistics ... 69
Table 4.30 Often Using Uber group t-test ... 71
Table 4.31 Gender of Uber drivers ... 74
Table 4.32 Age of Uber drivers ... 74
Table 4.33 Marital Status of Uber drivers ... 75
Table 4.34 Education Level ... 76
Table 4.35 Income Per Month... 76
Table 4.36 Financial status ... 77
Table 4.37 Owners and Renters ... 77
Table 4.38 Years driving for Uber ... 77
Table 4.39 Driving hours per week ... 78
Table 4.40 Drivers’ satisfaction level ... 79
Table 4.41 Drivers’ agreement level ... 80
Table 4.42 driver satisfaction Correlations ... 84
Table 4.43 Tests of Normality ... 88
Table 4.44 Age report ... 89
Table 4.45 Age Test Statistics ... 90
v
Table 4.47 Marital Status Test Statistics ... 91
Table 4.48 Education Level report ... 93
Table 4.49 Education Level Test Statistics ... 93
Table 4.50 Income Per Month report ... 94
Table 4.51 Income Per Month Test Statistics ... 95
Table 4.52 Years driving for Uber report ... 96
Table 4.53 Years driving for Uber Test Statistics ... 97
Table 4.54 Frequency Using Uber report ... 98
Table 4.55 Frequency Using UberTest Statistics ... 99
Table 4.56 Car Owner or Renter report ... 100
Table 4.57 Car Owner or Renter ... 100
vi
List of Figures
Figure 1.1 ITU estimations for worldwide (International Telecommunication Union, 2015). ... 2 Figure 1.2 Number of sharing economy use (Statista, 2018). ... 2 Figure 2.1 Sharing economy and related forms of platform economy (Frenken et al., 2015) ... 7 Figure 2.2 screen to help determine company’s need to transform its value-creation strategy (Hughes, 2013). ... 10 Figure 4.1 Age of Uber riders ... 23 Figure 4.2 Age of Uber drivers ... 75
vii
ABSTRACT
ALWANNI, AYHAM. AN ANALYSIS OF THE VALUE CREATION AND VALUE CAPTURE PROCESS OF A COMPANY OPERATING IN THE SHARING ECONOMY: THE CASE OF UBER, MASTER’S THESIS, ISTANBUL, 2018.
This thesis examines customer satisfaction over services and features as a practical and functional expression of value creation for companies within the sharing economy and how those companies can capture that value. This thesis first discusses previous research and related articles in order to build an appropriate structure. The second part is a case study on Uber, a ride-hailing company. The area of the study is Istanbul, Turkey’s largest city. For the sake of this study, a survey was used to collect data on customer satisfaction over Uber’s services and features. The data was collected from both riders and drivers of Uber using a Likert scale questionnaire. Analysis of the data was performed using Statistical tools (SPSS) for data input and analysis. By this analysis, the satisfaction level over Uber’s services and features was measured. Finally, this thesis highlights the pricing strategies in which Uber and similar companies operating within the sharing economy can capture value in a global context.
Keywords: Sharing Economy, Value Creation, Customer Satisfaction, Value Capture, Pricing Strategies.
viii
ÖZET
AL WANNI, AYHAM. PAYLASIM EKONOMİSİ İÇERİSİNDE FAALİYET GÖSTEREN BİR FİRMANIN DEĞER YARATMA VE DEĞER YAKALAMA SURECİNE DAİR BİR ANALİZ: UBER VAKASI, YÜKSEK LİSANS TEZİ, ISTANBUL, 2018.
Bu tez, paylaşım ekonomisi kapsamında faaliyet gösteren şirketlerin değer yakalama pratiklerini anlamlandırmak adına sundukları hizmet ve özellikleri, müşteri memnuniyeti kapsamında incelemektedir. Tezde ilk olarak uygun bir temel inşa etmek adına ilgili literatür taraması yapılarak benzer çalışmalar incelenmiştir. Ardından bir taksicilik hizmeti olan Über üzerine bir vaka analizi geliştirilmiştir. Çalışmanın alanı Türkiye’nin en büyük şehri olan İstanbul’dur. Bu çalışmayı yapabilmek için Über’in hizmet ve özellikleri konusundaki müşteri memnuniyetini belirlemek adına veri toplamak için bir anket hazırlanmıştır. Bu anket, Likert-ölçeği tabanlı olup, hem Über kullanıcılarına hem de Über sürücülerine uygulanmıştır. Verilerin analizi SPSS programı kullanılarak gerçekleştirilmiştir. Bu analiz sonucunda İstanbul’daki kullanıcı ve sürücülerin Über’in sunduğu hizmetler ve özellikleri konusundaki memnuniyetleri ölçülmüştür. Bu çalışma sonuçlarının Über’in ve benzer paylaşım ekonomisi tabanlı şirketlerin küresel bağlamda değer yakalaması için uygulaması gereken stratejiler konusunda ışık tutması umulmaktadır.
Anahtar Kelimeler: Paylaşım Ekonomisi, Değer Yaratma, Müşteri Memnuniyeti, Değer Yakalama, Fiyatlandırma Stratejileri.
1
1.
CHAPTER 1
INTRODUCTION
In this chapter, we will briefly define the terminology and the background of this research, namely the sharing economy, the network effect, and the issues related to these concepts.
1.1. Basic Terminology for the Sharing Economy
Sharing economy or collaborative economy is defined as a peer-to-peer model of distributing underutilized resources via a fee-based agreement that relies on online participation through digital platforms (Frenken, et al., 2015).
The sharing economy encourages sharing over ownership in order to maximize the use of underutilized assets. Thus, it is associated with making the best use of the available resources. The term “sharing economy” is based on the idea that people can sometimes have an underutilized asset (e.g. car seat, extra room) and sometimes they can be in the temporal need for that asset. Companies like Uber, Airbnb, etc. create the appropriate platform for people to communicate in order to exchange rides and overnight stays. With all the ongoing developments in the technology, the digital platforms make it possible for individuals to do business with other individuals, and not having to go for the common business-to-consumer model. This model of not needing the middle hand is called “peer-to-peer” and it lets people do business with each other directly, for instance like taking a ride with some other individual instead of the traditional business-to-consumer, which is in this case calling a taxi office (Investopedia, n.d.).
Sharing economy allows people to rent others’ assets regardless of whether it is goods or services when the asset is expensive and there is no permanent need for it.
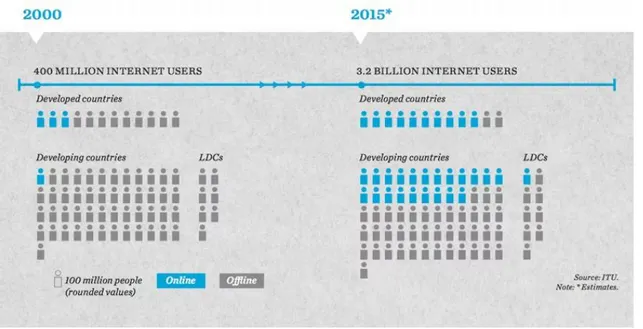
While it is true that people use the sharing concept from the early ages on, the digital platforms made it so much easier for customers to find the asset they need and for owners to make money from renting that underused asset. There are 3.2 billion Internet users in 2015 along with 7 billion mobile subscriptions worldwide comparing to 738 million in 2000 (International Telecommunication Union, 2015). The digital platforms have a 3.2
2
billion potential easy-to-reach users, 2 billion of whom live in the developed countries (Figure 1.1). From what is shown in (Figure 1.2), 44.8 million American adults engaged in a sharing economy activity in 2016 and the number is expected to double in 5 years (Statista, 2018).
Figure 0.1 ITU estimations for worldwide (International Telecommunication Union, 2015).
3
1.2. Network Effect
For every company, expanding its network is an important strategy to increase its potential customers, and this process would be through developing relationships with people and companies and building trust within the customer community. The network effect refers to the case where an increased number of participants improve the value of a good or service (Investopedia, n.d.). The mobile phone is a good example of this phenomenon. Initially, there were few users of the mobile phone, and it was of relatively little value to anyone to have a mobile phone. But the increased numbers of mobile phone owners led to direct increases in value for everyone.
The network effect is very important for the companies operating in the sharing economy as well. The value of the digital platform to its users increases as the total number of users increases (Business Dictionary, n.d.). Hence, looking for a ride with only a hundred drivers in a big city would leave you with very low chances of finding a driver who is working at the moment, willing to take you where you want, close to your location, and agreeing on the ride fee. But with more drivers in the city, you would easily find a driver who is close by and who is willing to take you where you want.
1.3. The issues that will determine the fate of the sharing economy
Although sharing economy is facilitated with the growing technology, there are still some issues that need to be resolved to make it grow. They are listed below.
1. Transaction costs: From the technical development comes the reduction in the transaction costs which have a deep impact on the success of the sharing economy and that impact can be illustrated in:
Searching effort and time costs Bargaining effort and time costs Agreement enforcing costs
It will be a lost deal to search for a ride on the street and go through the trouble of bargaining with the driver and then stay worried about the paying process and other
4
concerning issues, while you may open Uber app and find a ride in a few minutes with a given price for every minute and mile and guarantee for paying.
2. The requirement for a rating system: For strangers to work on digital platforms, they need a rating system that they can rely on. When people constantly rate each other on the basis of a customer/service provider, they make a system that can be used to decide whether to do business with someone or not.
Only 19% of Millennials believe that most people can be trusted, and just 31% of GenX’ers do. If the peer-to-peer model will continue to grow, knowing that peer-to peer model is more complicated than business-to-consumer model, it will require a rating system to increase the reliability. Companies did pay attention to this fact and they are coming up with innovation ideas such as the start of Airbnb adding identity verification to its platform in 2013. The act of sharing is not new to the world, but digital technology like location-based GPS is making the difference, digital technology allowed people to connect quickly and respond to each other’s requests of renting, hailing, etc. (Pew Research Center, 2014).
1.4. The rise of the sharing economy
Sharing is an old behavior of the human kind; through time people shared their resources to increase their chances of surviving. The concept ‘’ sharing economy ‘’ was born in the 2000s after a few businesses used the internet to share resources. Harvard law professor Yochai Benkler published a paper “Sharing Nicely: On Shareable Goods and the Emergence of Sharing as a Modality of Economic Production” suggesting that people share goods as part of the economy (Benkler, 2004).
In 2010, Rachel Botsman and Roo Rogers published a book which described the collaborative consumption (Rogers & Botsman, 2010). This book was the first to describe the concept of sharing economy.
In 2011, Time magazine considered collaborative consumption one of the “10 ideas that will change the world” (Time magazine , 2011). In 2015, Oxford Dictionary added the sharing economy to its online database (Steinmetz, 2015).
5
Hence, the concept of the sharing economy continues to grow and attract attention since 2010’s and seems to be one of the most influential trends in the coming years.
1.5. Uber
Uber is one of the most prominent companies operating according to the rules of the sharing economy. The first chapter of Uber story started when two friends, Travis Kalanick and Garrett Camp were having trouble finding a cap after attending a conference in Paris 2008. In the year before that Camp sold his share in StumbleUpon, a startup he co-founded to eBay for $75 million, and in the same year Kalanick also sold Red Swoosh a startup he co-founded to Akamai Technologies for $19 million. In 2009, Camp was working on UberCab as a side project, he tested the idea in New York with just three cars and then made the official launch in San Francesco in May. Uber received its first major fund from First Round Capital with the worth of 1.25 million dollars. In June 2016, Uber raised $3.5 billion from the investment arm of Saudi Arabia. Although Uber is not public yet and it is planning to be so in 2019, in April 2017, it reported to Bloomberg a loss of 3.8 billion dollars in 2016. All this loss is for the sake of the explosive growth Uber is experiencing but that growth does not ease off the opposition Uber is facing from the taxi industry and government regulators (Blystone, 2018).
Uber offers many kinds of services; UberX, Uber Black, Uber SUV and others. Uber requires its drivers to have their own insured car and pass a DMV and background check to start working as an Uber driver. Uber operates in 45 countries around the world and still, there are some places where Uber is not allowed. Uber presents itself more as a platform that connect people together and less as an employer. Through its catchy name, great app, excellent marketing, Uber is becoming more and more popular. Uber generally costs less; UberX on average cost 26% less than a normal taxi, the company charges a base fare and then adds a per-minute and per-mile charge different for every city. Uber puts the principles of supply and demand in its consideration and from this point Uber uses surge pricing. However, since this approach is criticized by many; Uber abandoned the surge pricing in case of natural emergencies like storms and blizzards, but they still employ it in situations like after a Halloween party (Pullen, 2014).
6
1.6. Research Questions:
In this environment, we defined our research questions as follows:
I. How Uber, a leader company in the sharing economy, would create value for its customers?
I. What is the customer satisfaction level over services and features provided by Uber, and which ones are more influential to their overall satisfaction with Uber?
II. Which services and features have the highest correlation with the overall customer satisfaction with Uber?
III. Are there any differences between demographic groups in terms of their satisfaction level over services and features provided by Uber?
IV. How can Uber capture the value it had created?
1.7. Research Objectives
The general objective of this study is to determine the effect of service quality of a company operating in the sharing economy on the customer satisfaction. The specific objectives are to:
II. Examine the customer satisfaction level over the services and features provided by Uber to its riders and its drivers
III. Investigate which services and features have the most influence on the customers’ overall satisfaction with Uber
IV. Investigate correlations among the satisfaction levels of the riders/drivers regarding Uber’s features and the customers' overall satisfaction with Uber V. Investigate differences between demographic groups in terms of their
satisfaction level over services and features provided by Uber
VI. Highlight the pricing strategies in which Uber capture its value in a global context.
VII. Come up with suggestions for value capturing strategies of the firms who operate in the sharing economy.
7
2.
CHAPTER 2
LITERATURE REVIEW
In this chapter, relevant literature is reviewed. This section introduces significant studies and applicable research that support this study, which aim to put the light on substantive findings in the field of sharing economy, Uber, value creation, value capture, customer satisfaction and examining researches of measuring customer satisfaction through surveys. Frenken et al. (2015) defined the sharing economy as: “consumers granting each other temporary access to under-utilized physical assets, possibly for money”. Based on this definition, the sharing economy can be distinguished by the three defining characteristics: consumer-to-consumer interaction, temporary access and physical goods.
People selling or granting goods to each other is called the second-hand economy. Renting goods directly from a company rather than from another individual is called the product-service economy. Doing a peer-to-peer product-service rather than peer-to-peer good sharing is called on-demand economy. (Figure 2.1)
Sharing economy brought along some sustainability impacts. Consumers would get cheap access to goods by renting from others and based on that the total number of new goods
Figure 0.1 Sharing economy and related forms of platform economy (Frenken et al., 2015)
8
produced was hypothesized to decline. Social benefits would count as strangers are meeting face-to-face and making meaningful contacts. Due to lower transaction costs, the economic effects of the sharing economy are beneficial to both parties and would cause a rise in the income or consumer welfare. The danger of dealing with strangers can be an example of the negative externalities of the sharing economy as well as the tendency toward monopoly from the provider side which will allow high margins to be cut (Frenken & Schor, 2017).
Traditional companies have a new kind of competitors in the market to worry about. Internet startups in the sharing economy can grow exponentially through the power of digital platform dynamics and network effects but there is nothing to stop traditional companies from becoming more like their sharing-economy counterparts. They just have to compete relying on their own unique advantages, otherwise they will suffer to stand still while their sharing-economy counterparts are growing more and more (Cusumano, 2014).
Although sharing economy is a new concept, it has major effects on the economy’s other sectors. For instance, sharing economy caused the demand to increase, people are watching the availability and the popularity of Uber, and then they are interested in becoming Uber-divers. The growing of the sharing economy with its two most famous examples Uber & Airbnb raises the voices calling for more public safety. The sharing economy platforms encourage the act of rating in order for every user to keep a good reputation (Duverge, 2016).
Companies working within the sharing economy business model are affecting traditional industries all over the world. Hotels and taxi companies are obvious examples of that case. Sharing economy companies brought significant economic, environmental, and entrepreneurial benefits such as the increase in employment and a reduction in carbon dioxide emissions. Nevertheless, regulators are still new to knowing this business model and they will probably regulate the sharing economy firms as if they are traditional ones which will lead to higher taxes and requirements. To avoid that, sharing economy companies should stand responsible to the regulators’ legitimate concerns and ease the work of regulators by trying to approach them through forming industry associations instead of acting independently, making their data public and sharing it with the government. Cannon and Summers (2014) argue that this kind of precautions will reduce
9
the concerns of the regulators. Moreover, making research on how the company is adding value to the country will lead to a positive effect regarding how the regulators will deal with the company. Finally, making the first move of going to the government and proposing the best set of regulations based on their experience in other countries could be a good idea for companies like Uber, instead of waiting and hoping that the government will do nothing (Cannon & Summers, 2014).
Coming to the concept of value creation, we first state its definition. Value creation is defined as “the performance of actions that increase the worth of goods, services or even a business” (Business Dictionary, n.d.). Many business operators now focus on value creation both in the context of creating better value for the customers purchasing their products and services and for the shareholders in the business who want to see their stake appreciate in value (Business Dictionary, n.d.). Value creation relates to the perceived value that the firm can bring to consumers (or other beneficiaries) (Rachel , et al., 2018). Boston Consulting Group (BCG) published an article asking the question, “Is value-creation strategy transformation necessary?”, and to answer that question BCG suggested comparing the company with its appropriate peers in the market within two scales. The first one is comparing the company’s recent Total Shareholder Return “TSR” to its peers to see how the company was doing in the last few years, and the second one is to look into how investors think of the company’s future. When a company fails to keep up with its peers in the two scales, then it needs the transformation. BOG suggested six steps toward TSR transformation as defining the company goals, using value-based performance metrics, choosing a clear portfolio strategy with an active portfolio management, aligning the company’s financial strategy with its long-term objectives, looking for the company’s type of investors and finally refocusing management processes as the company’s value-creation strategy success is dependent on the value-management capability (Farag, et al., 2015).
10
Tasks like data entry, purchasing, billing, payroll and many others are becoming more customized and automated. Creating value for a product or service is depending increasingly on creativity. In the past, value creation was a role of the economies of industrial scale while in the future it will be a role of economies of creativity. Productivity means taking cost out, which is important, but this is a time where we have to work creatively in which we should learn how to put value in. As supply chain management is about making a process efficient, value chain management is about putting together innovations of creative ideas to make the work process more efficient. It is simply about how to create value (Hughes, 2013).
Willing consumers are the ones that validate the value of products and services. The "consumer benefit experience" (CBE) approach (or consumer perspective) can be counted as a substantial approach of addressing strategic management for the following reasons.
As consumers are the ones experimenting the benefits offered by the company, offering benefits that consumers are willing to pay for are essential for capturing value later on.
The transaction-cost-economics mostly disregards the mechanisms related to demand, since this perspective views the transactions as a zero-sum game in which
Figure 0.2 screen to help determine company’s need to transform its value-creation strategy (Hughes, 2013).
11
the value is distributed across different aspects in a value system. Hence, the traditional perspective views any increase in the customer payments caused by one aspect of the value system would be at the expense of some other aspect.
In modern management, one should not be restricted to the results and hypothesizes of a single discipline. For example, one should benefit from other fields like marketing for the sake of integrative discipline of strategic management, so at the end, a much effective strategy of value creation from the consumer perspective can be attained.
Value capture is what the firm seizes from the consumers’ payments in exchange of future value from consumption. However, value creation contains the innovation that creates the consumer’s valuation of the benefits of consumption. Typically, strategic management view value from the supply side as if only the producers create it, which is known in the term “value added”. Thus, it is clear that a company with a low-cost superior resource that produces on-going revenue streams have a competitive advantage over others.
The most important thing for a firm is to maximize the use-value experienced by the customer during his various customer activities which will reflect on his future consumption and his willingness to pay. Although firms control most of the transactions, they are still intermediaries to the end users and in that perspective, they will ultimately contribute to produce value during consumption. Under this CBE approach, value aided will replace value added, firms will try to increase the value in aiding and thus end users will increase their payments (Priem, 2007).
In 2007, the year that iPhone entered the phones market, those five manufacturers—Nokia, Samsung, Motorola, Sony Ericsson, and LG—were the Beneficiaries of 90% of the phones industry’s global profits. In 2015, iPhone dominated its industry and controlled 92% of the industry’s global profits. Apple took the full advantage of the power of platforms, which businesses gather consumers and producers in order to exchange high-value, information and interactions. These platforms are Apple’s most important assets, the backbone of their value creation process and their competitive advantage. Apple placed a platform in the hands of participants in two-sided markets where app developers and app users created value for each other, and when the participants of both sides increased. Moreover, the value increased as well, due to the platforms’ most critical feature “network effects”.
12
Hence, all this resulted a 1.4 million apps in App Store (by January 2015), in which they generated $25 billion for developers.
Ride sharing constitutes another example for value creation. By facilitating a desirable interaction, Uber is creating value for both rider and driver. As the number of those participants increases due to the “network effects”, it will be easier for both sides to find each other, which means bigger value. Within Uber, the “Spillovers effects” makes another positive mark in helping platforms to grow faster. This is when riders and drivers rate each other, a progress would be done to the platform and that will return as more value to the users and more interactions within the platform.
As Apple did, all firms are trying to add platforms to their business model because virtually when platforms start operating in the same marketplace, the platforms always win. Van Alstyne et al. (2016) argue that to move a business from a conventional model to a platform-based one, the following steps should be followed:
From resource control to resource orchestration.
Firms working with a conventional business model gain advantage by controlling the scarce resources (such as real estate) which would be their assets; but in a platform-based model, the main asset becomes the participants and what those participants create by their interaction. Hence, the firms must learn how to manage this new type of assets if they want to shift from a traditional model to a platform-based one.
From internal optimization to external interaction.
To create value for customers, conventional firms go through every stage of product creation from collecting materials and labor to the sales stage. However, all what Platforms do is make sure that consumers and external producers are interacting and creating value for each other. Hence, the firms must create interactions between producers and consumers if they want to shift from a traditional model to a platform-based one.
From a focus on customer value to a focus on ecosystem value.
Conventional firms seek for a lifetime valuation over its products while Platforms seek to make the most value out of a growing ecosystem which would cause an iterative process. Hence, the firms must focus on growing their ecosystem if they
13
want to shift from a traditional model to a platform-based one ( Van Alstyne, et al., 2016).
Industrial Age companies are making strategic moves to enter the sharing economy space and join companies like Uber, Amazon and Expedia. These companies come from different business models but have one thing in common: they can sense the huge value creation potential within the sharing economy. Gray (2016) calls this principle “UBER-nomics”, which namely refers to the economics of abundance as it allows companies to defy traditional economic principles of scarcity. Hence, UBER-nomics breaks down the traditional scarcity principle in terms of:
Supply —in which it has access of long tail of utilized assets, goods and expertise. Demand —as it can attract non-customers and access new markets.
UBER-nomics of value creation enhances companies to create, extract and capture value by coming up with innovative ways within their ecosystem to make the maximum benefit of the under-utilized assets. UBER-nomics will empower the stakeholders and turn the lack to plenty (Gray, 2016).
To our knowledge, there exist a limited number of papers that study value creation process in the sharing economy, so, this area has not been explored in much detail yet.
Next, the studies on value capture must be mentioned. The term “value capturing” refers to the monetary value extracted from what firms offer to customers (Rachel , et al., 2018). Although innovation in value creation and value capture are both important, companies make the mistake of focusing on the first one which can lead a business to fail. For instance, Facebook with 1.3 billion active monthly users has an unquestionable ability to create value but the company does not seem to be capturing value as it is supposed to (Michel, 2014). Companies should start thinking more creatively about value capturing in ways such as the following:
Hit the blind spot. It seems like innovators and managers think of the work as done as they create the value discarding capturing it. They assume that the rewards will follow the created value automatically. Hence, the simple thing to be done is
14
making innovators and managers conscious of situation and open their eyes to all the possible approaches of value-capture.
Ditch the old production costs or calibrate against competitors’ pricing strategies for the value-based and demand-driven pricing strategies.
Seek the people who would pay for the value you are providing. For instance, advertisers may pay for a film making that cinema houses may not.
Change the price carrier. McDonald creates value with children’s Play Place and WIFI connection services but the price tag is on the food. Telecommunication companies provide several kinds of services that each user value differently but yet the price tag is for the package and not for each service separately.
Timing innovation. Futures contracting and installed base pricing (which is known for razor-and-blades model) are good examples of timing innovation.
Segment your customer base and charge each segment for the price they are really willing to pay.
Managers should focus on value capture. A special team who is integrated with every department in the company should be assigned to challenge the status quo and innovate strategies for the company to capture value more efficiently (Michel, 2014).
While value creation and value capture are both important, each should be dealt in different ways. Value creation contains many aspects like the customers, the supply chain and many other that jointly contribute to the economic value created by the company. Those aspects make the “value network”, in which the managers should start by evaluating the contribution of each aspect to the economic value (Ryall, 2013).
In this environment, the value capture cannot be possible without customer satisfaction. Several studies in the literature focused on customer satisfaction to measure the value creation and value capture from the customer perspective. For instance, the work of Manuela et al. (2013) emphasizes the connection between value capture and the customer satisfaction. In order to analyze and measure the outcomes of value co-creation behavior from the perspective of the customers, the authors interviewed the customers of a beauty firm. To this end, 547 adult regular users of beauty firms were personally interviewed and their completed questionnaires were analyzed with SPSS 20 and AMOS 20 statistical data
15
analyzing programs. The findings proposed a positive relation between value co-creation and customer satisfaction. Therefore, this study encourages personal care service firms to enhance the active participation of its customers in the value creation process to improve customer satisfaction. This can be possible by creating communication channels that enhance the customer involvement. However, it should not reach a situation where customers will blame themselves for trouble in the service providing process (Vega-Vazquez, et al., 2013).
Among the other research papers in the literature that use the method of surveys and questionnaires towards measuring the value capture, the work of Imam (2014) can be counted, in which the author identified, described, and measured satisfaction of public transportation system users. For that purpose, the author conducted a survey among public transport users in Amman/Jordan, which was comprised of two parts. The first part contains general questions about gender, age, occupation, and the most regularly transit mode used. The second part contained a list of 18 travel attributes like (Waiting Time, Cost of Travel, Ease of Payment, Personal Security) each was to be rated regarding the travel attribute importance and satisfaction level. At the end of the research, the results had clear implications that would help the public transportation system in Jordan and were recommended to be beneficial to other countries who have similar cultural and economic characteristics (Imam, 2014).
In another research, a survey was designed to review public attitudes and quality metrics toward taxi services in Houston (Cooper, 2014), the results were collected through on-line survey and intercept survey. The responses from the on-line survey reported high income, nightclubs as a primary trip origin, less frequent use of taxi services compared to the intercept survey respondents and were biased toward single culture, while the responses from the intercept survey reported a mixed set of income groups, mixed trip origins with 40% residential, more frequent users of taxis and a wide users demographics. Regarding the waiting times, satisfaction level was high among intercept respondents unlike on-line respondents who were more critical regarding the reasonable waiting time expectations. In the end, the survey shows that on-line respondents do not use taxis mostly because they prefer their own private car, they are afraid that the taxi will not show up and because of the high prices, while the intercept respondents don’t use taxis mostly because they don’t
16
need to, because of safety issues, the high prices and that the taxis not showing up (Cooper, 2014).
Finally, Roulston (2014) reports about Leger, the research intelligence group, conducting a telephone survey for the city of Calgary/Canada which included 500 adults in the city and was intended to measure the satisfaction with taxi services. The telephone survey core objectives included:
Identifying the usage and frequency of taxi service among the city residents Identifying the ways people obtain a taxi service
Taxi Pick-Up and Drop-Off locations Evaluate satisfaction toward the driver
Evaluate the passengers’ experiences during the ride Evaluate payment options
Measure overall satisfaction
A summary of the results can be summarized in the following few points:
Taxi Usage: During the last year, 60% of the city population had used taxi services, 5% had used Car-sharing program. People don’t use the taxi services mainly because they have their own cars (64%), they don’t have the need to (30%), they share car with someone else (9%) and because they use the public transportation (5%).
Obtaining Taxi Services: among taxi users, calling Taxi dispatchers and pre-booking (62%) with a satisfaction of (88%), while (57%) calling for immediate service with a satisfaction of just (70%), (20%) have used a hotel taxi office and those are the most satisfied (97%), 12% used online taxi services with (82%) satisfaction, (13%) have called the driver directly and they are (92%) satisfied, (32%) have hailed a taxi and (76%) of them are satisfied.
Drivers: the majority of taxi users (93%) are satisfied with the taxi drivers.
Experiences during the Ride: there is a huge satisfaction regarding taxi users experience during their rides.
Overall satisfaction: They had a (100%) satisfaction with the limousine customers, (86%) satisfaction with taxi users, the main causes affecting the overall satisfaction
17
are: satisfaction with the drivers, reaching the dispatchers shortly, the politeness of the dispatchers, satisfaction with experiences during the ride and the value for money (Leger - The Research Intelligence Group, 2014).
Hence, using the survey method to measure customer satisfaction and its relationship with value creation and capturing process is mainly common in the literature. Since Uber does not share its data with the researchers, we will use the same method, i.e. data collection through surveys, in our research procedure. Moreover, to our knowledge, there does not exist papers that study value capture process in the sharing economy, so, our work will be among the first research that focuses on this particular area.
18
3.
CHAPTER 3
RESEARCH METHODOLOGY
3.1. Introduction
This chapter gives the methodology that was used to reach our research objectives. This section entails the introduction, research design, target population and sampling procedure, data collection methods used, reliability and validity of the research instruments and data analysis.
3.2. Research Design
For the sake of measuring the satisfaction with the features and services provided by Uber, this study employs a descriptive survey research design. Descriptive survey research designs are used in introductory and exploratory studies to collect information about peoples’ perspective, tendency and habits and allow researchers to collect information using questionnaires and summarize, present and interpret the collected data for the purpose of clarification and produce statistical information that interests decision makers and educators (Orodho, 2003). This research is exploratory in the sense that there has been no past research about value creation and value capturing process in a company like Uber. This research paper will provide a comparative review of the dependent variable vs the independent variables chosen for the study.
3.3. Target Population and Sampling Procedure
The target population for this study are riders of Uber, and the drivers of Uber, both in the city of Istanbul/Turkey. The aim is to collect information from two sources that are, from Uber riders on rider’s satisfaction over Uber’s features and services and from Uber drivers on driver’s satisfaction over Uber’s features and services.
Volunteer Sampling method was used, which is one of the non-probability sampling methods in which the voluntary sample contain people who self-selected their selves to
19
participate in the survey. Those people normally have a huge interest in the subject of the survey. (more explanation is provided in p.19)
Reaching the participants were through a questionnaire using an online survey for two reasons:
Uber users have to be internet-active people.
It is hard to determine the users of Uber from the public or to determine the drivers of Uber from all car drivers out on the roads of Istanbul.
3.4. Reliability and Validity of the Research Instruments
Two important factors of measuring the quality of an instrument are the reliability and validity of the measures. The aim of those two is to reduce the error in the measurement process. Reliability evaluate the stability of the measurement instruments and it does evaluate whether the research instrument provide an accurate and consistent measure of the results. While validity is the warranty of the results of a test, validity reflect the accuracy of the research instrument used and results obtained from it in terms of representing the variables of the study (Kimberlin & Winterstein, 2008).
In this research the reliability of the questionnaire was assured by asking the question two times, mostly in different context and with different wording. The survey responses which do not show consistency in this manner were eliminated from the analysis so the results would be stable, accurate and will not be affected in case of redo the test. The research instrument was assured to be validated in terms of building the questions based on previous surveys, Uber website claims, articles by expert opinions on credible newspapers and websites and the literature review (Imam, 2014) (Cooper, 2014).
3.5. Data Collection Methods
The data collection tools for this study were two questionnaires, one is designed to measure the riders’ satisfaction over Uber’s features and services and the second is designed to measure the drivers’ satisfaction over Uber’s features and services. Questionnaires were used to collect primary quantitative data. The reason for using questionnaires over
20
interviewing method was mainly due to two reasons: First, questionnaires will give the respondents enough time to complete the questions asked and second, they will be anonymous to encourage honest responses. Both questionnaires were designed and created on “monkeysurvey” website, distributed through social media networks and into 7 Facebook’ groups (Table 3.1), in which 5 are about Uber riders and 2 are about Uber drivers both in Istanbul. There for the results represented all types of Uber users in the city. Table 0.1 names of the Facebook groups that the surveys were distributed in
Uber rider’s survey:
The survey contained three parts: The first part contains general questions about gender, age, marital status, education level, monthly income, since when the participant has been using Uber and how often, and normal safety precautions. The second part asks the participant to indicate his level of agreement using a Likert Scale on five levels from 1 “Strongly disagree” to 5 “Strongly agree” regarding Uber features and services like Uber’s social experience, fee cut, app, navigation system, time estimation accuracy and help, customer service representatives and his relationship with Uber in general. The third part askes the participant to indicates his satisfaction level on a scale from 1 to 5 (1 being the least satisfied and 5 being the most satisfied you can be), regarding the previously mentioned features and services within a normal taxi and then again with Uber and lastly a comment box is provided for any additional information. A sample questionnaire is provided in Appendix A.
Uber driver’s survey: The Facebook group name
It’s link
UBER İSTANBUL https://www.facebook.com/groups/182469072499327/ UBER İSTANBUL https://www.facebook.com/groups/140269286660673/ Uber İstanbul https://www.facebook.com/groups/152436098820639/ Uber istanbul https://www.facebook.com/groups/411790015908016/ Uber Türkiye https://www.facebook.com/groups/204283853395427/ UBER SÜRÜCÜLERİ https://www.facebook.com/groups/708435922696055/ UBER SÜRÜCÜLERİ
DESTEK
21
This survey similarly contained three parts: The first part contains general questions about gender, age, marital status, education level, monthly income, since when the participant is working for Uber, working hours weekly and weather driving his own car or not. The second part asks the participant to indicate his level of agreement using a Likert Scale on five levels from 1 “Strongly disagree” to 5 “Strongly agree” regarding Uber features and services like Uber’s financial benefit, working days and hours, social experience, app, navigation system, complementary features, time estimation accuracy and help, customer service representatives and his relationship with Uber in general. The third and the final part askes the participant to indicate his satisfaction level on a scale from 1 to 5 (1 being the least satisfied and 5 being the most satisfied you can be), regarding the previously mentioned features and services. A sample questionnaire is provided in Appendix B.
3.6. Data analysis
Analysis of the data was done using Statistical tools (SPSS, version 25) for data input and analysis, which included descriptive statistics, means, standard deviations, frequencies, percentages, Pearson’s Coefficient Correlation, independent-samples t-test and Mann-Whitney test. The data analysis was done in three steps, the first one is to measure the customer satisfaction with each service and feature provided by Uber and the overall customer satisfaction level based on the general relationship with Uber. The second step is to run a correlation analysis to measure linear correlation among the users’ satisfaction levels with Uber’s features and their overall satisfaction with Uber, the third one is to compare the mean satisfaction level of participants from different demographics groups.
22
4.
CHAPTER 4
DATA ANALYSIS, RESULTS AND DISCUSSION
4.1. Introduction
The findings and discussions in this chapter are based on the statistical analyses of the questionnaire results. The first section covers the basic and demographic information analyzed from the participants' characteristics through quantitative descriptive statistics. The second section presents the findings of analyzing the participant responses to find out the Uber’s customer satisfaction toward the value created by Uber. This chapter will contain the results of the survey’s second and third sections and its subsequent discussions. The third part will provide a general clarification of how Uber captures the value it had created in a global context.
4.2. Response Rate
For the purpose of this research, 145 Uber customers and 38 Uber drivers represented the survey’s respondents. The surveys were distributed online across the social media and into Facebook groups for Uber’s Istanbul users.
4.3. Demographic Information for Uber Riders
4.3.1. Gender of Uber riders
Table 0.1 Gender of Uber riders
Frequency Percent Valid Percent
Cumulative Percent
Valid Female 49 33.8 33.8 33.8
Male 96 66.2 66.2 100.0
23
From the response in table 4.1, 33.8% of Uber riders are women and 66.2% are men.
4.3.2. Age of Uber riders
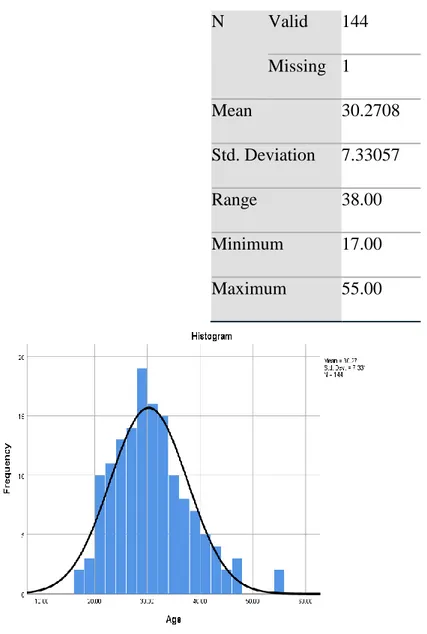
Table 0.2 Age of Uber riders
N Valid 144 Missing 1 Mean 30.2708 Std. Deviation 7.33057 Range 38.00 Minimum 17.00 Maximum 55.00
Figure 0.1 Age of Uber riders
From the response in table 4.2, the mean age of Uber riders is 30.27 years (7.331 Std. Deviation), a range of 38 years between 17 to 55,figure 4.1 show the riders’ age distribution.
24
4.3.3. Marital Status of Uber riders
Table 0.3 Marital Status of Uber riders
Frequency Percent Valid Percent
Cumulative Percent Valid Single 71 49.0 49.3 49.3 Married without children 28 19.3 19.4 68.8
Married with children 45 31.0 31.3 100.0
Total 144 99.3 100.0
Missing System 1 .7
Total 145 100.0
From the response in table 4.3, 49 of Uber riders are single, 19.3% of Uber riders are Married without children, 31% of Uber riders are Married with children.
4.3.4. Education Level
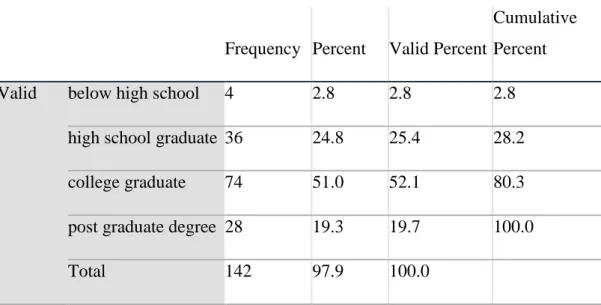
Table 0.4 Education Level of Uber riders
Frequency Percent Valid Percent
Cumulative Percent
Valid below high school 4 2.8 2.8 2.8
high school graduate 36 24.8 25.4 28.2
college graduate 74 51.0 52.1 80.3
post graduate degree 28 19.3 19.7 100.0
25
Missing System 3 2.1
Total 145 100.0
From the response in table 4.4, 2.8% of the Uber riders’ education level is below high school, 24.8% high school graduate, 51% college graduate, 19.3% have post graduate degree.
4.3.5. Income Per Month
Table 0.5 Income Per Month
Frequency Percent Valid Percent
Cumulative Percent Valid Less than 2000 tl 23 15.9 16.0 16.0
2000-5000 tl 70 48.3 48.6 64.6 5000-10000 tl 38 26.2 26.4 91.0 More than 10000 tl 13 9.0 9.0 100.0 Total 144 99.3 100.0 Missing System 1 .7 Total 145 100.0
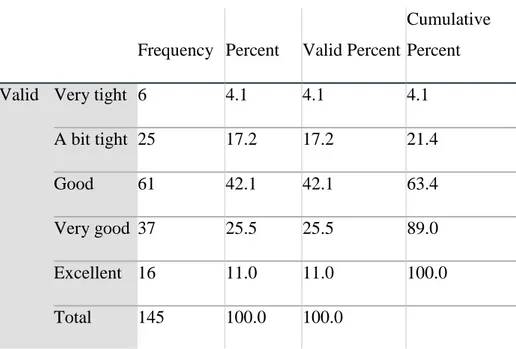
From the response in table 4.5, 15.9% of the Uber riders’ monthly income is less than 2000 tl, 48.3% monthly income is between 2000-5000 tl, 26.2% monthly income is between 5000-10000 tl and 9.0% make more than 10000tl monthly. As the response in table 4.6 shows, 4.1% have a very tight financial status, 17.2% tight financial status, 42.1% neither good nor bad financial status, 25.5% good financial status, 11.0% very good financial status.
26
Table 0.6 Financial status of Uber riders
Frequency Percent Valid Percent
Cumulative Percent
Valid Very tight 6 4.1 4.1 4.1
A bit tight 25 17.2 17.2 21.4
Good 61 42.1 42.1 63.4
Very good 37 25.5 25.5 89.0
Excellent 16 11.0 11.0 100.0
Total 145 100.0 100.0
4.3.6. Years riding with Uber
Table 0.7 Years riding with Uber
Frequency Percent Valid Percent
Cumulative Percent
Valid Less than a year 85 58.6 59.0 59.0
1-3 years 49 33.8 34.0 93.1
More than 3 years 10 6.9 6.9 100.0
Total 144 99.3 100.0
Missing System 1 .7
27
From the response in table 4.7, 58.6% of the Uber riders had been riding with Uber for less than a year, 33.8% had been riding with Uber for 1-3 years, 6.9% had been riding with Uber for more than 3 years.
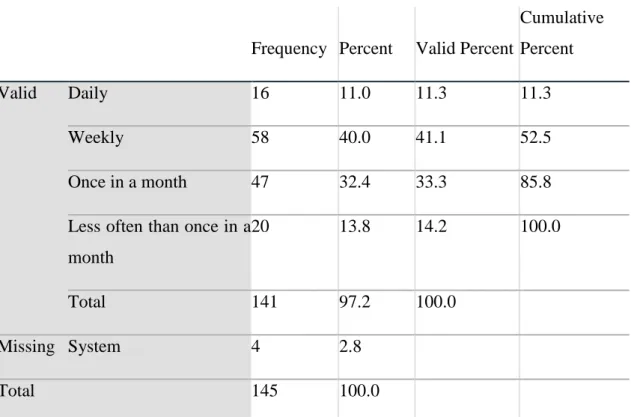
4.3.7. Frequency of Using Uber
Table 0.8 Frequency of Using Uber
Frequency Percent Valid Percent
Cumulative Percent
Valid Daily 16 11.0 11.3 11.3
Weekly 58 40.0 41.1 52.5
Once in a month 47 32.4 33.3 85.8
Less often than once in a month
20 13.8 14.2 100.0
Total 141 97.2 100.0
Missing System 4 2.8
Total 145 100.0
From the response in table 4.8, out of Uber’s riders, 11% ride with Uber daily, 40% weekly, 32.4% monthly, 13.8% ride less often than once in a month.
4.4. Uber’s rider satisfaction
Descriptive analysis was applied in order to examine Uber riders’ perceived satisfaction over the services and features provided by Uber. To calculate the mean of the satisfaction level, a Likert Scale of five levels, 1 being “least satisfied” to 5 being “most satisfied” was used. Each service attribute and the satisfaction level over the general relationship with Uber responses are measured and the results are provided in Table 4.9. Similarly, to measure how much participants agree with the statements regarding each service attribute separately and the general relationship with Uber, a Likert Scale of five levels, 1 “Strongly
28
disagree” to 5 “Strongly agree” was used, which is tabulated in Table 4.10. Finally, the satisfaction level of the respondents was measured for the service attributes of the normal taxi in which a Likert Scale of five levels from, 1 being “least satisfied” to 5 being “most satisfied” was used, as in Table 4.11.
Table 0.9 satisfaction level over services and features of Uber
N Mean Std. Deviation Money saver 145 4.0207 .97517 Availability 145 4.2000 1.03816 Waiting time 145 4.0690 1.01827 Uber's app 144 4.4514 .90708 Uber’s safety 145 4.3310 .94322 Navigation system 144 4.1319 1.02586 Time estimation system 145 4.0966 1.00225 Driver Politeness 145 4.5103 .85892 Uber experience 145 4.3517 .92444 Paying method 145 4.7448 2.58140 General relationship with Uber 145 4.2621 4.2621 Valid N (listwise) 143
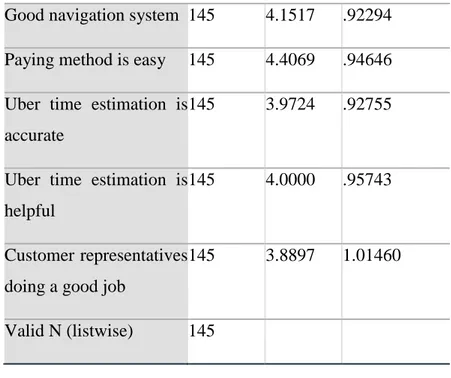
Table 0.10 riders’ agreement level
N Mean Std. Deviation
29
Good navigation system 145 4.1517 .92294 Paying method is easy 145 4.4069 .94646 Uber time estimation is
accurate
145 3.9724 .92755
Uber time estimation is helpful
145 4.0000 .95743
Customer representatives doing a good job
145 3.8897 1.01460
Valid N (listwise) 145
Table 0.11 riders’ satisfaction level for normal taxi
N Mean Std. Deviation Ride cost 145 2.1172 1.12116 Taxi availability 145 2.3793 1.11846 Waiting time 144 2.5417 1.16400 Trip route 144 1.9097 1.08977 Driver politeness 145 1.8897 1.07443 Paying method 144 1.9444 1.08890 Pick-up and
drop-off place
145 2.3448 1.22689
Valid N (listwise) 142
As shown in Table 4.9, the means of Uber’s services and features satisfaction level indicate that costumers were satisfied with all services and features in. The mean of the score of
30
the general relationship with Uber also indicates that customers are satisfied with the services and features Uber is providing (M >4.2621(.89769 Std. Deviation)).
Hence, the following points can be noted regarding the satisfaction level over Uber services and features:
Paying method: This feature received the highest mean of 4.7448 (2.58140 Std. Deviation) and became the feature of Uber the customers are the most satisfied with. Similarly, the statement “Paying method is easy” has the highest agreement level, with a score of 4.4069 (.94646Std. Deviation). Comparing it with the satisfaction level for the same feature provided by normal taxi, paying method of normal is scored at a mean value of 1.9444(1.08890 Std. Deviation), being the second worst feature for normal taxi in terms of customer satisfaction.
Driver Politeness: This is the second feature that people are most satisfied with, at an average satisfaction level of 4.5103 (and with the lowest Std. Deviation of all features, .85892). In contrary, the driver politeness satisfaction level of normal taxi is 1.8897(1.07443 Std. Deviation), which was the worst feature of normal taxi in terms of customer satisfaction.
Uber's app: This is the third feature that people are satisfied with, at an average satisfaction level of 4.4514 (.90708 Std. Deviation). Similarly, there was an average 4.2414 agreement level (.97379 Std. Deviation) on the statement of “Uber’s app is easy-to-use”.
Uber experience: This is the forth feature that people are satisfied with, at an average satisfaction level of 4.3517 (.92444 Std. Deviation).
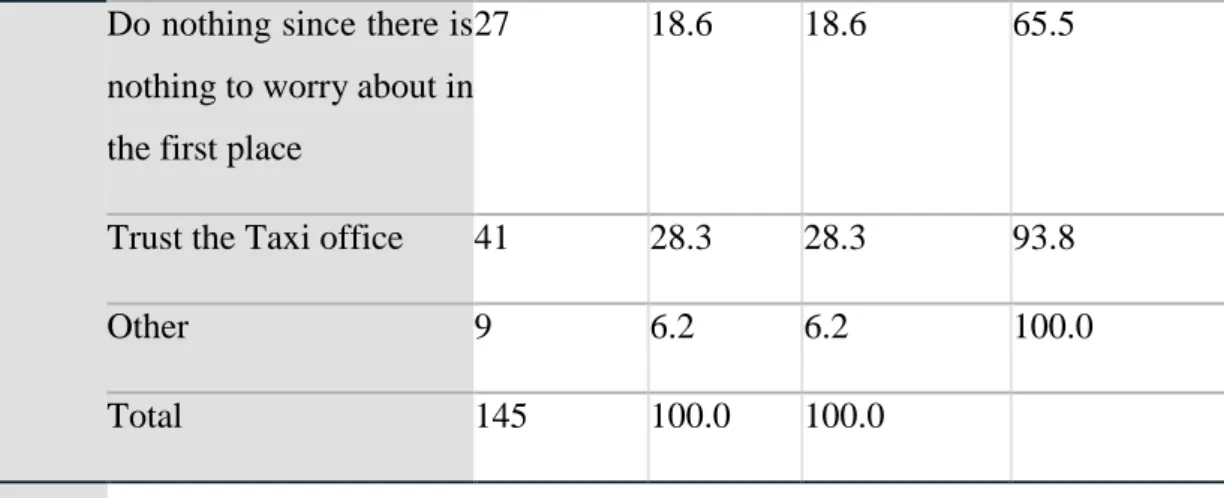
Uber safety: This is the fifth feature that people are satisfied with, at an average satisfaction level of 4.3310 (.94322Std. Deviation). To get a better understanding of people’s usual concerns toward safety, a question was asked to determine people’s actions when hailing a taxi. The answers reveled the following answers in table 4.12:
-40.7% of the participants choose the answer “Remember the car license plate”. -28.3% of the participants choose the answer “Trust the Taxi office”.
-18.6% of the participants choose the answer “Do nothing since there is nothing to worry about in the first place”.
31
-6.2% of the participants choose the answer “Remember other information regarding the car (such as taxi office) or its driver”.
-6.2% of the participants choose the answer “other” in which, some other actions were used to deal with safety issues, the answers collected are provided in table 4.13.
In order to find out if these concerns and the actions related to them have any difference between hailing a normal taxi and hailing an Uber taxi, the following question were asked: “With Uber knowing both sides’ contact information, phone number, bank account number and the car information, is there any reason to choose normal taxi rather than Uber regarding your safety?” table 4.14 provided the following answers:
-86.9% which makes the majority of the participants choose the answer “No”. -12.4% chose the answer “Yes” in which people expressed some reasons, the reasons collected are provided in table 4.15.
Money saver: This feature has the lowest score at a mean of 4.0207 (.97517 Std. Deviation).
Waiting time: This feature has the second to lowest score at a mean of 4.0690 (1.01827 Std. Deviation) and the same feature got a satisfaction level of 2.5417 (1.16400 Std. Deviation), becoming the most satisfying feature in the normal taxi. Table 0.12 safety actions
Frequency Percent Valid Percent
Cumulative Percent Valid Remember the car license
plate
59 40.7 40.7 40.7
Remember other
information regarding the car (such as taxi office) or its driver
32
Do nothing since there is nothing to worry about in the first place
27 18.6 18.6 65.5
Trust the Taxi office 41 28.3 28.3 93.8
Other 9 6.2 6.2 100.0
Total 145 100.0 100.0
Table 0.13 safety concerns
Safety concerns English translation
Plakayı bi arkadaşa atarım Forward the plate to a friend Taksi kullanmıyorum bildiğim sabit
taksi olmasına özen gösteririm
I do not use taxi, I make sure that I am always working with a fixed taxi that I know from before
yakınlarımla iletişim halinde olurum I communicate with my relatives
Table 0.14 Safety preference
Frequency Percent Valid Percent
Cumulative Percent Valid Yes 18 12.4 12.5 12.5 No 126 86.9 87.5 100.0 Total 144 99.3 100.0 Missing System 1 .7 Total 145 100.0
33
Table 0.15 safety reasons to choose normal taxi safety reasons to choose normal
taxi English translation
Eğer yanıtınız evet’se lütfen ayrıntılı sebebini belirtiniz: Daha konforlu ve güler yüzlü
More comfortable and friendly
Karşımda sorumlu olan bir kurum olması
A responsible organization to answer my complaints
Über'den haberleri yoktur Those people did not know about Uber
4.5. Correlations for Uber’s rider satisfaction
For the purpose of examining the relationship between the riders’ satisfaction level with the services and features provided by Uber and the satisfaction with the general relationship with Uber, a Pearson Coefficient was conducted, which is a type of correlation that will represent the strength of association between two measured variables. The Pearson coefficient is represented in a value ranging from r = -1(a perfect negative relationship) to r = +1 (perfect positive relationship), r = 0 means that there is no correlation between the two variables. (Investopedia)
Level of significance: for a two-tail test, degree of freedom of 142 (# of pairs -2) for Uber’s safety and 143 (# of pairs -2) for all other variables. The correlation is significant when the p (the significant degree) are less than 0.01 for values with ** on top, less than 0.05 for values with * on top.
34
A Pearson’s Coefficient correlation is done with IBM SPSS the statistical software and presented in Table 4.16.
Table 0.16 rider satisfaction Correlations.
Avail abilit y Wa itin g tim e Ub er's ap p Ub er’ s saf ety Navi gatio n syste m Time estim ation syste m Driv er Polit eness Uber exper ience Pay ing met hod Gen eral relat ions hip Mone y saver Pears on Corre lation .538* * .53 7** .52 3** .41 5** .320* * .367* * .435* * .354* * 0.1 21 .335 ** Sig. (2-tailed ) 0.000 0.0 00 0.0 00 0.0 00 0.000 0.00 0 0.000 0.000 0.1 48 0.00 0 N 145 145 14 4 14 5 144 145 145 145 145 145 Avail abilit y Pears on Corre lation .70 9** .54 0** .58 4** .446* * .535* * .477* * .563* * 0.1 57 .495 ** Sig. (2-tailed ) 0.0 00 0.0 00 0.0 00 0.000 0.00 0 0.000 0.000 0.0 60 0.00 0
35 N 145 14 4 14 5 144 145 145 145 145 145 Waiti ng time Pears on Corre lation .66 0** .62 0** .532* * .619* * .587* * .572* * .17 3* .383 ** Sig. (2-tailed ) 0.0 00 0.0 00 0.000 0.00 0 0.000 0.000 0.0 37 0.00 0 N 14 4 14 5 144 145 145 145 145 145 Uber' s app Pears on Corre lation .69 5** .566* * .565* * .668* * .624* * 0.1 53 .384 ** Sig. (2-tailed ) 0.0 00 0.000 0.00 0 0.000 0.000 0.0 68 0.00 0 N 14 4 143 144 144 144 144 144 Uber’ s safety Pears on Corre lation .715* * .671* * .707* * .766* * 0.0 95 .553 ** Sig. 0.000 0.00 0 0.000 0.000 0.2 57 0.00 0
36 tailed ) N 144 145 145 145 145 145 Navig ation syste m Pears on Corre lation .722* * .621* * .708* * 0.1 10 .439 ** Sig. (2-tailed ) 0.00 0 0.000 0.000 0.1 88 0.00 0 N 144 144 144 144 144 Time estim ation syste m Pears on Corre lation .620* * .735* * 0.1 04 .497 ** Sig. (2-tailed ) 0.000 0.000 0.2 15 0.00 0 N 145 145 145 145 Drive r Polite ness Pears on Corre lation .708* * .26 9** .366 ** Sig. 0.000 0.0 01 0.00 0
37 tailed ) N 145 145 145 Uber experi ence Pears on Corre lation 0.0 90 .491 ** Sig. (2-tailed ) 0.2 80 0.00 0 N 145 145 Payin g metho d Pears on Corre lation 0.12 8 Sig. (2-tailed ) 0.12 5 N 145 Gener al relati onshi p Pears on Corre lation Sig.