Attenuated Total Reflectance
–Fourier Transform Infrared (ATR–FTIR)
Spectroscopy Combined with Chemometrics for Rapid Determination
of Cold-Pressed Wheat Germ Oil Adulteration
Fatma Nur Arslan1,2&Fethi Çağlar1
Received: 13 June 2018 / Accepted: 14 September 2018 / Published online: 1 October 2018 # Springer Science+Business Media, LLC, part of Springer Nature 2018
Abstract
This paper describes the feasibility of attenuated total reflectance–Fourier transform infrared (ATR–FTIR) spectroscopy com-bined with multivariate data analyses for rapid determination of cold-pressed wheat germ oil (WGO) adulteration. Thirty-six pure edible oils, as well as 216 binary blends of WGO adulterated with cheaper refined oils, sunflower (SFO), and soybean oil (SBO) (1–50%) were analyzed by using ATR–FTIR spectroscopy in combination with PCA, LDA, SIMCA, and PLSR analyses. SIMCA models provide excellent classification for pure cold-pressed WGO and refined edible oil samples, with 95% signifi-cance level. The classification limits for detection of SFO and SBO adulterations in WGO were below 1%. Furthermore, a total of 100% of studied samples were correctly classified on the basis of their origin in calibration and in cross-validation by LDA models. Under the optimum conditions, the PLS–R plots of actual versus predicted values exhibited high linearity (R2
> 0.9990). The content of SFO and SBO adulterants has been successively quantified using PLSR at levels < 0.56% and < 0.99% in an unknown mixture. RMSEC and RMSECV values for the binary mixtures of WGO–SFO were between 0.56–1.98% and 0.68– 4.46%, for the binary mixtures of WGO–SBO were between 0.99–1.77% and 1.09–5.12%, respectively.
Keywords Adulteration . Wheat germ oil . Spectroscopy . Chemometrics
Abbreviations
ATR Attenuated total reflectance
CSO Cotton seed oil
FAME Fatty acid methyl ester FID Flame ionization detector FT–IR Fourier transform infrared
GC Gas chromatography
HNO Hazelnut oil
OO Olive oil
PCA Principal component analysis PLS–R Partial least squares regression RMSEC Root mean square error of calibration RMSECV Root mean square error of cross validation
SBO Soybean oil
SFO Sunflower oil
SIMCA Soft independent modeling of class analogies
WGO Wheat germ oil
LDA Linear discriminant analysis
FA Fatty acids
PUFA Polyunsaturated fatty acids MUFA Monounsaturated fatty acids SFA Saturated fatty acids
PC Principle component
SNV Standard normal variate
Introduction
Wheat germ oil (WGO) is precious edible oil obtained from germ parts of wheat (Triticum aestivum L.) cereal. It is an excellent source of fat-soluble bioactive compounds, Electronic supplementary material The online version of this article
(https://doi.org/10.1007/s12161-018-1368-x) contains supplementary material, which is available to authorized users.
* Fatma Nur Arslan [email protected] Fethi Çağlar
1
Department of Chemistry, Faculty of Science, University of Karamanoglu Mehmetbey, 70100 Karaman, Turkey
2 Van’t Hoff Institute for Molecular Sciences, Analytical Chemistry
Group, University of Amsterdam, Science Park 904, 1098 XH, Amsterdam, Netherlands
especially polyunsaturated fatty acids (PUFA) and tocoph-erols (vitamin E). The fatty acid composition of WGO is made of linoleic acid (ω-6, 42–63%), oleic acid (12–30%), palmitic acid (11–19%), linolenic acid (ω-3, 2–11%), and stearic acid (0.6–3.6%) and, it is reported to have the highest tocopherol (vitamin E) content among other edible oils (~ 2000 mg kg−1 oil or even higher) (Karabacak et al.2011; Mateo et al.2015; Yazicioglu et al.2015; Ghafoor et al.2017; Zou et al.2018). WGO also contains the high contents of fat-soluble bioactive compounds, such as phytosterols, carotenoids, policosanols, thiamin, and riboflavin. High concentration of these bioactive compounds provide excellent nutritional and health benefits to WGO such as reducing cholesterol levels, improving physical endurance, and retarding the effects of aging. Moreover, WGO has recently been used as a fertility agent, an antioxi-dant, and is also gaining popularity as a functional food ingre-dient (Eisenmenger and Turgut 2008; Arshad et al. 2013; Mateo et al.2015; Li et al.2016; Karadeniz et al.2018).
Due to the increasing concerns on functional foods espe-cially in developed countries, it has led to the increased con-sumption of cold-pressed oils (Parker et al.2003; Yu et al. 2005; Ramadan2013; Ge et al.2014). However, due to the high prices of cold-pressed oils, it is targeted for adulteration with cheaper and lower quality refined vegetable oils. Therefore, the development of rapid analytical methods for detecting adulteration of cold-pressed oils is a focus of great interest, both for reasons of humans’ health and demand as well as with regard to controlling of product’s quality in in-dustry laboratories (Poulli et al.2006; Ge et al.2014; Li et al. 2015).
In recent years, Fourier transform infrared (FTIR) spec-troscopy has emerged as an important analytical technique for the quality control analysis of agro-food products. It has become an attractive option because of it has so many advantages of being simple, non-destructive, rapid, and less costly. This technique overcomes many of the disad-vantages of the wet-chemical and time-consuming tech-niques, because it avoids time-consuming and labor-intensive sample pre-treatment procedures and usage of chemicals. It can be easily adapted for use by untrained personnel for real-time in-situ analysis. Moreover, this spectroscopic technique with chemometrics can be adopted for both qualitative and quantitative analysis of food products (Rohman and Che Man2010; Rohman and Man 2011; Lohumi et al. 2015; Marikkar et al. 2016). Recently, FTIR spectroscopic methods combined with multivariate data analyses have received a great deal of attention in adulteration analysis of different varieties of food products, including meat (Rohman et al.2011), milk (Jawaid et al. 2013), cereal products (Sujka et al. 2017), biscuit (Che Man et al. 2011), cake (Syahariza et al. 2005), chocolate (Marikkar et al.2016), and fish packing products (Dominguez-vidal et al. 2016). Similarly, this
technique has been successfully used combined with mul-tivariate data analysis for detection of adulteration of ed-ible oils, both qualitative (characterization, classification, and adulteration) and quantification (determination of adulterant concentration) analysis. In the literature, the adulteration of high-quality cold-pressed oils with lower quality refined vegetable oils, such as virgin coconut oil with palm and olive oils (Rohman et al.2010), walnut oil with sunflower oil (Ge et al.2014; Li et al. 2015), black cumin seed oil with soybean and corn oils (Rohman and Ariani 2013), sesame oil with hazelnut, sunflower, and canola oils (Ozulku et al. 2017), virgin olive oil with any vegetable oils (Teresa et al. 2017) etc., are also well-documented. However, to our best knowledge, there is no research has been reported on the qualitative and quantitative analysis of cold-pressed wheat germ oil adul-teration with lower quality refined vegetable oils using spectroscopic techniques with chemometrics.
The aim of this study was (i) to develop multivariate clas-sification models based on attenuated total reflectance– Fourier transform infrared (ATR–FTIR) spectra in full and characteristic wavenumber regions for discrimination of cold-pressed WGO samples from other refined vegetable oils, (ii) to develop multivariate classification models based on ATR–FTIR spectra for discrimination of pure cold-pressed WGO samples from binary blends of WGO adulterated with refined sunflower oil (SFO) or soybean oil (SBO), and (iii) to develop multivariate regression models based on full ATR– FTIR spectra for quantification of adulterant levels in binary blends of WGO adulterated with SFO or SBO. A variety of multivariate data analyses including principle component analysis (PCA), linear discriminant analysis (LDA), soft inde-pendent modeling of class analogies (SIMCA), and partial least square regression (PLSR) analysis were used for chemo-metric analysis.
Materials and Methods
Chemicals and Samples
HPLC grade methanol, n-hexane, and ethanol were purchased from VWR International (Poole, UK). Fatty acid methyl ester (FAME) 37 mix standard, sodium hydroxide, and anhydrous sodium sulphate reagents were purchased from Sigma-Aldrich Chemicals (Zwijndrecht, The Netherlands). A total of 37 pure vegetable oil samples including different trade-marks of cold-pressed wheat germ oil (n = 11; WGO–1 to 11), refined sunflower oil (n = 5; SFO–1 to 5), soybean oil (n = 5; SBO–1 to 5), cotton seed oil (n = 5; CSO–1 to 5), hazelnut oil (n = 5; HNO–1 to 5), and olive oil (n = 5; OO–1 to 5) were purchased from the local supermarkets (Karaman, Turkey), and their quality were guaranteed by the suppliers.
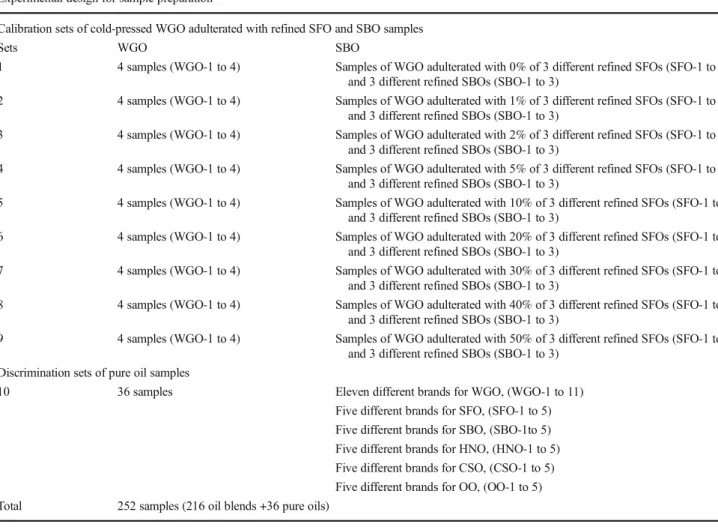
Experimental Set-up for Sample Preparation
The experimental design for sample preparation procedure with the code of oil samples is given in Table1. To construct the oil blends, four selected trademarks of WGO (n = 4; WGO–1 to 4) were mixed with three selected brands of SFOs (n = 3; SFO–1 to 3) and SBOs (n = 3; SBO–1 to 3). To estimate the adulteration level of WGO samples adulterat-ed with low-pricadulterat-ed refinadulterat-ed oils, two sets of binary mixtures: cold-pressed WGO with refined SFO and cold-pressed WGO with refined SBO, were prepared by adding to WGO the adul-terant, SFO or SBO, respectively, ranging from 1 to 50%.
As given in Table1, nine of the sample set consisted on the oil blends and one of them the pure oil samples. Thirty-six samples of pure vegetable oils and 216 samples of blend oils were used in this study. For quantitative analysis, 27 samples were randomly selected among these blends, and used for validating the partial least square regression models. Other 81 samples and 4 different cultivars of WGOs (WGO–1 to 4) were used for establishing the PLSR models. All samples
were stored under refrigeration until the analysis and were shaken to ensure total homogenization before ATR–FTIR spectra measurements.
Attenuated Total Reflectance
–Fourier Transform
Infrared Spectra Measurements
The attenuated total reflectance–Fourier transform infrared (ATR–FTIR) spectra measurements were performed on a Perkin-Elmer Spectrum 100 FT–IR Spectrometer (Perkin Elmer, Waltham, USA). ATR–FTIR measurements were per-formed by using approximately 5μL of oil sample on the diamond ATR crystal plate. The spectrums of each sample were recorded in transmittance mode from 4000 to 650 cm−1, with a resolution of 4 cm−1and co-adding 64 scans (Li et al.2015), and the collection time for each sample spec-trum was approximately 2 min. After every scan, the spectra were subtracted against background air spectrum. The spectra were recorded in transmittance mode at each data point, and each measurement was repeated four times. The ATR crystal
Table 1 Experimental design for the sample preparation procedure Experimental design for sample preparation
Calibration sets of cold-pressed WGO adulterated with refined SFO and SBO samples
Sets WGO SBO
1 4 samples (WGO-1 to 4) Samples of WGO adulterated with 0% of 3 different refined SFOs (SFO-1 to 3) and 3 different refined SBOs (SBO-1 to 3)
2 4 samples (WGO-1 to 4) Samples of WGO adulterated with 1% of 3 different refined SFOs (SFO-1 to 3) and 3 different refined SBOs (SBO-1 to 3)
3 4 samples (WGO-1 to 4) Samples of WGO adulterated with 2% of 3 different refined SFOs (SFO-1 to 3) and 3 different refined SBOs (SBO-1 to 3)
4 4 samples (WGO-1 to 4) Samples of WGO adulterated with 5% of 3 different refined SFOs (SFO-1 to 3) and 3 different refined SBOs (SBO-1 to 3)
5 4 samples (WGO-1 to 4) Samples of WGO adulterated with 10% of 3 different refined SFOs (SFO-1 to 3) and 3 different refined SBOs (SBO-1 to 3)
6 4 samples (WGO-1 to 4) Samples of WGO adulterated with 20% of 3 different refined SFOs (SFO-1 to 3) and 3 different refined SBOs (SBO-1 to 3)
7 4 samples (WGO-1 to 4) Samples of WGO adulterated with 30% of 3 different refined SFOs (SFO-1 to 3) and 3 different refined SBOs (SBO-1 to 3)
8 4 samples (WGO-1 to 4) Samples of WGO adulterated with 40% of 3 different refined SFOs (SFO-1 to 3) and 3 different refined SBOs (SBO-1 to 3)
9 4 samples (WGO-1 to 4) Samples of WGO adulterated with 50% of 3 different refined SFOs (SFO-1 to 3) and 3 different refined SBOs (SBO-1 to 3)
Discrimination sets of pure oil samples
10 36 samples Eleven different brands for WGO, (WGO-1 to 11) Five different brands for SFO, (SFO-1 to 5) Five different brands for SBO, (SBO-1to 5) Five different brands for HNO, (HNO-1 to 5) Five different brands for CSO, (CSO-1 to 5) Five different brands for OO, (OO-1 to 5) Total 252 samples (216 oil blends +36 pure oils)
plate was cleaned with hexane, followed by ethanol, and dried before a new sampling.
Fatty Acid Composition Analysis by Gas
Chromatography
The fatty acid compositions of the pure and blend oil samples were determined using GC–FID according to Arslan et al. (Arslan et al.2017). Previous to the chromatographic analysis, a base-catalyzed esterification reaction was applied to the oil samples. This reaction was performed using the following
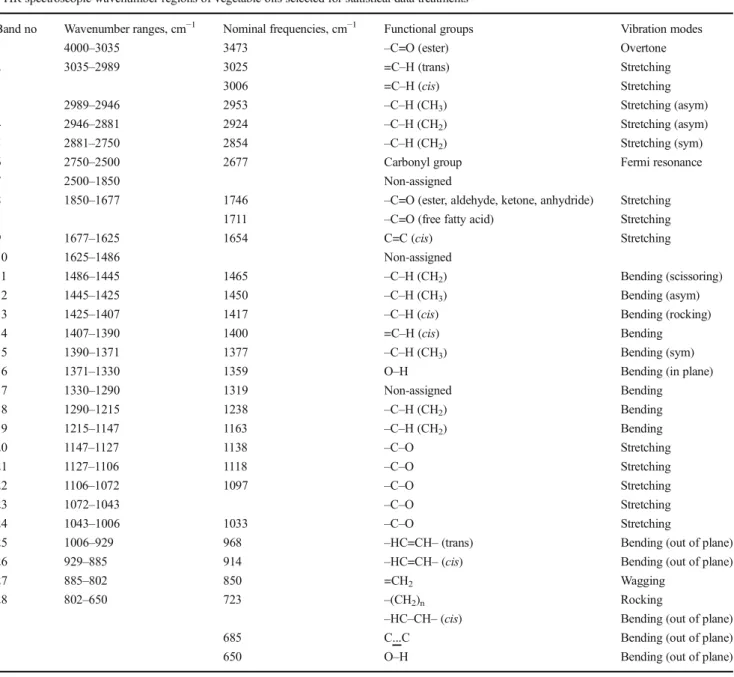
procedure: 0.10 g of the oil sample was weighed into a centrifuge tube and dissolved in 10.0 mL of n-hexane. Afterwards, 0.10 mL of 2 N potassium hydroxide in methanol was added and the solution was subjected to centrifugation by adding anhydrous sodium sulphate for 5 min, at 2000 rpm. The upper layer made ready for analysis was transferred to a GC vials and stored at− 25 °C until analysis. Chromatographic analyses were performed on Agilent 7890A GC system equipped with a flame ionization detector (FID) (Agilent Technologies Inc., Wilmington, DE, USA). A highly polar HP–88 cyanopropyl capillary column (100 m × 0.25 mm i.d. with a 0.2μm film thickness) was used Table 2 Twenty-eight spectroscopic regions of vegetable oils selected for statistical data treatments, and their ranges, nominal frequencies, functional and vibration modes
FTIR spectroscopic wavenumber regions of vegetable oils selected for statistical data treatments
Band no Wavenumber ranges, cm−1 Nominal frequencies, cm−1 Functional groups Vibration modes
1 4000–3035 3473 –C=O (ester) Overtone
2 3035–2989 3025 =C–H (trans) Stretching
3006 =C–H (cis) Stretching
3 2989–2946 2953 –C–H (CH3) Stretching (asym)
4 2946–2881 2924 –C–H (CH2) Stretching (asym)
5 2881–2750 2854 –C–H (CH2) Stretching (sym)
6 2750–2500 2677 Carbonyl group Fermi resonance
7 2500–1850 Non-assigned
8 1850–1677 1746 –C=O (ester, aldehyde, ketone, anhydride) Stretching
1711 –C=O (free fatty acid) Stretching
9 1677–1625 1654 C=C (cis) Stretching
10 1625–1486 Non-assigned
11 1486–1445 1465 –C–H (CH2) Bending (scissoring)
12 1445–1425 1450 –C–H (CH3) Bending (asym)
13 1425–1407 1417 –C–H (cis) Bending (rocking)
14 1407–1390 1400 =C–H (cis) Bending
15 1390–1371 1377 –C–H (CH3) Bending (sym)
16 1371–1330 1359 O–H Bending (in plane)
17 1330–1290 1319 Non-assigned Bending 18 1290–1215 1238 –C–H (CH2) Bending 19 1215–1147 1163 –C–H (CH2) Bending 20 1147–1127 1138 –C–O Stretching 21 1127–1106 1118 –C–O Stretching 22 1106–1072 1097 –C–O Stretching 23 1072–1043 –C–O Stretching 24 1043–1006 1033 –C–O Stretching
25 1006–929 968 –HC=CH– (trans) Bending (out of plane)
26 929–885 914 –HC=CH– (cis) Bending (out of plane)
27 885–802 850 =CH2 Wagging
28 802–650 723 –(CH2)n Rocking
–HC–CH– (cis) Bending (out of plane)
685 C...C Bending (out of plane)
650 O–H Bending (out of plane)
Table was constituted according to References (Vlachos et al.2006; Lerma-Garcia et al.2010; Rohman and Che Man2010; Saucedo-hern et al.2011; Zhang et al.2012; Jovic et al.2016)
for separations. The oven temperature was programmed as fol-lows: the initial temperature was 40 °C and hold in this temper-ature for 4 min, then ramped into 170 °C (13 °C min−1) and hold in this temperature for 27 min, increased from 170 to 210 °C (4 °C min−1), and finally hold at 210 °C for 35 min. The temper-atures of detector and injector were kept at 225 °C during the analysis. The carrier gas hydrogen at the column flow rate of 1 mL min−1, the fuel gas was hydrogen at the flow rate of 45 mL min−1, and the oxidant gas was air at the flow rate of 450 mL min−1. A sample of 1μL was injected with the split ratio of 10:1. GC–FID data were recorded using Agilent’s Chemstation B.03.02–2008 data processor. The results were expressed as percentage based on peak areas and wt/wt (%) of the total FAs. All measurements related to fatty acid profile were performed in triplicate and the results were reported as mean ± standard deviation.
Multivariate Data Analysis and Software
The FTIR raw data files were exported to Octave Chemometrics Software Version 4.2.1 (GNU General Public License) before multivariate data analysis. Multivariate data analysis was per-formed using the software Unscrambler®X10.5.1 (CAMO soft-ware, Oslo, Norway). To reduce the variability related to the intensity and derived from baseline, scattering effects, detector variations, or effects of instrumental sensitivity, standard normal variate (SNV) (Savitzky and Golay1964) and smoothing apply-ing the Savitzky–Golay algorithm (De-Hua et al.2012) were performed. The ATR–FTIR spectra were divided into the 28 different wavenumber regions given in Table2. The selected regions reported in previous studies (Vlachos et al. 2006; Lerma-Garcia et al. 2010; Rohman and Che Man 2010;
Saucedo-hern et al.2011; Zhang et al.2012; Jovic et al.2016) correspond to a peak or a shoulder, signifying structural or func-tional group information of several bioactive compounds in veg-etable oils.
Three different chemometric tools have been applied for clas-sification, including soft independent modeling of class analo-gies (SIMCA), linear discriminant analysis (LDA), and principal component analysis (PCA), and the classification results from each model have been assessed on the basis of several quality metrics. The class scores were presented on the principal com-ponent (PC) axes and the class distances and misclassifications were determined using SIMCA models (Borràs et al.2015). For classification studies, each of the selected wavenumber regions (see Table2) was also evaluated in detail. Partial least square regression (PLSR) has been applied for quantification. In PLSR models, full cross-validation process was performed in validation with as many subsets as were included in the calibration matrix (leave-one-out method). Root mean square error of calibration (RMSEC), root mean square error of cross validation (RMSECV), R-square, slope, and offset statistical values were used for accuracy evaluation of the quantification methods. The ATR–FTIR spectra figures were generated by OriginPro 8 (OriginLab, Northampton, MA, USA) software.
Results and Discussion
FTIR Spectra of Oil Samples
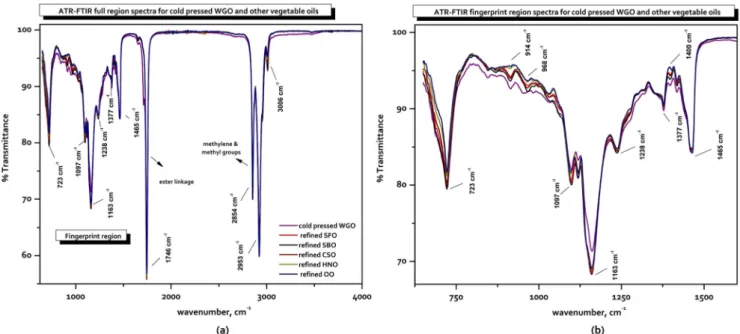
Spectra of cold-pressed wheat germ oil (WGO) and refined vegetable oil samples (sunflower, soybean, cottonseed, hazel-nut, and olive oils) are presented in Fig.1. As observed in this
Fig. 1 a Full and b finger print region spectra of the cold pressed wheat germ oil and refined edible oils in the spectroscopic wavenumber region of 4000– 650 cm−1
figure, the spectrum of cold-pressed WGO exhibited unimpor-tant differences with respect to the other oils; however, the spec-tra of refined sunflower oil (SFO), soybean oil (SBO), and cot-ton seed oil (CSO) were very quite similar to each other. In addition, the spectra of hazelnut oil (HNO) and olive oil (OO) were also very quite similar. SFO, SBO, and CSO, as well as WGO contain higher proportion of linolenic acyl groups, whereas OO and HNO samples consist higher proportion of oleic acyl groups (see Tables3and4). The general forms of
spectra of these studied oils were also found to be very similar to previous reported studies (Vlachos et al. 2006; Rohman and Che Man2010; Rohman and Man2011; Ozulku et al.2017). The composition of vegetable oils affects the accurate position of the band and yields shifts when the proportion of fatty acid changes in triglyceride skeletons. FTIR spectra are mainly con-trolled by the characteristic triglyceride bands and also the pro-files of bioactive compounds, such as tocopherols, sterols, etc. (Gouvinhas et al. 2015; Wojcicki et al.2015; Ozulku et al.
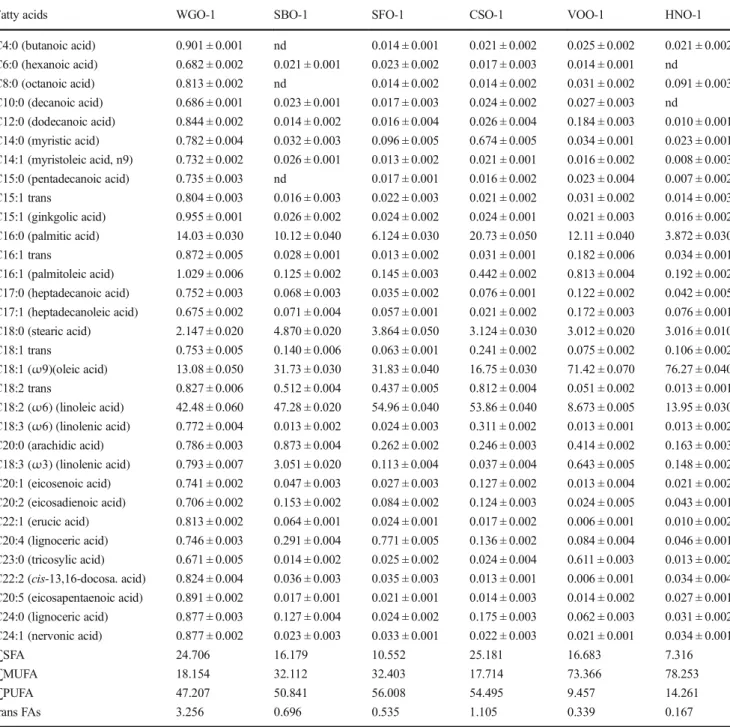
Table 3 Fatty acid profile of the oil samples used in the study, g/100 g of totally fatty acids (%)
Fatty acids WGO-1 SBO-1 SFO-1 CSO-1 VOO-1 HNO-1
C4:0 (butanoic acid) 0.901 ± 0.001 nd 0.014 ± 0.001 0.021 ± 0.002 0.025 ± 0.002 0.021 ± 0.002 C6:0 (hexanoic acid) 0.682 ± 0.002 0.021 ± 0.001 0.023 ± 0.002 0.017 ± 0.003 0.014 ± 0.001 nd C8:0 (octanoic acid) 0.813 ± 0.002 nd 0.014 ± 0.002 0.014 ± 0.002 0.031 ± 0.002 0.091 ± 0.003 C10:0 (decanoic acid) 0.686 ± 0.001 0.023 ± 0.001 0.017 ± 0.003 0.024 ± 0.002 0.027 ± 0.003 nd C12:0 (dodecanoic acid) 0.844 ± 0.002 0.014 ± 0.002 0.016 ± 0.004 0.026 ± 0.004 0.184 ± 0.003 0.010 ± 0.001 C14:0 (myristic acid) 0.782 ± 0.004 0.032 ± 0.003 0.096 ± 0.005 0.674 ± 0.005 0.034 ± 0.001 0.023 ± 0.001 C14:1 (myristoleic acid, n9) 0.732 ± 0.002 0.026 ± 0.001 0.013 ± 0.002 0.021 ± 0.001 0.016 ± 0.002 0.008 ± 0.003 C15:0 (pentadecanoic acid) 0.735 ± 0.003 nd 0.017 ± 0.001 0.016 ± 0.002 0.023 ± 0.004 0.007 ± 0.002 C15:1 trans 0.804 ± 0.003 0.016 ± 0.003 0.022 ± 0.003 0.021 ± 0.002 0.031 ± 0.002 0.014 ± 0.003 C15:1 (ginkgolic acid) 0.955 ± 0.001 0.026 ± 0.002 0.024 ± 0.002 0.024 ± 0.001 0.021 ± 0.003 0.016 ± 0.002 C16:0 (palmitic acid) 14.03 ± 0.030 10.12 ± 0.040 6.124 ± 0.030 20.73 ± 0.050 12.11 ± 0.040 3.872 ± 0.030 C16:1 trans 0.872 ± 0.005 0.028 ± 0.001 0.013 ± 0.002 0.031 ± 0.001 0.182 ± 0.006 0.034 ± 0.001 C16:1 (palmitoleic acid) 1.029 ± 0.006 0.125 ± 0.002 0.145 ± 0.003 0.442 ± 0.002 0.813 ± 0.004 0.192 ± 0.002 C17:0 (heptadecanoic acid) 0.752 ± 0.003 0.068 ± 0.003 0.035 ± 0.002 0.076 ± 0.001 0.122 ± 0.002 0.042 ± 0.005 C17:1 (heptadecanoleic acid) 0.675 ± 0.002 0.071 ± 0.004 0.057 ± 0.001 0.021 ± 0.002 0.172 ± 0.003 0.076 ± 0.001 C18:0 (stearic acid) 2.147 ± 0.020 4.870 ± 0.020 3.864 ± 0.050 3.124 ± 0.030 3.012 ± 0.020 3.016 ± 0.010 C18:1 trans 0.753 ± 0.005 0.140 ± 0.006 0.063 ± 0.001 0.241 ± 0.002 0.075 ± 0.002 0.106 ± 0.002 C18:1 (ω9)(oleic acid) 13.08 ± 0.050 31.73 ± 0.030 31.83 ± 0.040 16.75 ± 0.030 71.42 ± 0.070 76.27 ± 0.040 C18:2 trans 0.827 ± 0.006 0.512 ± 0.004 0.437 ± 0.005 0.812 ± 0.004 0.051 ± 0.002 0.013 ± 0.001 C18:2 (ω6) (linoleic acid) 42.48 ± 0.060 47.28 ± 0.020 54.96 ± 0.040 53.86 ± 0.040 8.673 ± 0.005 13.95 ± 0.030 C18:3 (ω6) (linolenic acid) 0.772 ± 0.004 0.013 ± 0.002 0.024 ± 0.003 0.311 ± 0.002 0.013 ± 0.001 0.013 ± 0.002 C20:0 (arachidic acid) 0.786 ± 0.003 0.873 ± 0.004 0.262 ± 0.002 0.246 ± 0.003 0.414 ± 0.002 0.163 ± 0.003 C18:3 (ω3) (linolenic acid) 0.793 ± 0.007 3.051 ± 0.020 0.113 ± 0.004 0.037 ± 0.004 0.643 ± 0.005 0.148 ± 0.002 C20:1 (eicosenoic acid) 0.741 ± 0.002 0.047 ± 0.003 0.027 ± 0.003 0.127 ± 0.002 0.013 ± 0.004 0.021 ± 0.002 C20:2 (eicosadienoic acid) 0.706 ± 0.002 0.153 ± 0.002 0.084 ± 0.002 0.124 ± 0.003 0.024 ± 0.005 0.043 ± 0.001 C22:1 (erucic acid) 0.813 ± 0.002 0.064 ± 0.001 0.024 ± 0.001 0.017 ± 0.002 0.006 ± 0.001 0.010 ± 0.002 C20:4 (lignoceric acid) 0.746 ± 0.003 0.291 ± 0.004 0.771 ± 0.005 0.136 ± 0.002 0.084 ± 0.004 0.046 ± 0.001 C23:0 (tricosylic acid) 0.671 ± 0.005 0.014 ± 0.002 0.025 ± 0.002 0.024 ± 0.004 0.611 ± 0.003 0.013 ± 0.002 C22:2 (cis-13,16-docosa. acid) 0.824 ± 0.004 0.036 ± 0.003 0.035 ± 0.003 0.013 ± 0.001 0.006 ± 0.001 0.034 ± 0.004 C20:5 (eicosapentaenoic acid) 0.891 ± 0.002 0.017 ± 0.001 0.021 ± 0.001 0.014 ± 0.003 0.014 ± 0.002 0.027 ± 0.001 C24:0 (lignoceric acid) 0.877 ± 0.003 0.127 ± 0.004 0.024 ± 0.002 0.175 ± 0.003 0.062 ± 0.003 0.031 ± 0.002 C24:1 (nervonic acid) 0.877 ± 0.002 0.023 ± 0.003 0.033 ± 0.001 0.022 ± 0.003 0.021 ± 0.001 0.034 ± 0.001 ∑SFA 24.706 16.179 10.552 25.181 16.683 7.316 ∑MUFA 18.154 32.112 32.403 17.714 73.366 78.253 ∑PUFA 47.207 50.841 56.008 54.495 9.457 14.261 trans FAs 3.256 0.696 0.535 1.105 0.339 0.167
WGO wheat germ oil, SBO soybean oil, CSO cotton seed oil, SFO sunflower oil, OO olive oil, HNO hazelnut oil, SFA saturated fatty acid, MUFA monounsaturated fatty acid, PUFA polyunsaturated fatty acid
Table 4 F att y acid p ro fi le of th e cold-pressed w heat germ oil (WGO) samples used in the study , g/100 g of totally fatty acids (%) Fa tty ac ids F att y ac id pr ofi le o f the cold pr esse d W G O s, re fi ned S F O , and S B O samples, g/100 g o f totally fatty acids (%) WGO -1 W GO -2 WGO-3 W G O -4 WG O-5 W GO -6 WGO-7 W G O -8 WGO -9 W GO -10 W GO-11 C4:0 (butanoic acid) 0.901 ± 0.001 0.481 ± 0 .002 0.73 3 ± 0.006 1.067 ± 0.0 03 0. 582 ± 0.002 0.551 ± 0 .002 0.357 ± 0.005 0.172 ± 0.0 02 0.566 ± 0.001 0.317 ± 0 .00 2 0.409 ± 0.002 C6:0 (hexanoic acid) 0.682 ± 0.002 0.482 ± 0 .004 0.84 6 ± 0.001 1.51 1 ± 0.003 0. 665 ± 0.002 0.473 ± 0 .006 0.367 ± 0.005 0.191 ± 0.0 04 0.489 ± 0.002 0.350 ± 0 .00 1 0 .31 1 ± 0 .001 C8:0 (octanoic acid) 0.813 ± 0.002 0.629 ± 0 .001 0. 93 2 ± 0.002 2.001 ± 0.0 03 0.494 ± 0.001 0.469 ± 0 .001 0. 362 ± 0.002 0.149 ± 0.0 01 0.653 ± 0.001 0.246 ± 0 .00 2 0.399 ± 0.002 C10:0 (decanoic acid) 0.686 ± 0.001 0.486 ± 0 .001 0. 73 3 ± 0.003 1.143 ± 0.0 05 0.521 ± 0.002 0.402 ± 0 .002 0.334 ± 0.001 0.216 ± 0.0 01 0.432 ± 0.003 0.214 ± 0 .0 02 0.321 ± 0.001 C12:0 (dodecanoic acid) 0.844 ± 0.002 0.675 ± 0 .006 0.69 9 ± 0.002 1.561 ± 0.0 03 0.537 ± 0.001 0.483 ± 0 .006 0.342 ± 0.002 0.171 ± 0.0 06 0.343 ± 0.001 0.308 ± 0 .002 0.327 ± 0.001 C14:0 (myris tic acid) 0.782 ± 0.004 1.756 ± 0 .003 0.53 5 ± 0.002 0.679 ± 0.0 02 0.498 ± 0.003 0.410 ± 0 .002 0.560 ± 0.002 0.144 ± 0.0 03 0.295 ± 0.002 0.285 ± 0 .0 03 0.189 ± 0.003 C14:1 (myris toleic acid, n9) 0.732 ± 0.002 1.796 ± 0 .002 0.61 8 ± 0.001 0.584 ± 0.0 02 0.370 ± 0.001 0.496 ± 0 .002 0.349 ± 0.004 0.275 ± 0.0 02 0.390 ± 0.002 0.2 89 ± 0 .001 0.243 ± 0.002 C15:0 (pen tadecano ic acid) 0.735 ± 0.003 2.290 ± 0 .004 0.85 3 ± 0.008 0.852 ± 0.0 03 0.312 ± 0.001 0.415 ± 0 .005 0.395 ± 0.005 0.158 ± 0.0 04 0.449 ± 0.002 0.25 7 ± 0 .002 0.220 ± 0.001 C15:1 trans 0.804 ± 0.003 1.941 ± 0 .001 0.65 6 ± 0.002 0.791 ± 0.0 01 0.394 ± 0.003 0.410 ± 0 .001 0.340 ± 0. 001 0.151 ± 0.0 01 1.035 ± 0.003 0.190 ± 0 .001 0.253 ± 0 .002 C15:1 (ginkg olic acid) 0.955 ± 0.001 1.105 ± 0 .002 0.74 2 ± 0.002 0.540 ± 0.0 01 0.495 ± 0.001 0.375 ± 0 .003 0.458 ± 0.003 0.151 ± 0.0 02 0.746 ± 0.001 0.312 ± 0 .002 0.201 ± 0.001 C16:0 (palmitic acid) 14 .03 ± 0.030 13.681 ± 0.020 9.32 1 ± 0.050 13.60 ± 0.0 60 5.807 ± 0.020 8.840 ± 0 .030 15.62 ± 0.030 17.01 ± 0.0 20 5.358 ± 0.050 9.985 ± 0 .010 4.897 ± 0.010 C16:1 trans 0.872 ± 0.005 0.473 ± 0 .002 0.52 7 ± 0.002 0.519 ± 0.0 03 0.347 ± 0.003 0.476 ± 0 .002 0.547 ± 0. 002 0.209 ± 0.0 02 0.315 ± 0.002 0.322 ± 0 .002 0.361 ± 0 .003 C16:1 (palmitoleic acid) 1.029 ± 0. 006 0.470 ± 0 .004 0.66 7 ± 0.003 0.861 ± 0.0 05 0.369 ± 0.006 0. 604 ± 0 .004 0.663 ± 0.006 0.177 ± 0.0 04 0.524 ± 0.007 0.344 ± 0 .003 0.375 ± 0.003 C17:0 (hep tadecano ic acid) 0.752 ± 0.003 0.553 ± 0 .002 0.54 0 ± 0.002 0.847 ± 0.0 03 0.373 ± 0.002 0.484 ± 0 .001 0.416 ± 0.002 0.363 ± 0.0 02 0.323 ± 0.002 0.19 3 ± 0 .001 0.263 ± 0.003 C17: 1 (hep tade cano lei c ac id) 0.675 ± 0.002 0.893 ± 0 .002 0.58 3 ± 0.003 0.593 ± 0.0 01 0.442 ± 0.003 0.737 ± 0 .002 0.668 ± 0.003 0.277 ± 0.0 02 0.307 ± 0.001 0.350 ± 0 .002 0.206 ± 0.001 C18:0 (stearic acid) 2.147 ± 0.020 0.437 ± 0 .010 2.23 0 ± 0.010 1.661 ± 0.0 30 2. 965 ± 0.030 1.700 ± 0 .020 0.972 ± 0.020 0.676 ± 0.0 10 1.624 ± 0.030 1.637 ± 0 .02 0 1.643 ± 0.010 C18:1 trans 0.753 ± 0.005 0.402 ± 0 .003 0.41 3 ± 0.004 0.936 ± 0.0 02 0.350 ± 0.003 0.367 ± 0 .003 0.428 ± 0. 004 1.220 ± 0.0 03 0.305 ± 0.002 0.272 ± 0 .005 0.355 ± 0 .004 C18:1 (ω 9)(oleic acid) 13 .08 ± 0.050 12.31 ± 0 .040 25.6 1 ± 0.020 13.78 ± 0.0 40 25 .99 ± 0.020 34.32 ± 0 .010 14.57 ± 0.060 10.82 ± 0.0 40 55 .47 ± 0.030 34.28 ± 0 .030 55.4 1 ± 0.020 C18:2 trans 0.827 ± 0.006 0.749 ± 0 .004 1.15 3 ± 0.005 0.803 ± 0.0 03 1.058 ± 0.002 0.612 ± 0 .002 0.649 ± 0. 001 0.302 ± 0.0 04 0.627 ± 0.004 0.448 ± 0 .003 0.716 ± 0 .005 C18:2 (ω 6) (linoleic acid) 42 .48 ± 0.060 42.1 1 ± 0.040 42.6 1 ± 0.040 38.41 ± 0.0 20 47 .4 7 ± 0.030 39.07 ± 0 .030 50.07 ± 0.050 55.27 ± 0.0 40 17 .62 ± 0.050 42.53 ± 0 .030 2 0.62 ± 0.060 C18:3 (ω 6) (linolenic acid) 0.772 ± 0.004 0.464 ± 0 .003 0.54 3 ± 0.003 0.915 ± 0.0 02 0. 324 ± 0.001 0.620 ± 0 .002 0.338 ± 0.002 0.328 ± 0.0 03 0.354 ± 0.004 0.220 ± 0 .004 0.479 ± 0.002 C20:0 (arachidic acid) 0.786 ± 0.003 0.589 ± 0 .004 0.64 8 ± 0.003 0.653 ± 0.0 03 0.456 ± 0.004 0.573 ± 0 .004 0.448 ± 0.003 0.343 ± 0.0 04 0.807 ± 0.005 0.453 ± 0 .003 0.291 ± 0.002 C18:3 (ω 3) (linolenic acid) 0.793 ± 0.007 0.497 ± 0 .005 0.44 1 ± 0.006 0.735 ± 0.0 03 0. 794 ± 0.002 0.584 ± 0 .006 0.340 ± 0.005 0.208 ± 0.0 05 0.612 ± 0.004 0.192 ± 0 .004 0.666 ± 0.003 C20:1 (eicosenoic acid) 0.741 ± 0.002 0.716 ± 0 .002 0.42 9 ± 0.002 0.725 ± 0.0 02 1.141 ± 0.005 0.446 ± 0 .003 0.340 ± 0.003 0.281 ± 0.0 02 0.408 ± 0.006 0.256 ± 0 .002 0.661 ± 0.001 C20:2 (eicosadien oic acid) 0.706 ± 0 .002 2.456 ± 0 .002 0.48 6 ± 0.002 1.643 ± 0.0 01 0.559 ± 0.003 0.515 ± 0 .002 1.275 ± 0.001 0.315 ± 0.0 02 0.527 ± 0.004 0.76 7 ± 0 .003 1.71 1 ± 0.002 C22:1 (erucic acid) 0.813 ± 0.002 0.479 ± 0 .002 0.71 1 ± 0.00 5 0.996 ± 0.0 02 0.417 ± 0.002 0.404 ± 0 .001 0.356 ± 0.004 0.177 ± 0.0 02 0.474 ± 0.003 0.671 ± 0 .002 0.221 ± 0.001 C20:4 (lignoceric acid) 0.746 ± 0.003 0.556 ± 0 .004 0.43 0 ± 0.003 0.547 ± 0.0 03 0.443 ± 0.001 0.471 ± 0 .002 0.378 ± 0.002 0.201 ± 0.0 04 0.605 ± 0.001 0.378 ± 0 .001 0.248 ± 0.002 C23:0 (tricosylic acid) 0.671 ± 0.005 0.447 ± 0 .003 0.52 9 ± 0.001 1.248 ± 0.0 01 0.428 ± 0.002 0.575 ± 0 .002 0.555 ± 0.006 0.360 ± 0.0 03 0.624 ± 0.005 0.356 ± 0 .004 0.198 ± 0.001 C22:2 (ci s-13,16-docosa. ac id) 0.824 ± 0.004 0.801 ± 0 .002 0.42 1 ± 0.002 1.033 ± 0.0 01 0.533 ± 0.001 0.353 ± 0 .003 0.526 ± 0.004 0.270 ± 0.0 02 0.327 ± 0.003 0.303 ± 0 .002 0.479 ± 0.004 C20: 5 (ei cosa pentaenoic ac id) 0.891 ± 0.002 0.521 ± 0 .002 0.50 2 ± 0.002 0.720 ± 0.0 03 0.348 ± 0.001 0.579 ± 0 .005 0.456 ± 0.002 0.197 ± 0.0 02 0.387 ± 0.001 0.403 ± 0 .002 0.191 ± 0.002 C24:0 (lignoceric acid) 0.877 ± 0.003 0.530 ± 0 .001 0.51 9 ± 0.004 0.638 ± 0.0 01 0.298 ± 0.001 0.407 ± 0 .003 0.389 ± 0.006 0.168 ± 0.0 01 0.259 ± 0.002 0.231 ± 0 .005 0.244 ± 0.005 C24:1 (nervonic acid) 0.877 ± 0.002 0.448 ± 0 .004 0. 54 0 ± 0.002 0.890 ± 0.0 02 0.402 ± 0.001 0.552 ± 0 .004 0.363 ± 0.002 0.363 ± 0.0 04 0.866 ± 0.006 0.402 ± 0 .0 01 0.188 ± 0.002
2017). Most of these transmittance bands are previously report-ed in the literature (Vlachos et al.2006; Lerma-Garcia et al. 2010; Saucedo-hern et al.2011; Zhang et al. 2012; Wojcicki et al.2015), and here we represent a summary (see Table2).
As long as the spectra in Fig.1were observed carefully, there were less transmittance bands in the region of functional groups (4000–1500 cm−1), but more complicated transmittance profiles in fingerprint region (1500–650 cm−1). In the C−H stretching region differences in intensities of bands at 3006 cm−1(=C–H (cis) stretching), 2953 cm−1(asymmetrical stretching of–C–H (CH3)), 2924 cm−1(asymmetrical stretching of–C–H (CH2)), and 2854 cm−1(symmetrical stretching of–C–H (CH2)) are quite significant. The strong peak at 1746 cm−1originates from the carbonyl (–C=O) stretching vibration, in this case associated with the triglyceride ester linkage, as well as the carboxylic group of free fatty acids. The spectra of fingerprint region pre-sented significant differences due to some peaks, namely at 723 cm−1 associated with –(CH2)nrocking modes, and at 1033 cm−1, 1097 cm−1, 1118 cm−1, 1163 cm−1corresponding to–C–O stretching vibrations, and comprising a feature charac-teristic of the aliphatic esters. Another significant peak, at 1238 cm−1, is found in this case presenting some contribution from CH2bending modes. Finally, in this frequency region (< 1500 cm−1), there are two additional significant peaks that were observed at 1377 cm−1and 1465 cm−1, assigned to the terminal (CH3) groups symmetric bending and the scissoring vibration of the CH2groups, respectively (Gouvinhas et al.2015; Wojcicki et al.2015; Ozulku et al.2017).
The spectra of all studied oils presented in Supplementary Fig. 1a, appeared quite similar, and it was very difficult to differentiate them. Interpretation of the spectral bands pro-vides information about their molecular skeletons and func-tional groups; however, to get information about their purity or adulteration level, band interpretation is not required. Therefore, multivariate classification and regression models by using the full or specific spectral regions were required ( s e e BQ u a l i t a t i v e A n a l y s i s o f A d u l t e r a t i o n^ and BQuantitative Analysis of Cold-Pressed WGO Adulteration^ section). Multivariate data analysis reported in the literature has been widely employed with data from FTIR spectroscopy. Before the chemometric analyses, first derivative Savitzky– Golay smoothing (Supplementary Fig.1b) and SNV pretreat-ments (Supplementary Fig. 1c) were applied to remove unde-sirable factors in the spectral raw data and to accurate the possible baseline shifts and inclusive intensity changes.
Qualitative Analysis of Adulteration
PCA, LDA, and SIMCA Classification Models for Pure Cold-Pressed WGO and Other Pure Vegetable Oils
To visualize the slight intensities between spectral character-istics in the FTIR region, PCA, LDA, and SIMCA
Ta b le 4 (continued ) Fa tty ac ids F att y ac id pr ofi le o f the cold pr esse d W G O s, re fi ned S F O , and S B O samples, g/100 g o f totally fatty acids (%) WGO -1 W GO -2 WGO-3 W G O -4 WG O-5 W GO -6 WGO-7 W G O -8 WGO -9 W GO -10 W GO-11 ∑ SF A 24 .706 23.036 19.1 18 27.458 13 .936 15.782 21.12 20.125 12 .222 14.832 9.712 ∑ MUF A 18 .154 16.423 29.2 8 18.388 29 .255 37. 433 17.42 2 12.247 58 .793 36.613 57.26 1 ∑ PUF A 47 .207 47.405 45.4 37 44.004 50 .47 42.195 53.37 8 56.788 20 .43 44.788 24.38 9 trans F As 3.256 3.565 2.74 9 3.049 2. 149 1.865 1.964 1.882 2.282 1.232 1.685 WGO w h ea t g erm o il, SF A sa tur at ed fa tty ac id ,MU FA monounsaturated fatty acid, PU FA polyuns aturated fatty acid
classification analyses were performed on a matrix consisting of four replications of spectra. A first PCA and SIMCA models were constructed on full region (4000–650 cm−1), functional group region (4000–1500 cm−1), and fingerprint region (1500–650 cm−1) spectral ranges to classify the pure cold-pressed WGO and pure refined vegetable oil samples. Unsupervised multivariate analysis technique, PCA, is gener-ally applied prior to any other more complex classification or prediction methods; in some cases, the single use of PCA scores can classify samples in groups (Gurdeniz et al.2008; Borràs et al.2015). As a powerful tool for transforming large data sets of possibly correlated variables into smaller numbers of uncorrelated variables called principal components (PCs), PCA is suitable for dealing with complex data sets acquired by spectroscopic or other analytical techniques, enabling the dis-crimination of different groups of samples. PCA is used to reduce a large number of interrelated variables into a much smaller number of artificial variables which could retain most of the variance in the data set. Degree of fit (R2) and predictive ability (Q2) statistical parameters are used to assess the obtain-ed model performance. Results of PCA can be presentobtain-ed in two complementary plots as scores and loading plots. The
score plot indicates how the observations are scattered and which of them are clustered to differentiate principal group-ings among observations; in another saying, it presents simi-larities and differences between observations. Loading plots reveal which variables could be related with which groupings and/or correlations among the observations. Therefore, PCA was frequently applied to deal with these complex data sets, leading to quick differentiation of various kinds of vegetable oils and helping us to recognize adulterated oils from pure vegetable oils (Tu et al.2016; Uncu and Ozen 2016). The optimal loadings of the first two PCs obtained by conducting score plots on the full spectral range for discrimination of different brands of pure vegetable oils are presented in Fig.2a. The score plots show that the different types of oils are basically separated, and eigenvalue of 80% was achieved using two PCs (PC1= 52%, PC2= 28%). It can be seen from Fig. 2a that the classification of WGOs and other oils was successfully achieved, especially from OO and HNO samples. Five different brands of WGO have distinctly different loca-tions from other oils; however, six different brands of WGO are located in the same region with sunflower and soybean oils, so that they cannot be distinguished from these oils. The
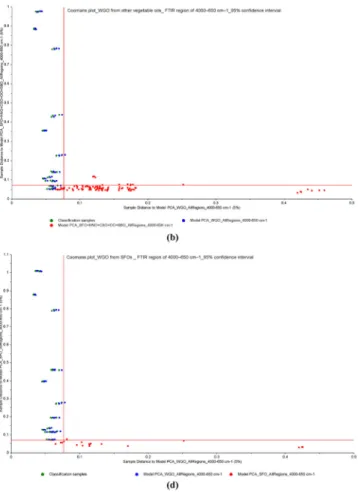
Fig. 2 a Score plots from PCA analysis of FTIR spectra in the wavenumber region of 4000–650 cm−1, b Coomans plots for the classification of cold pressed WGOs and refined SFO samples, c cold pressed WGOs and refined SBO samples, and d cold pressed WGOs and
other refined edible oils from PCA analysis of FTIR spectra in the wavenumber region of 4000–650 cm−1(95% confidence intervals) (WGO wheat germ oil, SBO soybean oil, SFO sunflower oil, CSO cottonseed oil, HNO hazelnut oil, OO olive oil)
discrimination of studied oils in the PCA model could be explained by the differences of their origin (namely trade-marks) and fatty acid compositions. It is well known that WGO is composed of average 60% polyunsaturated (PUFA) and monounsaturated fatty acids (MUFAs) (Eisenmenger and Turgut2008; Ghafoor et al.2017), which are responsible for its value as edible oils, particularly of linoleic acid (17.62– 55.27%, 18:2n–6) followed by oleic acid (10.82–55.47%, 18:1n–9) and high amounts of saturated fatty acids (4.90– 17.01%). Two brands of the WGO samples (WGO–9 and WGO–11) presented different fatty acid composition results. Nine brands of the WGO samples have mainly linolenic acid (ω-6) composition, while two brands of the samples show oleic acid base composition. This result supports the possibil-ity of adulteration for these two oil brands. Also in PCA score plots, these samples showed different placement (see Fig.2). The relative percentages of total saturated (∑SFA), monoun-saturated (∑MUFA), and total polyunmonoun-saturated (∑PUFA) fatty acid contents for studied oils were also calculated (see Tables3 and 4). The fatty acid profiles of studied cold-pressed WGO samples (∑SFA = 9.71–27.46%, ∑MUFA = 12.25–58.79%, ∑PUFA = 20.43–56.79%) were quite similar to refined SBO (∑SFA = 16.18%, ∑MUFA = 32.11%, ∑PUFA = 50.84%), SFO (∑SFA = 10.55%, ∑MUFA =
32.40%, ∑PUFA = 56.01%), or CSO (∑SFA = 25.18%, ∑MUFA = 17.71%, ∑PUFA = 54.50%) samples; despite that they are quite different from refined HNO (∑SFA = 7.32%, ∑MUFA = 78.25%, ∑PUFA = 14.26%) or OO (∑SFA = 7.32%, ∑MUFA = 78.25%, ∑PUFA = 14.26%) samples. These results are in accordance with similar observations re-ported by several researchers (Dubois et al.2007; Zambiazi et al.2007). Thus, despite the fatty acid composition similarity between WGO samples and refined SFO, SBO, and CSO, five brands of WGO can be well discriminated from other oils, especially OO, HNO, and CSO samples.
Coomans plot are also constructed to more clearly visualize the discrimination of pure WGO samples from each type of refined vegetable oils (Fig. 2b–d and Supplementary Fig.2). Coomans plot is an extremely useful tool to imagine principal groupings, in which the two axes correspond to the distance of individual PCA model. To construct Coomans plot, PCA model is performed to each class models separately and two class models are constructed against each other with the critical levels as straight lines displaying the boundaries. In this plot, any sam-ple having a distance to the related centroid greater than the critical distance is accepted as being outside the class model and, therefore, rejected as an outlier for the specific group (Gurdeniz et al.2008; Rohman et al.2014; Borràs et al.2015).
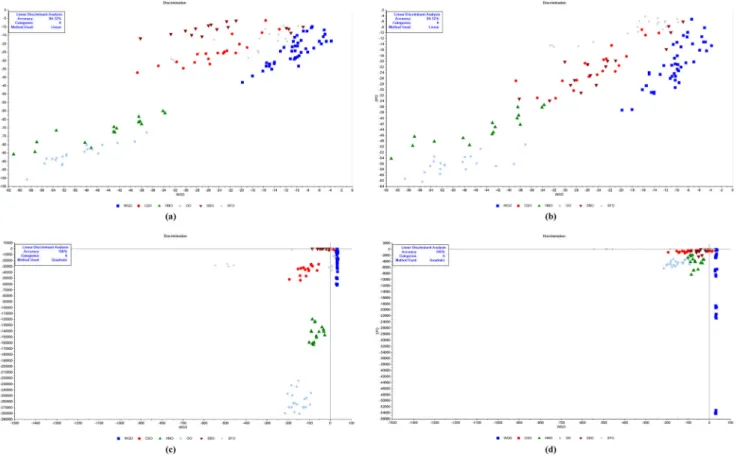
Fig. 3 Linear discriminant analysis of WGO and other refined edible oils, Linear method for a WGO and refined SBO, b WGO and refined SFO, Quadratic method for c WGO and refined SBO, d WGO and refined
SFO, (WGO wheat germ oil, SBO soybean oil, SFO sunflower oil, CSO cottonseed oil, HNO hazelnut oil, OO olive oil)
To achieve the best classification model for discrimination of WGOs from other vegetable oils, SIMCA models were also generated using full spectra and 5% significance level for critical distance (Fig.2b, c and Supplementary Fig.2). The x-axis shows the distance to pure cold-pressed WGO samples, while the y-axis shows the distance to other oil samples. Coomans plot of pure WGOs exhibited quite successful discrimination from pure SBOs, pure CSOs, and pure OOs. This means that no samples were mistakenly classified into the wrong class. In view of these results, the acquisition of spectra from 4000 to 650 cm−1could potentially be useful for the assessment of the WGO adulteration. It is well known that vegetable oils might have quite similar composition; thus, it is often difficult to detect their adultera-tion. However, due to its capability as a fingerprint technique, infrared spectroscopy permits one to differentiate oil types with the spectral changes (Gouvinhas et al.2015; Wojcicki et al.2015; Ozulku et al.2017). The PCA and SIMCA clas-sification models were also performed on functional group region (4000–1500 cm−1) and fingerprint region (1500– 650 cm−1) spectral ranges (Supplementary Fig.3). The ob-served classification ability in the fingerprint region was more efficient than the classification in the functional group region.
According to full spectra region, in the fingerprint area, SFOs, SBOs, and CSOs well discriminated from each other, whereas in the functional grouping classification, WGOs well classi-fied from other oils.
LDA is yet another supervised classification technique in which the number of categories and the samples belonging to each category are previously defined. The criterion of LDA for selection of latent variables maximizes the differences be-tween categories and minimizes the variances within catego-ries (Saucedo-hern et al. 2011; Borràs et al. 2015). LDA models were constructed with six predictors (wheat germ, sunflower, soybean, extra virgin olive, hazelnut, and cotton-seed oils) on simplified data sets. For this purpose, 29 wavenumbers (remarked as nominal frequencies in Table2) were extracted from the FTIR spectrum recorded and ana-lyzed. Figure 3 represents the LDA plots of cold pressed WGOs versus refined SFO and SBO samples using linear and quadratic models. As can be seen from Fig.3, the LDA classification methods provided good results for discrimina-tion of WGO samples from other edible oils. A total of 100% of studied samples were correctly classified on the basis of their origin in calibration and in cross-validation by LDA.
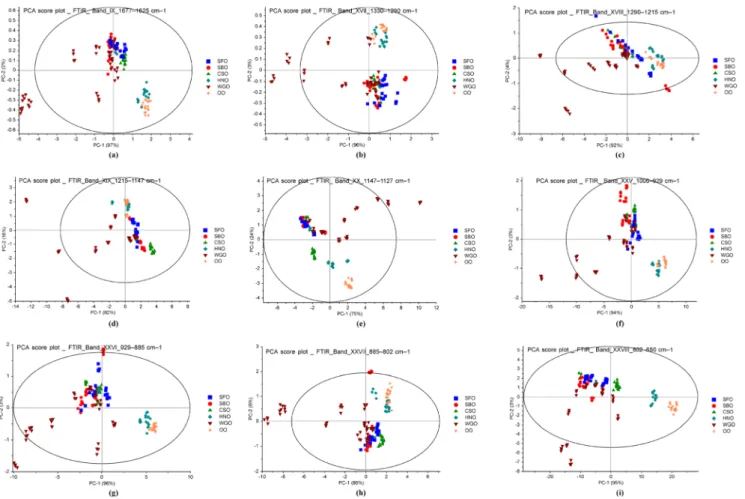
Fig. 4 Score plots from PCA analysis of FTIR spectra in the wavenumber regions of a 1677–1625 cm−1(band_IX), b 1330–1290 cm−1(band_ XVII), c 1290–1215 cm−1(band_XVIII), d 1215–1147 cm−1(band_ XIX), e 1147–1127 cm−1(band_ XX), f 1006–929 cm−1(band_XXV),
g 929–885 cm−1(band_XXVI), h 885–802 cm−1(band_XXVII), and i 802–650 cm−1(band_XXVIII) (WGO wheat germ oil, SBO soybean oil, SFO sunflower oil, CSO cottonseed oil, HNO hazelnut oil, OO olive oil)
In the second part, PCA and SIMCA models were con-structed on 28 different spectral regions according to the dif-ferent transmittance peaks (see Table2). For thoroughly uti-lizing the information of infrared spectra of the studied oil samples, the spectrums were divided into 28 spectral regions for the classification analysis. The PCA and SIMCA models were constructed on the basis of areas of these regions and obtained plots were presented in Fig.4 and Supplementary Fig.4. Based on the optimization process, the wavenumber regions used for PCA are band IX_1677–1625 cm−1(–C=C, cis stretching), band XVII_1330–1290 cm−1 (asymmetric bending of –C–H, CH3), band XVIII_1290–1215 cm−1 (rocking bending of–C–H, cis), band XIX_1215–1147 cm−1 (–C–H, CH2 bending), band XX_1147–1127 cm−1 (–C–O stretching), band XXV_1006–929 cm−1(–HC=CH–, trans bending), band XXVI_929–885 cm−1(–HC=CH–, cis bend-ing), band XXVII_885–802 cm−1(=CH2wagging,−(CH2)n rocking and–HC–CH–, cis bending), and band XXVIII_802– 650 cm−1(bending of C...C and O–H). Higher eigenvalues were obtained in specific spectral regions (Fig.4), thus, it is evident that PCA models provide well classifications of dif-ferent trademarks for vegetable oils, according to their quality and purity. To achieve the best classification model for
discrimination of WGOs from refined SFO and SBO samples, in selected optimum regions, SIMCA models were also gen-erated (Supplementary Fig.5). These models were also devel-oped using 5% significance level for critical distance. From the fatty acid composition data presented above, it can be seen that WGOs have a closer similarity with SBOs and SFOs than other studied vegetable oils. It is clear from Coomans plots for the selected infrared regions that the classes of pure cold-pressed WGOs and refined SFO or SBOs are well separated. Consequently, the classification models constructed here ap-pears to be more efficient in that it can group significantly different trademarks of vegetable oil samples together and discriminate cold pressed WGO from other type of oils.
PCA and SIMCA Classification Models for Pure Cold-Pressed WGO and Binary Blends of WGO
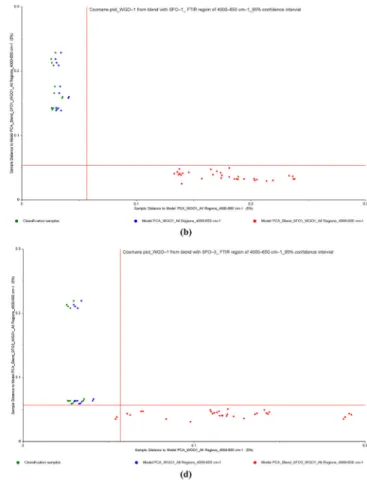
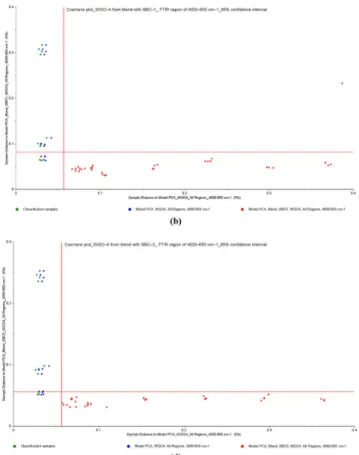
In this part of multivariate data analysis, Coomans plots were constructed on full spectral ranges to visualize the discrimination of adulterated samples (binary mixtures of WGO–SFO and WGO–SBO) from pure WGO samples. Refined SFO and SBO are much less expensive than other refined vegetable oils, and it is currently used as adulterate in high-quality cold-pressed oils,
Fig. 5 Coomans plots for the classification of cold pressed WGO–1 and a adulterated WGO–1 samples with refined SFOs, b adulterated WGO–1 samples with refined SFO–1, c adulterated WGO–1 samples with refined SFO–2 and d adulterated WGO–1 samples with refined SFO–3 from
PCA analysis of FTIR spectra in the wavenumber region of 4000– 650 cm−1(95% confidence intervals) (WGO wheat germ oil, SBO soybean oil, SFO sunflower oil, CSO cottonseed oil, HNO hazelnut oil, OO olive oil)
becoming basically one of the threats of people’s health (Poulli et al.2006; Ge et al.2014; Li et al.2015). From the fatty acid composition data (see Tables3and4), it can be seen that cold-pressed WGOs have closer similarity with refined SFOs and SBOs according to other studied vegetable oils. Due to this sim-ilarity, refined SFO and SBO have a great potential for adultera-tion applicaadultera-tions in pressed WGOs. To that end, pure cold-pressed WGOs and adulterated WGO samples were classified into two groups. Both classes were subjected to PCA, and then Coomans plots were subsequently generated. Figures5and6 reveal the Coomans plots for the classification of WGO–1 from adulterated WGO–1 with refined SFOs (0 to 50%, w/w) and WGO–4 from adulterated WGO–4 with refined SBOs (0 to 50%, w/w), from PCA analyses of spectra in FTIR regions of 4000–650 cm−1, respectively. It is clear from these figures that the excellent discriminations between pure WGOs and their adul-terated samples with refined SFOs and SBOs were achieved. Within the adulterated class, it is noted that the samples containing a higher percentage of adulterants are more inclined toward the right side of the plot, indicating longer distance from the pure WGO sample’s axis. SIMCA models classified 100% of all sam-ples accurately according to its group, meaning that no samsam-ples were mistakenly classified into the wrong group, which could occur sometimes because of the close similarities in fatty acid
composition between groups. In addition to this, the classification limits of refined SFOs and SBOs adulterated in WGOs were below 1%, which is quite lower than the classification limits re-ported in literature (Lerma-Garcia et al.2010; Rohman and Ariani 2013; Gouvinhas et al.2015; Li et al.2015; Wojcicki et al.2015). Based on full region of spectral data, SIMCA analyses were also performed to discriminate WGO–2, 3, and 4 from their adulterated samples with SFOs (Supplementary Fig.6–8) and, WGO–1, 2, and 3 from their adulterated samples with SBOs (Supplementary Fig. 9–11), respectively. The plots are ex-plained that two groups of pure WGO samples and their blends are well classified, with each group located closer to their re-spective axis. In these models, there is no misgrouping resulted between two classes during discrimination analysis. Therefore, the spectral data of full region (4000–650 cm−1) could consid-erably be valuable for the estimation of WGO adulterations.
Quantitative Analysis of Cold-Pressed WGO
Adulteration
Quantification of the adulterant in binary blends of cold-pressed WGO adulterated with SFO or SBO was performed using PLSR multivariate data analysis. PLSR models, mainly applied for prediction, offer enhanced results compared to
Fig. 6 Coomans plots for the classification of cold pressed WGO–4 and a adulterated WGO–4 samples with refined SBOs, b adulterated WGO–4 samples with refined SBO–1, c adulterated WGO–4 samples with refined SBO–2 and d adulterated WGO–4 samples with refined SBO–3 from
PCA analysis of FTIR spectra in the wavenumber region of 4000– 650 cm−1(95% confidence intervals) (WGO wheat germ oil, SBO soybean oil, SFO sunflower oil, CSO cottonseed oil, HNO hazelnut oil, OO olive oil)
other regression methods for quantitative analysis of chemical parameters (Borràs et al.2015; Gouvinhas et al.2015). The samples of all adulterated and pure WGOs were randomly divided into calibration and validation sets. To establish pre-diction models, two sets of binary mixtures were prepared: cold-pressed WGO with refined SFO and cold-pressed WGO with refined SBO were prepared by adding to WGO the adulterant, SFO or SBO, respectively, ranging from 0 to 50%. For the calibration of total saturated and unsaturated fatty acids, spectral profiles in the region of 4000–650 cm−1 gave the best cross-validated calibration model and provided also the best prediction of the unknown samples. The statistic results of PLSR of calibration and validation sets are given in Table5. The quality of the fitting was analyzed by the root mean square error of calibration (RMSEC), multiple coeffi-cients of determination or regression coefficient (R2), and by the root mean square error of cross validation (RMSECV). To validate the developed PLSR model, leave-one-out
cross-validation method was applied. It is well known that high R2 values and low RMSEC and RMSECV values demonstrate high predictive ability of each model.
As it can be seen from Table5, high linearity values were obtained in the plots of predicted versus reference values. The slope values were close to 1 and R2values were at least 0.9431 and 0.9260 for binary mixtures of WGO–SFO and WGO– SBO sets, respectively. The prediction parameters for the bi-nary mixtures of WGO–SFO sets were as follows: RMSEC were in the range 0.56–1.98% and RMSECV in the range 0.68–4.46%. The parameters for the binary mixtures of WGO–SBO sets were as follows: RMSEC were in the range 0.99–1.77% and RMSECV in the range 1.09–5.12%. For all of the PLSR models, the differences between RMSEC and RMSECV values were insignificant, indicating that both the calibration and validation sets. FTIR spectroscopy with mul-tivariate regression technique, PLSR, allowed rapid detections of refined SFOs and SBOs in cold-pressed WGOs. On the
Table 5 Calibration and validation results of the PLSR models for the mixtures of refined sunflower oil and refined soybean oil in cold-pressed wheat germ oil at full wavenumber region of 4000–650 cm−1
PLSR model calibration and validation results for the mixtures of refined SFOs and SBOs in cold-pressed WGOs at FTIR region of 4000–650 cm−1 Calibration set Validation set
Synthetic oil blends Number of samples Slope Offset RMSEC R-Square Slope Offset RMSECV R-Square SFO-1 (0–50%) WGO-1 9 0.9968 0.0559 0.9872 0.9968 0.9472 0.9421 2.0080 0.9891 WGO-2 9 0.9872 0.2253 1.9823 0.9823 0.9753 0.5010 2.1772 0.9864 WGO-3 9 0.9919 0.1421 1.5741 0.9919 0.8566 2.5933 4.4607 0.9431 WGO-4 9 0.9940 0.1046 1.3508 0.9940 0.9863 0.1995 1.8221 0.9910 SFO-2 (0–50%) WGO-1 9 0.9952 0.0834 1.2065 0.9932 0.9899 0.1817 1.4701 0.9932 WGO-2 9 0.9990 0.0177 0.5550 0.9990 0.9949 0.0749 0.6758 0.9987 WGO-3 9 0.9928 0.1271 1.4894 0.9928 0.9274 1.2224 3.0522 0.9691 WGO-4 9 0.9901 0.1740 1.7420 0.9901 0.9899 0.2012 2.2180 0.9855 SFO-3 (0–50%) WGO-1 9 0.9964 0.0628 1.0463 0.9964 0.9909 0.1484 1.2534 0.9946 WGO-2 9 0.9967 0.0577 1.0035 0.9967 0.9799 0.3569 1.6457 0.9921 WGO-3 9 0.9955 0.0784 1.1693 0.9955 0.9309 1.1669 2.6293 0.9790 WGO-4 9 0.9949 0.0895 1.2495 0.9949 0.9892 0.1727 1.4205 0.9935 SBO-1 (0–50%) WGO-1 9 0.9939 0.1076 1.3700 0.9939 0.9794 0.4096 1.7217 0.9910 WGO-2 9 0.9934 0.1154 1.4190 0.9934 0.9288 1.3785 2.1871 0.9861 WGO-3 9 0.9944 0.0976 1.3048 0.9944 0.9482 0.9686 2.3097 0.9846 WGO-4 9 0.9897 0.1802 1.7732 0.9897 1.0172 −0.9809 2.5991 0.9821 SBO-2 (0–50%) WGO-1 9 0.9934 0.1152 1.4173 0.9934 0.9725 0.4487 2.0615 0.9867 WGO-2 9 0.9968 0.0562 0.9912 0.9968 0.8951 1.9130 5.1213 0.9260 WGO-3 9 0.9962 0.0664 1.0766 0.9962 0.9121 1.3971 3.5018 0.9611 WGO-4 9 0.9928 0.1261 1.4833 0.9928 0.9907 0.1101 1.7777 0.9895 SBO-3 (0–50%) WGO-1 9 0.9967 0.0575 1.0013 0.9967 0.9931 0.0979 1.0884 0.9961 WGO-2 9 0.9959 0.0723 1.1226 0.9959 0.9221 1.5068 2.3656 0.9838 WGO-3 9 0.9911 0.1570 1.6549 0.9911 0.9239 1.3889 2.8220 0.9775 WGO-4 9 0.9922 0.1365 1.5430 0.9922 0.9858 0.3134 1.7454 0.9887 WGO wheat germ oil, SFO sunflower oil, SBO soybean oil, RMSEC root mean square error of calibration, RMSECV root mean square error of cross validation
basis of the PLSR models developed, quantification of SFO and SBO adulterants could be determined at levels < 0.56% and < 0.99%, respectively. PLSR using the minimization of RMSEC with respect to full spectral ranges in all cases result-ed in high R2values (> 0.9990 for WGO–SFO sets and > 0.9968 for WGO–SBO sets), and hence could be used to quantify the content of refined vegetable oils in cold-pressed WGOs. Therefore, we conclude that ATR–FTIR coupled with chemometric regression methods, PLSR, are very powerful tools for detecting cold-pressed WGO adulteration with re-fined vegetable oils at low adulteration levels.
Conclusion
Rapid, effective, non-destructive, low cost, and less time-consuming qualification and quantification methods for detect-ing cold-pressed WGO adulteration were presented based on the combination of ATR–FTIR spectroscopy with multivariate data analyses. The results of this study showed that despite the fatty acid composition similarities, pure cold-pressed WGO samples could be well discriminated from other refined edible oils. By using the data of full and optimal infrared wavenumber regions, the studied oil samples from different brands and ori-gins were correctly classified with an excellent resolution among the categories. SIMCA models of FTIR data also pro-vided excellent classification for pure cold-pressed WGO and refined edible oil samples, with 95% significance level. A total of 100% of studied samples were correctly classified on the basis of their origin in calibration and in cross-validation by LDA models. Furthermore, the classification limits of refined SFO and SBO adulteration in WGO were below 1%. Under the optimum conditions, the proposed PLSR models are highly linear (R2values > 0.9990 for WGO–SFO sets and > 0.9968 for WGO–SBO sets). SIMCA analysis classified well the 100% edible oils. Besides, the content of refined oils as an adulterant in blends has been successively quantified using PLSR, hence could be used to quantify the contents of SFO and SBO adulterants at levels < 0.56% and < 0.99%, respec-tively, in an unknown mixture. Therefore, ATR–FTIR spectros-copy overcomes many of the disadvantages of the wet-chemical and time-consuming techniques and its application can be considered asBgreen analytical chemistry^ because this technique eliminated the use of hazardous chemicals.
Funding The present study is a part of the master thesis entitled BDevelopment of chromatographic and molecular spectroscopic multi-variate chemometric models for the determination of cold pressed wheat germ oil adulteration with refined vegetable oils.^ This study is supported financially by the Scientific Research Project Center of Karamanoglu Mehmetbey University (Project number 18-M-17). The authors would also like to thank TUBITAK under the 2219–Research Fellowship Program for International Postdoctoral for providing the financial support to carry out this research work.
Compliance with Ethical Standards
Conflict of Interest Fatma Nur Arslan declares that she has no conflict of interest. Fethi Çağlar declares that he has no conflict of interest. Ethical Approval All procedures performed in studies involving human participants were in accordance with the ethical standards of the institu-tional and/or nainstitu-tional research committee and with the 1964 Helsinki Declaration and its later amendments or comparable ethical standards. Informed Consent Informed consent was obtained from all individual participants included in the study.
References
Arshad MS, Anjum FM, Khan MI, Shahid M (2013) Wheat germ oil and α-lipoic acid predominantly improve the lipid profile of broiler meat. J Agric Food Chem 61(46):11158–11165.https://doi.org/10. 1021/jf4041029
Arslan FN, Sapci AN, Duru F, Kara H (2017) A study on monitoring of frying performance and oxidative stability of cottonseed and palm oil blends in comparison with original oils. Int J Food Prop 20(3): 704–717.https://doi.org/10.1080/10942912.2016.1177544
Borràs E, Ferré J, Boqué R, Mestres M, Aceña L, Busto O (2015) Data fusion methodologies for food and beverage authentication and quality assessment—a review. Anal Chim Acta 891:1–14.https:// doi.org/10.1016/j.aca.2015.04.042
Che Man YB, Abidin SZ, Rohman A (2011) Discriminant analysis of selected edible fats and oils and those in biscuit formulation using FTIR spectroscopy. Food Anal Methods 4:404–409.https://doi.org/ 10.1007/s12161-010-9184-y
De-Hua D, Xu L, Ye Z-H, Cui H-F, Cai C-B, Yu X-P (2012) FTIR spectroscopy and Chemometric class modeling techniques for au-thentication of Chinese sesame oil. J Am Oil Chem Soc 89:1003– 1009.https://doi.org/10.1007/s11746-011-2004-8
Dominguez-vidal A, Pantoja-de J, Cuadros-rodríguez L, Ayora-cañada MJ (2016) Authentication of canned fish packing oils by means of Fourier transform infrared spectroscopy. Food Chem 190:122–127.
https://doi.org/10.1016/j.foodchem.2015.05.064
Dubois V, Breton S, Linder M, Fanni J, Parmentier M (2007) Fatty acid profiles of 80 vegetable oils with regard to their nutritional potential. Eur J Lipid Sci Technol 109:710–732.https://doi.org/10.1002/ejlt. 200700040
Eisenmenger M, Turgut EN (2008) Bioactive components of commercial and supercritical carbon dioxide processed wheat germ oil. J Am Oil Chem Soc 85:55–61.https://doi.org/10.1007/s11746-007-1163-0
Ge F, Chen C, Liu D, Zhao S (2014) Rapid quantitative determination of walnut oil adulteration with sunflower oil using fluorescence spec-troscopy. Food Anal Methods 7:146–150.https://doi.org/10.1007/ s12161-013-9610-z
Ghafoor K, Ozcan MM, AL-Juhaımı F, Babıker EE, Sarker ZI, Ahmed IAM, Ahmed MA (2017) Nutritional composition , extraction , and utilization of wheat germ oil: a review. Eur J Lipid Sci Technol 119: 1600160–1600169.https://doi.org/10.1002/ejlt.201600160
Gouvinhas I, De AJMMM, Carvalho T, Machado N, AIRNAs B (2015) Discrimination and characterisation of extra virgin olive oils from three cultivars in different maturation stages using Fourier transform infrared spectroscopy in tandem with chemometrics. Food Chem 174:226–232.https://doi.org/10.1016/j.foodchem.2014.11.037
Gurdeniz G, Ozen B, Tokatli F (2008) Classification of Turkish olive oils with respect to cultivar, geographic origin and harvest year, using fatty acid profile and mid-IR spectroscopy. Eur Food Res Technol 227:1275–1281.https://doi.org/10.1007/s00217-008-0845-7
Jawaid S, Talpur FN, Sherazi STH, Nizamani SM, Khaskheli AA (2013) Rapid detection of melamine adulteration in dairy milk by SB-ATR—Fourier transform infrared spectroscopy. Food Chem 141: 3066–3071.https://doi.org/10.1016/j.foodchem.2013.05.106
Jovic O, Smolic T, Hrenar T, Hrenar T (2016) Spectroscopic and chemo-metric analysis of binary and ternary edible oil mixtures: qualitative and quantitative study. Anal Chem 88:4516–4524.https://doi.org/ 10.1021/acs.analchem.6b00505
Karabacak M, Kanbur M, Eraslan G, Sarıca Soyer Z (2011) The antiox-idant effect of wheat germ oil on subchronic coumaphos exposure in mice. Ecotoxicol Environ Saf 74:2119–2125.https://doi.org/10. 1016/j.ecoenv.2011.07.002
Karadeniz M, Sahin S, Sumnu G (2018) Enhancement of storage stability of wheat germ oil by encapsulation. Ind Crop Prod 114:14–18.
https://doi.org/10.1016/j.indcrop.2018.01.068
Lerma-Garcia MJ, Ramis-ramos G, Martinez-Tellez JJ, Simo-Alfonso (2010) Authentication of extra virgin olive oils by Fourier-transform infrared spectroscopy. Food Chem 118:78–83.https:// doi.org/10.1016/j.foodchem.2009.04.092
Li B, Wang H, Zhao Q, Ouyang J, Wu Y (2015) Rapid detection of authenticity and adulteration of walnut oil by FTIR and fluorescence spectroscopy: a comparative study. Food Chem 181:25–30.https:// doi.org/10.1016/j.foodchem.2015.02.079
Li B, Chen H, Sun D, Deng B, Xu B, Dong Y, Li J, Wang F, Liu Y (2016) Effect of flameless catalytic infrared treatment on rancidity and bio-active compounds in wheat germ. RSC Adv 6:37265–37273. 10.1039/C5RA23335F
Lohumi S, Lee S, Lee H, Cho B (2015) A review of vibrational spectro-scopic techniques for the detection of food authenticity and adulter-ation. Trends Food Sci Technol 46:85–98.https://doi.org/10.1016/j. tifs.2015.08.003
Marikkar JMN, Mirghani MES, Jaswir I (2016) Application of chromato-graphic and infra-red spectroscopic techniques for detection of adul-teration in food lipids: a review. J Food Chem Nanotechnol 32–41.
https://doi.org/10.17756/jfcn.2016-008
Mateo CM, Nolasco SM, Magari M (2015) Kinetics of tocopherol deg-radation during the storage of wheat germ oil. Can J Chem Eng 93: 1999–2004.https://doi.org/10.1002/cjce.22316
Ozulku G, Yildirim RM, Toker OS, Karasu S, Durak MZ (2017) Rapid detection of adulteration of cold pressed sesame oil adultered with hazelnut, canola, and sunflower oils using ATR-FTIR spectroscopy combined with chemometric. Food Control 82:212–216.https://doi. org/10.1016/j.foodcont.2017.06.034
Parker T, Adams D, Zhou K, Harris M, Yu L (2003) Fatty acid composition and oxidative stability of cold-pressed edible seed oils. Food Chem 68:1240–1243.https://doi.org/10.1111/j.1365-2621.2003.tb09632.x
Poulli KI, Mousdis GA, Georgiou C (2006) Synchronous fluorescence spectroscopy for quantitative determination of virgin olive oil adul-teration with sunflower oil. Anal Biochem 386:1571–1575.https:// doi.org/10.1007/s00216-006-0729-2
Ramadan MF (2013) Healthy blends of high linoleic sunflower oil with selected cold pressed oils: functionality , stability and antioxidative characteristics. Ind Crop Prod 43:65–72.https://doi.org/10.1016/j. indcrop.2012.07.013
Rohman A, Ariani R (2013) Authentication of Nigella sativa seed oil in binary and ternary mixtures with corn oil and soybean oil using FTIR spectroscopy coupled with partial least square. The Sci World J ID 740142:1–6.https://doi.org/10.1155/2013/740142
Rohman A, Che Man YB (2010) Fourier transform infrared (FTIR) spec-troscopy for analysis of extra virgin olive oil adulterated with palm oil. Food Res Int 43:886–892.https://doi.org/10.1016/j.foodres. 2009.12.006
Rohman A, Man YBC (2011) Potential use of FTIR-ATR spectroscopic method for determination of virgin coconut oil and extra virgin olive oil in ternary mixture systems. Food Anal Methods 4:155–162.
https://doi.org/10.1007/s12161-010-9156-2
Rohman A, Che YB, Ismail A, Hashim P (2010) Application of FTIR spectroscopy for the determination of virgin coconut oil in binary mixtures with olive oil and palm oil. J Am Oil Chem Soc 87:601– 606.https://doi.org/10.1007/s11746-009-1536-7
Rohman A, Erwanto Y, Che YB (2011) Analysis of pork adulteration in beef meatball using Fourier transform infrared (FTIR) spectroscopy. Meat Sci 88:91–95.https://doi.org/10.1016/j.meatsci.2010.12.007
Rohman A, Man YBC, Yusof FM (2014) The use of FTIR spectroscopy and chemometrics for rapid authentication of extra virgin olive oil. J Am Oil Chem Soc 91:207–213. https://doi.org/10.1007/s11746-013-2370-5
Saucedo-hern Y, Jes M, Herrero-martínez M, Ramis-Ramos G, Jorge-Rodríguez E, Simó-Alfonso EF (2011) Classification of pumpkin seed oils according to their species and genetic variety by attenuated total reflection Fourier-transform infrared spectroscopy. J Agric Food Chem 59:4125–4129.https://doi.org/10.1021/jf104278g
Savitzky A, Golay MJE (1964) Smoothing and differentiation of data by simplified least squares procedures. Anal Chem 36:1627–1639.
https://doi.org/10.1021/ac60214a047
Sujka K, Koczoń P, Ceglińska A, Reder M, Ciemniewska-Żytkiewicz H (2017) The application of FT-IR spectroscopy for quality control of flours obtained from polish producers. J Anal Methods Chem ID 4315678:1–9.https://doi.org/10.1155/2017/4315678
Syahariza ZA, Che Man YB, Selamat J, Bakar J (2005) Detection of lard adulteration in cake formulation by Fourier transform infrared (FTIR) spectroscopy. Food Chem 92:365–371.https://doi.org/10. 1016/j.foodchem.2004.10.039
Teresa M, Koidis A, Jim AM, Gonz A (2017) Chemometric classification and quanti fi cation of olive oil in blends with any edible vegetable oils using FTIR-ATR and Raman spectroscopy. LWT - Food Sci Technol 86:174–184
Tu A, Du Z, Qu S (2016) Rapid profiling of triacylglycerols for identify-ing authenticity of edible oils usidentify-ing supercritical fluid chromatography-quadruple time-of-flight mass spectrometry com-bined with chemometric tools. Anal Methods 8:4226–4238.https:// doi.org/10.1039/C6AY00970K
Uncu O, Ozen B (2016) Geographical differentiation of a monovarietal olive oil using various chemical parameters and mid-infrared spec-troscopy. Anal Methods 8:4872–4880.https://doi.org/10.1039/ C6AY01290F
Vlachos N, Skopelitis Y, Psaroudaki M, Konstantinidou V, Chatzilazarou A, Tegou E (2006) Applications of Fourier transform-infrared spec-troscopy to edible oils. Anal Chim Acta 574:459–465.https://doi. org/10.1016/j.aca.2006.05.034
Wojcicki K, Khmelinskii I, Sikorski M, Caponio F, Paradiso VM, Summo C, Pasqualone A, Sikorska E (2015) Spectroscopic tech-niques and chemometrics in analysis of blends of extra virgin with refined and mild deodorized olive oils. Eur J Lipid Sci Technol 117: 92–102.https://doi.org/10.1002/ejlt.201300402
Yazicioglu B, Sahin S, Sumnu G (2015) Microencapsulation of wheat germ oil. J Food Sci Technol 52:3590–3597.https://doi.org/10. 1007/s13197-014-1428-1
Yu LL, Zhou KK, Parry J (2005) Antioxidant properties of cold-pressed black caraway, carrot, cranberry, and hemp seed oils. Food Chem 91:723–729.https://doi.org/10.1016/j.foodchem.2004.06.044
Zambiazi RC, Przybylski R, Zambiazi MW, Mendonça CB (2007) Fatty acid composition of vegetable oils and fats. Curitiba 25:111–120.
https://doi.org/10.5380/cep.v25i1.8399
Zhang Q, Liu C, Sun Z, Hu X, Shen Q, Wu J (2012) Authentication of edible vegetable oils adulterated with used frying oil by Fourier transform infrared spectroscopy. Food Chem 132:1607–1613.
https://doi.org/10.1016/j.foodchem.2011.11.129
Zou Y, Gao Y, He H, Yang T (2018) Effect of roasting on physico-chemical properties , antioxidant capacity , and oxidative stability of wheat germ oil. LWT - Food Sci Technol 90:246–253.https://doi. org/10.1016/j.lwt.2017.12.038