THE IMPACT OF FLAT TAX RATES ON FOREIGN DIRECT
INVESTMENT
1*
DÜZ ORANLI VERGİLERİN DOĞRUDAN YABANCI YATIRIMLAR
ÜZERİNDEKİ ETKİSİ
Berna HIzARCI BEŞER2** Mustafa Kemal BEŞER3
***
Abstract
Main aim of this paper is to investigate the effect of corporate income tax rates on foreign direct investment (FDI) in the countries which has flat tax application in the pattern of long-run relationship of FDI and its determinants which are known as market size, labor cost, trade barrier, growth rate, openness, trade deficit, and tax rates. For the empirical analysis we use annual data for 1990-2014 for the countries which have applied flat tax reforms and smaller corporate income tax rates in order to focus and draw out the effect of tax rate instrument on capital movements in the point of tax competition. According to panel regression and cointegration results, corporate tax rate has significant and negative impact on FDI.
Keywords: Flat Tax, Tax Competition, Foreign Direct Investment JEL Classification: H20, F21
Özet
Bu çalışmanın amacı doğrudan yabancı yatırımlar (DYY) ile piyasa büyüklüğü, işgücü maliyeti, ticari engeller, ekonomik büyüme, dışa açıklık, ticari açık ve vergi oranları gibi belirleyicileri arasındaki uzun dönemli ilişkide düz oranlı vergi uygulamasına sahip ülkelerde kurumlar vergisinin DYY üzerindeki etkisini ortaya koymaktır. Ampirik analizde vergi rekabeti açısından vergi oranları aracının sermaye hareketliliği üzerindeki etkisine odaklanabilmek ve bu etkiyi ortaya çıkartabilmek için düz oranlı vergi reformu uygulayan ve daha düşük kurumlar vergisi oranına sahip ülkelere ait 1990-2014 arası yıllık veriler kullanılmıştır. Panel regresyon ve ortak bütünleme sonuçlarına göre kurumlar vergisinin DYY üzerinde anlamlı bir negatif etkisinin bulunduğu ortaya konmuştur.
Anahtar Kelimeler: Düz Oranlı Vergi, Vergi Rekabeti, Doğrudan Yabancı Yatırımlar JEL Sınıflandırması: H20, F21
* Authors thank to 20th EBES and ECOEI2 participants for their valuable contributions.
** Dr. Ögr. Üy., Dumlupınar Üniversitesi, İİBF, Maliye Bölümü, Orcıd No: 0000-0002-2957-5030 [email protected] *** Prof. Dr., Eskişehir Osmangazi Üniversitesi, İİBF, İktisat Bölümü, Orcıd No:0000-0002-9988-1965 [email protected]
1. Introduction
Policy makers and governments have widely interested in the importance of taxes on foreign source income. It is a well-known statement that reduced tax rates play a significant role in attracting foreign investors which makes the tax rate potential determinant of foreign direct investment (FDI) as others which are known as; market size, labor cost, trade barrier, growth rate, openness, and trade deficit. The effect of those potentials on FDI are handled in many studies1.
Although very few studies point out the importance of the corporate income tax (CIT) rates on FDI, where reforms of flattening income taxes come into prominence. Therefore the flat tax reforms lead an important role in economic success of capital movements.
However a trade-off between tax revenues and FDI is in two main questions for policy makers and governments. Does tax rate reduction lead investors by acting as an effective incentive to make the decision where to invest? Does it make an erosion in tax revenues for governments? It is necessary to carry out the effect of flattening and tax rate reduction on FDI for the first question where it places the main hypothesis for this study. And for the second, the relation between tax revenues and FDI is out of interest for this concept.
According to Paulus and Peichl, (2008)2, the term “flat tax” is a reform of tax base where all
taxpayers pay taxes at the same percentage rate of their total income and one single tax rate applied to a broad tax base without allowing for any allowances or deductions. It is first discussed by Hall and Rabushka in their studies in 19833 and 19854. In recent studies such as Sarısoy and
Koç (2010)5, it is pointed out that it has been acted as an incentive which is offered by host
government allowing an investor to keep a larger portion of profit.
It reduces two burden. One is the extent of operations and the second is CIT which is directly related with the total cost entry for investors and firms. Thus it becomes as an important instrument for governments in order to attract foreign capital. Therefore they have a tendency to remove the restrictions on operations of foreign firms and reduce CIT in host countries. This tendency sometimes resulted in a flat tax reform.
This paper surveys the impact of flat tax applications on FDI in the concept of fiscal competition which attempts to carry out the sensitivity of FDI inflows in flattened tax rated countries. The paper is organized as follows. In Section 2 we provide a brief information about the relation between FDI and tax rates. We define flat taxes and summarize recent experiences in several countries which had flat tax reforms by corresponding the relationship between tax policies and
1 A literature survey of the effect of potential determinants on FDI is handled in Chakrabati (2001).
2 Paulus, A., Peichl, A. (2008). Effects of Flat Tax Reforms in Western Europe on Equity and Efficiency, ISER Discussion Paper, 2008-06.
3 Hall, R.E., Rabushka, A. (1983). Low Tax, Simple Tax, Flat Tax, McGraw-Hill, New York. 4 Hall, R.E., Rabushka, A. (1985). The Flat Tax, Stanford, Calif., Hoover Institution Press.
5 Sarısoy, İ., Koç, S. (2010). Doğrudan Yabancı Sermaye Yatırımlarının Kurumlar Vergisi Gelirleri Üzerindeki Etkisinin Ekonometrik Analizi, Erciyes Üniversitesi İİBF Dergisi, 36: 133-153.
FDI in the concept of tax competition. Section 3 empirically examines the effect of tax rates on FDI through the channel of flat corporate tax rates. Section 4 sets out the main conclusions.
2. The Economics of FDI and Tax Competition
Globalization has had a positive impact on competition among governments in order to attract foreign investors and foreign capital which became extremely mobile across national borders. According to the common definition of FDI, it is a major source of external capital which made to acquire permanent interest in organizations created for business functioning or working outside of the economy beyond national borders of the investor.
The literature has traditionally focused on the instruments which has directly effects on FDI. Especially Chakrabati’s survey in 20016 came into prominence which focused on the most
important determinants of FDI such as Market Size, Labor Cost, Trade Barrier, Growth Rate, Openness, Trade Deficit, Exchange Rate and Tax Rates. The expectation is a negative sign for the tax rates and when we focus on the literature we see many studies with the expected sign. However a few studies such as Swenson (1994)7 found a positive relationship between tax rates
and FDI opposite to the expectation which means that flat tax reforms are adopted as a barrier for taxpayers not to move their funds out of the country. And some of a few such as Porcano and Price (1996)8, Ning and Reed (1995)9, found insignificant coefficients between FDI and tax rate
which point out that tax rates have no effect on foreign capital.
According to the economic expectation with the support of general standpoint of many existing studies in the literature tax policy becomes a very important and efficient instrument in competing among governments. There are two options to reduce high corporate tax rates to more competitive levels. One is a local approach which is giving tax incentives offered by host governments to a selected group of firms. The other is to change CIT to a lower and effective rate for all firms. From a general point of view, a low corporate tax rate acts as an incentive. Both personal income taxation (PIT) and CIT are not only important income sources of governments, but also important instruments against economic instability10.
Capital movements can be considered in two main headlines which are direct and indirect investments. Direct investment is an investment in a different from the investor’s country such as
6 Chakrabarti, A. (2001). The Determinants of Foreign Direct Investment: Sensitivity Analyses of Cross-Country Regressions, KYKLOS, 54(1): 89–114.
7 Swenson, D.L. (2004). The Impact of U.S. Tax Reform on Foreign Direct Investment in the United States, Journal of Public Economics, 54(2): 243-266.
8 Porcano, T.M., Price, C.E. (1996). The Effects of Government Tax and Nontax Incentives on Foreign Direct Investment, Multinational Business Review, 4(1): 9-20.
9 Ning, Y., Reed, M.R. (1995). Locational Determinants of U.S. Direct Foreign Investment in Food and Kindered Products, Agrobusiness, 11(1): 77- 85.
10 Saygın, Ö., (2013). Gelir Vergisi Tarifesinin Esneklik Analizi: Türkiye Üzerine Bir Değerlendirme, Vergi Sorunları Dergisi, 301: 175-186.
a built factory by a company in another nation. The investor owns the particular assets. Indirect investments are those such as portfolio investments where investor buy or sell assets in another nation as an individual purchases.
Competition to attract capital or to keep it from fleeing is one of the main reasons why governments tend to make very sensitive adjustments on tax rates, especially on corporate tax. Although reduced tax rates attract foreign capital to host country, meanwhile it lead an erosion in tax revenues11. Because of the trade-off among foreign direct investment and tax revenues,
governments sit on pins and needles. This is why average corporate tax rate in developed nations has dropped since 1980 to reduce tax burden on saving and investment. The tendency on reduction of the restrictions on operations of foreign firms and reducing CIT supply governments to necessitate application of flat tax reforms as an efficient instrument.
Main advantages of flat tax reforms from the point of view of foreign and/or domestic investors can be summarized as follows; first, flat taxes can enhance labor supply incentives and productivity. The efficiency of the application depend on the chosen flat tax rates and underlying income distribution. This is for domestic purposes. Secondly, flat tax can increase tax compliance. This addresses to both domestic and foreign investors. Thirdly, flattening tax rates makes both PIT and CIT simpler, easier and transparent to understand for both a single taxpayer and also at the aggregated level because flattening of the rates for different kinds of taxes, usually means creating a single rate for tax on corporate income and personal income.
The types of flat tax is considered in four categories. The two of them are related with the single rate. First kind of single rate is without a basic allowance where the second with a basic allowance. Third one is related with the business income on cash-flow basis. And the fourth is again a single rate with a refundable tax credit. Foreign source income can be taxed in two scheme which are territorial and residence taxations. In the territorial system, the rules are determined where the company pays tax on income made in the country which means that the company pays no home country taxes. France, Hong Kong, Panama, Costa Rica, Paraguay, Uruguay, Singapore and Malaysia are the countries with territorial system for CIT but not for PIT. However, Thailand apply this system for PIT not for CIT. If the CIT rate increases in a country, then MNCs move their income to another country in order to avoid paying higher CIT rate in this approach. Residence taxation is based on the location of corporate residence rather than profits. In the residence taxation system, the company does pay home country taxes12.
According to Desai, Foley, Hines (2004), higher tax rates have an erosion effect on FDI in three ways13. The first effect is reduction of the scale of local business activity by increasing total costs
which conduct to a decrease in the level of production. If the domestic costs faced by the investor 11 Ferhatoğlu, E. (2006). Avrupa’da Düz Oranlı Vergi Sistemi Çalışmaları ve Başarısı, Vergi Dünyası, 25(298): 170-176. 12 Boskin, M.J., William G.G. (1987). New Results on the Effects of Tax Policy on the International Location of
Investment. The Effects of Taxation on Capital Accumulation, Ed: M. Feldstein, Univ. of Chicago Press, Chicago. 13 Desai, M.A. et al (2004). Foreign Direct Investment in a World of Multiple Taxes, Journal of Public Economics,
are higher than the host countries’ costs, then then host country becomes an attractive location for foreign investors. However it will be resulted opposite if the balance of local and foreign factor and output price changes will affect the profitability of FDI. The second is changing the capital and labor balance of production. Reducing the capital intensity, promotes companies prefer inputs such as labor in order to substitute away from capital inputs. The third is by encouraging the relocation of assets from the countries which have higher tax rates to the lower tax rated countries. Thus reduced CIT rates catch FDI in part.
Estonia and Lithuania are first two countries which introduced their flat tax reforms in 1994 at rates of 26 and 33 percent respectively. Their highest of the marginal rates imposed before the application were 33 percent for PIT and 35 percent for Estonia and 29 percent for Lithuania. The rates have been lowered step by step and now set at 20 percent for both PIT and CIT in Estonia and 15 percent in Lithuania. Thus, revenues originated from both PIT and CIT had some negative responses with movement to the flat tax and revenue from the PIT rose in Lithuania. Latvia and Russia introduced their flat tax reforms in 1997 and 2001 respectively. Especially Latvia had degressive rates from 25 percent to 10 percent. CIT was at 25 percent prior to reform. Surprisingly, Russia increased its CIT from 20 percent to 35 percent after reform. CIT now set at 15 percent in Latvia and 20 percent in Russia. In 2001, Slovakia and Ukraine unified their marginal rates of PIT with a starting marginal rate of 12 percent followed by a marginal rate of 20, 37 and 40 percent on the highest incomes at 19 percent in Slovakia and 13 percent in Ukraine. The maximum rate of CIT, reduced from 25 to 19 percent, and from 30 to 25 percent after movement to flat tax regime. And the CIT rates set at 22 percent in the Slovak Republic and 18 percent in Ukraine. Georgia and Romania, Macedonia and Kazakhstan, and Czech Republic and Bulgaria are the couple of countries which introduced their flat tax reforms in 2005, 2007 and 2008 respectively. Reduces in the CIT rates are not remarkable among the previous ones. As an example Georgia, Kazakhstan and Bulgaria did not lower their CIT rates after reform, additionally Czech Republic and Macedonia cut their CIT rates nearly about 3 percent which is not a significant decrease for taxpayers. However cuts in the CIT in these countries are increased by and by except in Bulgaria which did not make any changes in the CIT after reform.
3. Objective, Data and Methodology
The objective of the analysis is to empirically examine whether the negative impact of tax rates on FDI is significant or not for the countries which had maiden flat tax reforms. An attentive reading of the current literature points out that the effect of tax rates on FDI is generally negative however such an empirical study focusing on the countries which applied flat tax reforms does not exist. The data is drawn from two main sources. The first is the World Development Indicators (2016). We collect growth, openness, trade deficit, market size, labor cost, and trade barrier data from this source. The second is Trading Economics (2016). Data are longitudinal for 1990-2014 for all twelve countries for the econometric examination. As known, the logic behind the use of a
longitudinal data is to combine the time series with the cross-sectional units in order to gain more information when the sample size for the individual countries is small. However the data are unbalanced according to the availability. The econometric methodology of this study are as follows. First, seven determinants of FDI is regressed on FDI itself by using panel regressions. Secondly, panel cointegration tests are applied using the methodology developed by Pedroni (199914, 200415) and the long term relationships are carried out. As second objective is to carry
out whether the relationships between the (long term) panel regressions and the cointegration (long term) are nearly similar or not.
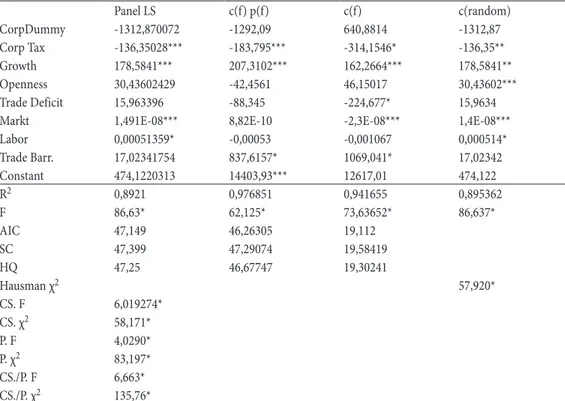
Table1: Panel Estimations for the Determinants of FDI Dependent Variable: FDI/1000000
Panel LS c(f) p(f) c(f) c(random) CorpDummy -1312,870072 -1292,09 640,8814 -1312,87 Corp Tax -136,35028*** -183,795*** -314,1546* -136,35** Growth 178,5841*** 207,3102*** 162,2664*** 178,5841** Openness 30,43602429 -42,4561 46,15017 30,43602*** Trade Deficit 15,963396 -88,345 -224,677* 15,9634
Markt 1,491E-08*** 8,82E-10 -2,3E-08*** 1,4E-08***
Labor 0,00051359* -0,00053 -0,001067 0,000514* Trade Barr. 17,02341754 837,6157* 1069,041* 17,02342 Constant 474,1220313 14403,93*** 12617,01 474,122 R2 0,8921 0,976851 0,941655 0,895362 F 86,63* 62,125* 73,63652* 86,637* AIC 47,149 46,26305 19,112 SC 47,399 47,29074 19,58419 HQ 47,25 46,67747 19,30241 Hausman χ2 57,920* CS. F 6,019274* CS. χ2 58,171* P. F 4,0290* P. χ2 83,197* CS./P. F 6,663* CS./P. χ2 135,76*
*,** & *** indicates significance about %1, %5 and %10 respectively, CS.:Cross Section; P.:Period
Table 1 shows the long term panel estimations of the determinants of the FDI on the basis of panel regressions. The columns gives different estimation specifications. In the first column pooled regression results are shown. According to this regression three set of tests from three restricted specifications, one with period fixed effects only, one with cross-section fixed effects only and 14 Pedroni, P. (1999). Critical Values for Cointegration Tests in Heterogeneous Panels with Multiple Regressors, Oxford
Bulletin of Economics and Statistics, 61(S1): 653–670.
15 Pedroni, P. (2004). Panel Cointegration: Asymptotic and Finite Sample Properties of Pooled Time Series Tests with an Application to the PPP Hypothesis: New Results, Econometric Theory, 20(3): 597–625.
one with only a common intercept are conducted. The test statistics shown at the bottom of the Table 1 strongly reject the null that cross section, period, and joint significance of all fixed effects are redundant. Test statistics suggest two way fixed effects specification. Hausman test also strongly rejects the null that random effects are appropriate. According to the Hausman test there is no random effects in both two ways.
Table 2: LM Tests for Random Effects
Breusch-Pagan Honda King-Wu
Cross-section 2,315558 1,52169*** 1,52169***
Period 1,129512 1,062785 1,062785
*,** and *** indicates significance about %1, %5 and %10 respectively
Table 2 gives the results for Lagrange Multiplier (LM) tests for random effects. According to the Breusch-Pagan test, null hypothesis which indicate that there is no effects is not rejected in both ways. Honda and King-Wu tests do not reject the same hypothesis for time-specific effects. However cross-section tests have p-values below conventional significance level of %10 which point out a very little evidence that there is cross-section random effects in in the pooled estimator residuals. In correspondence to the results of Hausman test and LM tests, one-way fixed effects model is selected. Moreover, fixed effect in both ways can also be taken into account.
According to the panel regression estimations on Table 1, the findings point out that the coefficient of corporate tax rate is negative and significant at %1 level. It means that flattening of the tax rate would have significant and negative impact on FDI and/or foreign investor thus local corporate tax rates negatively affect FDI. Findings point out that multinational companies (MNC) invest higher in countries which have lower CIT rates. Moreover, high corporate profit taxes have a depressing effect on investment and FDI and oppositely, reduction in the corporate taxes influence the activities of MNCs represent. According to the results %1 percent increase in corporate tax rates prevent FDI about 136-314 million$ on those twelve countries.
Although it is a well-known and expected relationship among corporate tax rates and FDI, it is brighter to see the behavioral responses of FDI to international tax rules because of the countries chosen among the countries which have flat tax regime application.
We see from the Table 1 that economic growth is also significant and positively contributing FDI. There is a question that flat taxes would not be able to totally balance lower rates with increased economic output and therefore revenue would be lost. With that question set aside it appears that flat tax rates offer host countries a better way. Openness has also have positive coefficient however it is insignificant. Trade deficit and labor cost coefficients are also insignificant. Trade barrier has positive effect on FDI however it is statistically significant but does not have the correct sign for economic expectation.
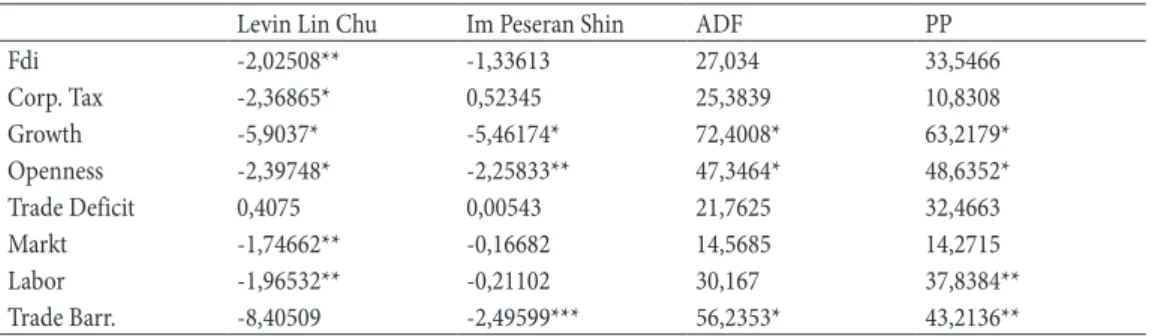
Table 3: Panel Unit Root Test Results
Levin Lin Chu Im Peseran Shin ADF PP
Fdi -2,02508** -1,33613 27,034 33,5466 Corp. Tax -2,36865* 0,52345 25,3839 10,8308 Growth -5,9037* -5,46174* 72,4008* 63,2179* Openness -2,39748* -2,25833** 47,3464* 48,6352* Trade Deficit 0,4075 0,00543 21,7625 32,4663 Markt -1,74662** -0,16682 14,5685 14,2715 Labor -1,96532** -0,21102 30,167 37,8384** Trade Barr. -8,40509 -2,49599*** 56,2353* 43,2136**
*,** and *** indicates significance about %1, %5 and %10 respectively
Table 3 gives panel unit root test results. The addition of cross-sectional information with the information of time series reduces standard errors hence, it improves estimation efficiency. We consider the panel unit root tests developed by Maddala and Wu (1999)16 which are Fisher-type
tests using ADF and PP tests, Levin, Lin and Chu (2002)17, and Im, Pesaran and Shin (2003)18.
All these tests perform under null that there is unit root. According to the results, null hypothesis of unit root is not rejected for the variables FDI, corptax, tradedeficit, markt, labor cost and trade barrier at %5 level which point out that the variables are I(1).
Table 4: Pedroni Panel Cointegration Test Results
Panel v-Stat. -1,133 Group rho-Stat. 2,159
Panel rho-Stat. 0,259 Group PP-Stat. -9,207*
Panel PP-Stat. -8,126* Group ADF-Stat. -3,949*
Panel ADF-Stat. -4,535*
*,** and *** indicates significance about %1, %5 and %10 respectively
Cointegration theory searches long-run relationship among I(1) variables and became an important instrument in time series examinations. It is first developed by Granger (1981)19, extended by Engle,
Granger (1987)20 and Engle, Yoo (1987)21. Johansen (1988)22 improved the theory by developing 16 Maddala, G.S., Wu, S. (1999). A Comparative Study of Unit Root Tests with Panel Data and a New Simple Test,
Oxford Bulletin of Economics and Statistics, 61: 631–652.
17 Levin, A. et al (2002). Unit Root Tests in Panel Data: Asymptotic and Finite-Sample Properties, Journal of Econometrics, 108(1): 1–24.
18 Im, K.S., Pesaran, M.H., Shin, Y. (2003). Testing for Unit Roots in Heterogeneous Panels, Journal of Econometrics, 115(1): 53–74.
19 Granger, C.W.J. (1981). Some Properties of Time Series Data and Their Use in Econometric Model Specification, Journal of Econometrics, 16: 121–130.
20 Engle, R.F., Granger, C.W.J. (1987). Co-Integration and Error Correction: Representation, Estimation, and Testing, Econometrica, 55(2): 251-276.
21 Engle, R.F., Yoo, B.S. (1987). Forecasting and Testing in Co-integrated Systems, Journal of Econometrics, 35(1): 143-159.
22 Johansen, S. (1988). Statistical Analysis of Cointegration Vectors, Journal of Economics Dynamic and Control, 12(2-3): 231–254.
a solution to multiple cointegration relationships among variables. However for short range macroeconomic variables, integrating cross-section dimension with time-series dimension leads to panel cointegration tests. Although there are several panel cointegration test in the literature, mainly two different approaches for the panel cointegration tests are used. First approach is based on residuals for testing cointegration where some selected ones are McCoskey and Kao (1998)23,
Kao (1999)24, Pedroni (1995)25. Second approach is maximum-likelihood-based where, Larsson
and Lyhagen (1999)26 and Larsson, Lyhagen and Lothgren (2001)27 are some selected ones. We
use the first approach in cointegration testing and apply Pedroni (1999)cointegration test which derives seven different statistics. Of these seven statistics, four are based on within-dimension, and three are based on between-dimension. The between-dimension-based statistics allow modelling an additional source of potential heterogeneity across countries. For any of these tests, large negative values which causes lower tail probabilities imply that the null of no cointegration is rejected. The results from the performed tests are given in Table 4. According to the results the test statistics are exceeded thus the null hypothesis of no cointegration is rejected which points out a long-run relationship among the relevant variables exist. The results where null hypothesis of no cointegration is rejected imply that there is a long-run relationship among the variables which points out a cointegration relation between FDI and its selected determinants.
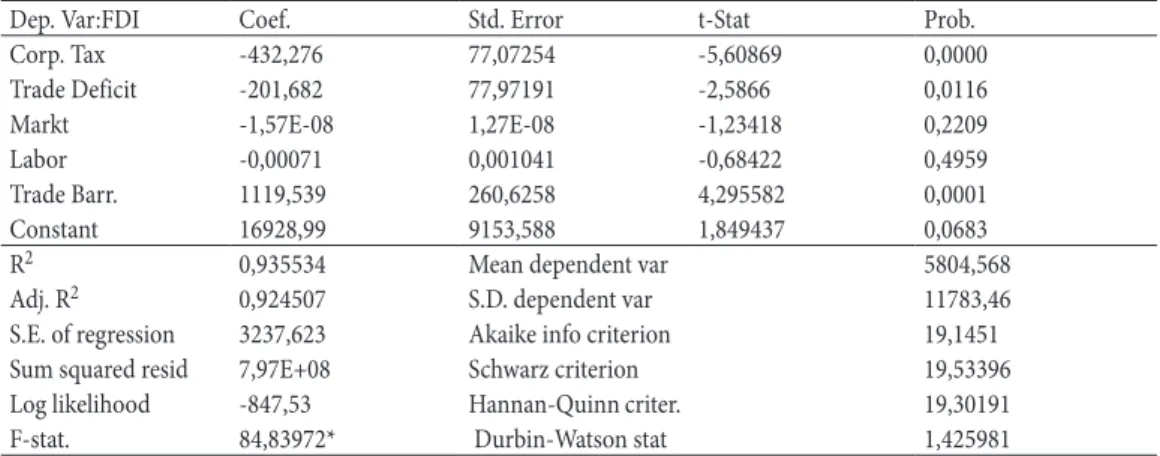
Table 5: Panel Cointegration Equation
Dep. Var:FDI Coef. Std. Error t-Stat Prob.
Corp. Tax -432,276 77,07254 -5,60869 0,0000
Trade Deficit -201,682 77,97191 -2,5866 0,0116
Markt -1,57E-08 1,27E-08 -1,23418 0,2209
Labor -0,00071 0,001041 -0,68422 0,4959
Trade Barr. 1119,539 260,6258 4,295582 0,0001
Constant 16928,99 9153,588 1,849437 0,0683
R2 0,935534 Mean dependent var 5804,568
Adj. R2 0,924507 S.D. dependent var 11783,46
S.E. of regression 3237,623 Akaike info criterion 19,1451
Sum squared resid 7,97E+08 Schwarz criterion 19,53396
Log likelihood -847,53 Hannan-Quinn criter. 19,30191
F-stat. 84,83972* Durbin-Watson stat 1,425981
*,** and *** indicates significance about %1, %5 and %10 respectively
23 Mccoskey, S., Kao, C. (1998). A Residual-Based Test of the Null of Cointegration in Panel Data, Econometric Reviews, 17(1): 57–84.
24 Kao, C. (1999). Spurious Regression and Residual-Based Tests for Cointegration in Panel Data, Journal of Econometrics, 90(1): 1–44.
25 Pedroni, P. (1995). Panel Cointegration; Asymptotic and Finite Sample Properties of Pooled Time Series Tests with an Application to the PPP Hypothesis, Indiana Univ. WP in Economics, No: 95–013.
26 Larsson, R, Lyhagen J. (1999). Likelihood-Based Inference in Multivariate Panel Cointegration Models, Stockholm School of Economics, Working Paper Series in Economics and Finance, No:331.
27 Larsson, R, Lyhagen, J., Löthgren, M. (2001). Likelihood-Based Cointegration Tests in Heterogeneous Panels, Econometrics Journal, 4(1): 109-142.
Table 5 presents the panel cointegration equation when the FDI is dependent variable. It is the log-run relationship between cointegrated variables which are considered as I(1) in Table 3. According to panel time series econometric techniques developed by Pedroni (1999) and Engel-Granger two step approach, corporate tax which is the variable of interest has a negative effect on FDI as expected. The coefficient has estimated bigger than the panel regressions from Table 1. It shows that flat tax applications have significant effects in attracting capital to host countries. While the findings of empirical analysis briefly represent a negative impact of CIT rates on FDI, this information is open to multiple explanations. The results are just for the 12 flat tax applied countries, and also it is a well-known economic expectation, the interpretation can be generalized for lower tax rated economies. As known, flat tax rates promise lower tax payment particularly for wealthier tax payers and foreign investors because the application lead to a permanent decrease in tax rates and this perhaps explain the popular appeal of this element. As those twelve countries are selected where the tax rates are mostly decreased because of the flat tax applications on corporate taxes, local corporate tax coefficient has taken place negative and significant. This is probably why the interested coefficient occurred more brightly than the other findings obtained from similar studies. Panel regression estimates and panel cointegration analysis of the impact of the variation in the local CIT rates on FDI systematically brings out negative correlations of FDI and flat tax rate of return at country level.
The main hypothesis that is which determinant of the FDI is key in the long-run pattern of investment function shows that corporate tax rates and trade deficit are more important than the determinants of FDI when attracting investment to host countries. This does not mean the other determinants do not have any importance on FDI, but it means that cutting tax rates is not enough to stimulate foreign investment climate for investors. It is known that governments have several instruments that they can use to attempt to influence foreign capital. As some of these, the coefficients of market size and labor cost variables are insignificant. Trade deficit and trade barrier are significant which shows that trade has an influence on FDI. Although trade deficit is economically significant where the trade barrier is not. According to findings of the panel regressions and cointegration, CIT rate has greater effect on FDI than trade deficit, and other FDI determinants have.
4. Conclusion
The goal of this paper is to observe the interaction among FDI and CIT rates in the pattern of long-run relationship of FDI and its determinants known as market size, labor cost, trade barrier, growth rate, openness, trade deficit, and tax rates, for 12 countries which have flat tax application in order to focus and carry out the relationship more clear in the countries which have smaller corporate tax rates. This is preferred to carry out the importance of tax rates as the key variable on FDI in terms of the long-run relationship.
Determining the relationship among FDI and tax rates can design effective economic policies in order to accomplish higher capital movements from the originating to host country. The results based on panel regression and panel cointegration show that CIT rates can be considered as a determinant of FDI and have closer relationship in flat tax applications. The results are for the period 1990-2014 and CIT rates, trade deficit, market size, labor cost and trade barrier are cointegrated with FDI both in country-level and in panel group-level. These results point out that foreign investors correspond the variation in those variables in searching where to invest. We can conclude that promoting flat tax applications and reducing trade deficit are relatively more effective policies on FDI than struggling with the other policies related with other determinants do. So that, when designing an economic policy to improve attraction of foreign investment, it would be very important to focus tax rates, which means to focus the economic-fiscal factors that stimulate foreign investors. A policy implication of such an investment scenario is that host country investment conditions such as taxation may play an important role in investors’ decisions. As a consequence, host country CIT rates plays a bigger role in attracting foreign capital. It is of course necessary to improve foreign investment conditions/climate to stimulate application of CIT rates but it is not enough. It is also very important to improve foreign investment statement by triggering both economic growth and even openness by raising GDP per capita. Although economic policy designers focus on improvement of investment conditions for foreign and domestic investors so far, the public finance policy for increasing tax revenues by tax rates and redounding tax revenues is essential but not enough to ensure FDI. As a result, focusing on the improvement the climate/conditions/factors of the investment not only for foreign but also for domestic investors by improving the conditions/climate for the most important macroeconomic factors stimulating investment that are profitability, advantages of competitiveness in terms of technology and costs, skilled-educated human capital, political and economic stability, income inequality and other institutional parameters. Moreover, there is a room for further studies that researchers and economic policy designers should focus, find out, discuss and improve these parameters of foreign investment which is strongly related with the tax competition and economic growth and development of originating and host countries. There is also a room for the researchers to discuss such a relationship between the tax rates and FDI independent from countries.
References
BOSKIN, M.J., William G.G. (1987). New Results on the Effects of Tax Policy on the International Location of Investment. The Effects of Taxation on Capital Accumulation, Ed: M. Feldstein, Univ. of Chicago Press, Chicago.
CHAKRABARTI, A. (2001). The Determinants of Foreign Direct Investment: Sensitivity Analyses of Cross-Country Regressions, KYKLOS, 54(1): 89–114.
DESAI, M.A., Foley, C.F., Hines, J.R. (2004). Foreign Direct Investment in a World of Multiple Taxes, Journal of Public Economics, 88(12): 2727-2744.
ENGLE, R.F., Granger, C.W.J. (1987). Co-Integration and Error Correction: Representation, Estimation, and Testing, Econometrica, 55(2): 251-276.
ENGLE, R.F., Yoo, B.S. (1987). Forecasting and Testing in Co-integrated Systems, Journal of Econometrics, 35(1): 143-159.
FERHATOĞLU, E. (2006). Avrupa’da Düz Oranlı Vergi Sistemi Çalışmaları ve Başarısı, Vergi Dünyası, 25(298): 170-176.
GRANGER, C.W.J. (1981). Some Properties of Time Series Data and Their Use in Econometric Model Specification, Journal of Econometrics, 16: 121–130.
HALL, R.E., Rabushka, A. (1983). Low Tax, Simple Tax, Flat Tax, McGraw-Hill, New York. HALL, R.E., Rabushka, A. (1985). The Flat Tax, Stanford, Calif., Hoover Institution Press.
IM, K.S., Pesaran, M.H., Shin, Y. (2003). Testing for Unit Roots in Heterogeneous Panels, Journal of Econometrics, 115(1): 53–74.
JOHANSEN, S. (1988). Statistical Analysis of Cointegration Vectors, Journal of Economics Dynamic and Control, 12(2-3): 231–254.
KAO, C. (1999). Spurious Regression and Residual-Based Tests for Cointegration in Panel Data, Journal of Econometrics, 90(1): 1–44.
LARSSON, R, Lyhagen J. (1999). Likelihood-Based Inference in Multivariate Panel Cointegration Models, Stockholm School of Economics, Working Paper Series in Economics and Finance, No:331. LARSSON, R, Lyhagen, J., Löthgren, M. (2001). Likelihood-Based Cointegration Tests in Heterogeneous
Panels, Econometrics Journal, 4(1): 109-142.
LEVIN, A., Lin, C.F., Chu, C.S. (2002). Unit Root Tests in Panel Data: Asymptotic and Finite-Sample Properties, Journal of Econometrics, 108(1): 1–24.
MADDALA, G.S., Wu, S. (1999). A Comparative Study of Unit Root Tests with Panel Data and a New Simple Test, Oxford Bulletin of Economics and Statistics, 61: 631–652.
MCCOSKEY, S., Kao, C. (1998). A Residual-Based Test of the Null of Cointegration in Panel Data, Econometric Reviews, 17(1): 57–84.
NING, Y., Reed, M.R. (1995). Locational Determinants of U.S. Direct Foreign Investment in Food and Kindered Products, Agrobusiness, 11(1): 77- 85.
PAULUS, A., Peichl, A. (2008). Effects of Flat Tax Reforms in Western Europe on Equity and Efficiency, ISER Discussion Paper, 2008-06.
PEDRONI, P. (1995). Panel Cointegration; Asymptotic and Finite Sample Properties of Pooled Time Series Tests with an Application to the PPP Hypothesis, Indiana Univ. WP in Economics, No: 95–013. PEDRONI, P. (1999). Critical Values for Cointegration Tests in Heterogeneous Panels with Multiple
Regressors, Oxford Bulletin of Economics and Statistics, 61(S1): 653–670.
PEDRONI, P. (2004). Panel Cointegration: Asymptotic and Finite Sample Properties of Pooled Time Series Tests with an Application to the PPP Hypothesis: New Results, Econometric Theory, 20(3): 597– 625.
PORCANO, T.M., Price, C.E. (1996). The Effects of Government Tax and Nontax Incentives on Foreign Direct Investment, Multinational Business Review, 4(1): 9-20.
SARISOY, İ., Koç, S. (2010). Doğrudan Yabancı Sermaye Yatırımlarının Kurumlar Vergisi Gelirleri Üzerindeki Etkisinin Ekonometrik Analizi, Erciyes Üniversitesi İİBF Dergisi, 36: 133-153.
SAYGIN, Ö., (2013). Gelir Vergisi Tarifesinin Esneklik Analizi: Türkiye Üzerine Bir Değerlendirme, Vergi Sorunları Dergisi, 301: 175-186.
SWENSON, D.L. (2004). The Impact of U.S. Tax Reform on Foreign Direct Investment in the United States, Journal of Public Economics, 54(2): 243-266.
The World Bank, World Development Indicators, http://databank.worldbank.org /data/reports. Erişim Tarihi (31.07.2016)