A- APPLIED SCIENCES AND ENGINEERING
2018, 19(4), pp. 926 - 947, DOI: 10.18038/aubtda.425374
ATR–FTIR SPECTROSCOPY COMBINED WITH CHEMOMETRICS FOR RAPID CLASSIFICATION OF EXTRA VIRGIN OLIVE OILS AND EDIBLE OILS FROM
DIFFERENT CULTIVARS AVAILABLE ON THE TURKISH MARKETS Fatma Nur ARSLAN 1, 2,*
1 Department of Chemistry, Faculty of Science, University of Karamanoğlu Mehmetbey, Karaman, Turkey 2 Van’t Hoff Institute for Molecular Sciences, Analytical Chemistry Group, University of Amsterdam,
Amsterdam, Netherlands
ABSTRACT
In this study, a combination of attenuated total reflectance–Fourier transform infrared (ATR–FTIR) spectroscopy and chemometric techniques was used to differentiate the type of extra virgin olive oils (VOO) and edible oils available on the Turkish markets. A total of 144 spectra of samples, including extra VOO, hazelnut oil (HNO), cottonseed oil (CSO), sunflower oil (SFO) and soybean oil (SBO), was recorded. Differentiation of edible oils was performed using principal component analysis (PCA), hierarchical cluster analysis (HCA), linear discriminant analysis (LDA) and soft independent modeling of class analogies (SIMCA). The spectra collected from wavenumber region of 4000–650 cm-1 and 28 different wavenumber ranges were evaluated for optimal models. All multivariate analysis provided excellent discriminations between the edible oil classes with low classification error. LDA models constructed with five predictors and a total of 100% of edible oil samples from different types were correctly classified. Furthermore, no misclassification was reported for the supervised SIMCA models constructed for the discrimination of VOOs from SFO, SBO and CSO samples, with an accuracy of 95%. Consequently, ATR–FTIR spectroscopy combined with multivariate data analyses provides excellent illustrations of the relative positions of the different types of commercial edible oils according to their quality and purity.
Keywords: Classification, Spectroscopy, Chemometrics, Virgin olive oil
1.INTRODUCTION
In recent years, there is an increasing demand for rapid spectroscopic methods for confirming the authenticity or detecting the adulteration of food products [1–3]. The analytical control of labeling conformity plays a role of fundamental importance for the protection of a high quality food from unjust competition from other products with the same trade name but a value, and so a sale price, considerably lower. In this regard, the verification of the origin is a key factor in establishing the authenticity of edible oils in markets. It should be remembered that the confirmation of the authenticity of an edible oil product is a complex problem that takes into consideration the oil in its entirety. And then it requires an evaluation far more clear than simply measuring a quality parameter related with the property of edible oil. The issues of edible oil authentication based on spectroscopic methods also require a multivariate statistical approach for their resolution, and find very effective analytical tools in the use of chemometric techniques [4, 5].
Within this field of research, recently several analytical methods have been reported for evaluating the efficiency of different instrumental techniques followed by multivariate data analysis [6–8]. High performance liquid chromatography (HPLC) and gas chromatography (GC) techniques in combination with different detectors have been successfully applied for the authentication and quality control of edible oils. Even though the accurate results reported the confirmation for the feasibility of the chromatographic techniques, it must be emphasized that there are also important drawbacks concerned to them. The main disadvantages of these techniques are that they are labor–intensive and time consuming, while most of the reported methodologies require expensive equipments, sample pre–
927
treatment procedures, hazardous chemical usage and a high degree of technical knowledge [4, 5, 9, 10]. Therefore, the demand for simple, faster, non–destructive and environmentally friendly analytical techniques has encouraged the application of spectroscopic methods.
Recently, there have been a number of studies concerning with the characterization, classification, and authentication of edible fats and oils by using spectroscopic methods with chemometrics, have been reported in literature. Combined with multivariate data analyses, the spectroscopic techniques including near infrared (NIR) [11, 12], fluorescence [13–16], raman [17, 18], nuclear magnetic resonance (NMR) [5, 19] and Fourier transform infrared (FTIR) [4, 6, 9], is a promising analytical tool to verify the authenticity of fats and oils, due to their simplicity, rapidity, and labor–effortlessness. The application of FTIR spectroscopy combined with chemometrics, particularly has become a powerful analytical tool for the authentication researches [6, 7]. FTIR spectroscopy with chemometrics has been employed for the authentication of olive oil (OO) adulterated with hazelnut, sunflower, corn and soybean oils [7, 19–21]. ATR–FTIR spectroscopy was also employed for the authentication of extra virgin olive oil (VOO) from sunflower, corn, soybean, hazelnut and sesame oils [10, 17, 22]. Extra VOO is one of the most important edible oil products in Turkish super markets [1]. The high demand for extra VOO is associated with the Turkish culture based on nutritional customs correlated with health benefits. One of the most important characteristics of VOOs is the presence of a high amount of oleic acid (C18:1, n–9), which accounts for 60–80% of the total fatty acids (FA) and for about 90% of the monounsaturated fatty acids (MUFA). Furthermore, the high levels of natural lipid–soluble bioactive components and phenolics was detected in VOO samples [23, 24]. High–quality extra VOOs are the most desirable edible oil on description of their health benefits and nutritional properties, and they are thus the most expensive scores. Unfortunately, due to its high price, the extra VOO is a target for mislabeling or adulteration with cheaper and low–quality oils, such as refined hazelnut oil, or pomace OO as well as with similar seed oils [4, 6, 7, 9, 15, 16, 23]. Hence, the development of rapid analytical methods for the detection of edible oil adulteration with their origins is a focus of great interest, both for reasons of consumer’s thrust and health as well as with regard to manufacturing quality.
In this framework, the aim of this study was to develop an analytical method based on ATR–FTIR spectroscopy in combination with multivariate data analyses for the detection of the authenticity of edible oils available on the Turkish markets based on their types/origins. The obtained ATR–FTIR spectra were subjected to the principal component analysis (PCA), hierarchical cluster analysis (HCA), soft independent modeling of class analogies (SIMCA) and linear discriminant analysis (LDA).
2.MATERIALS AND METHODS
2.1. Samples and Chemicals
This study was performed on forty eight edible oil samples in different types/origins and brands, including extra virgin olive oil (n=8; extra VOO– 1 to 8), refined hazelnut (n=10; HNO– 1 to 10), cotton seed (n=10; CSO– 1 to 10), sunflower (n=10; SFO– 1 to 10) and soybean (n=10; SBO– 1 to 10) oils. The samples were purchased from local markets in Turkey. The quality grades of all studied oils were guaranteed on their labels by the suppliers. The samples were stored in the dark bottles and also at ambient temperature until the time of analysis.
All chemicals and solvents (methanol, n–hexane, ethanol, sodium hydroxide and anhydrous sodium sulphate) were of spectroscopic or chromatographic grade, and they were purchased from VWR International (Poole, UK) and Sigma–Aldrich Chemicals (Zwijndrecht, The Netherlands). A standard mixture of 37 fatty acid methyl esters (FAMEs) was purchased from Sigma–Aldrich Chemicals (Zwijndrecht, The Netherlands).
2.2. Acquisition of Attenuated Total Reflectance–Fourier Transform Infrared (ATR–FTIR) Spectra
Spectra were collected in a Perkin–Elmer Spectrum 100 FTIR Spectrometer (Perkin Elmer, Waltham, MA, USA) equipped with attenuated total reflectance (ATR) sampling accessory (ZnSe crystal) and deuterated tri–glycine sulphate (DTGS) detector. Measurements were performed by pipetting 5 µL of oil sample on top of the ATR crystal. Spectra were recorded in transmittance mode from 650 to 4000
cm–1, co–adding 64 interferograms at a resolution of 4 cm–1. The analysis time for each spectrum was
approximately 2 min. All spectra were subtracted against to the background spectrum (air spectrum) which was recorded after each sample scan. Between the runs/ analyses, the ATR crystal was carefully cleaned with hexane, followed by ethanol, and dried. The spectra were recorded as % transmittance (%T) values at each data point and each sample was measured in triplicate.
2.3. Chemometrics Study
Principal component analysis (PCA), hierarchical cluster analysis (HCA), linear discriminant analysis (LDA) and soft independent modeling of class analogies (SIMCA) models were constructed to differentiate the edible oils based on their types. FTIR spectra were divided into the 28 different wavenumber regions presented in Table 1. The selected spectral regions were constructed according to the previous literatures [3,6,8,20,25]. In the selected wavenumber regions, a peak or a shoulder correspond to structural or functional group information, either about the lipids or lipid–soluble bioactive components of the edible oils (see Table 1). The spectra of selected regions based on
different wavenumber ranges, and also the spectra of wavenumber ranges of 4000–650 cm–1 (full
wavenumber region), 4000–1500 cm–1 (wavenumber region of functional groups) and 1500–650 cm–1
(wavenumber region of finger–print) were used for constructing the models. The pre–processing
treatments and multivariate data analyses were implemented by using Unscrambler®X10.4 (CAMO
software, Oslo, Norway) and Octave Chemometrics software (Version 4.2, GNU General Public License). First derivative Savitzky–Golay smoothing [26] and standard normal variate (SNV) [27] pre–treatments for recorded spectra were performed. The figure of FTIR spectra was generated using OriginPro 8 (OriginLab, USA), and chromatographic data were recorded using Agilent ChemStation 2001 data processor.
2.4. Fatty Acid Composition Analysis by GC–FID
The fatty acid compositions of samples were determined by using capillary gas chromatography–flame ionization detection (GC–FID) technique according to the modified method reported by Arslan et al (2017) [28]. Fatty acid methyl esters of edible oils were prepared by base–catalyzed esterification procedure, and this procedure was performed as follows: 0.1 g of oil sample was dissolved in 10 mL
of n–hexane, after then 0.1 mL of 2N KOH/CH3OH solution was added and agitated for 1 min. The
mixture was then centrifugated for 5 min at 2500 rpm, and the clear supernatant was transferred to GC vials. Chromatographic analyses were performed on Agilent 7890A GC-FID system (Agilent Technologies Inc, Wilmington, DE, USA) equipped with highly polar HP–88 cyanopropyl (100 m×0.25 mm i.d. with a 0.2 μm film thickness) capillary column. The carrier gas was helium with a
constant flow of 0.8 ml.min–1. The temperatures of detector and injector block were set as 250°C. 1 µL
of FAME sample was injected with the split mode (10:1). The oven temperature program was run at
45°C for 4 min, increased to 175°C at a rate of 13°C.min–1 and held at 175°C for 27 min, then
increased from 175°C to 215°C at a rate of 4°C.min–1 and finally held at 215°C for 20 min. The
samples were analyzed in triplicates and standards were used to calculate the percentages of total fatty acids (FAs) based on their peak areas.
929
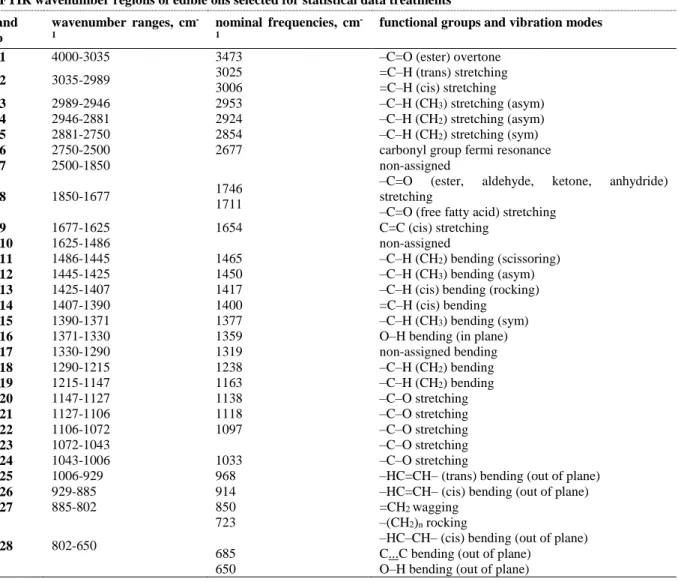
Table 1. FTIR spectroscopic regions of edible oils selected for statistical data treatments, nominal frequencies, functional and vibration modes
FTIR wavenumber regions of edible oils selected for statistical data treatments band no wavenumber ranges, cm -1 nominal frequencies, cm -1
functional groups and vibration modes
1 4000-3035 3473 –C=O (ester) overtone
2 3035-2989 3025 3006 =C–H (trans) stretching =C–H (cis) stretching 3 2989-2946 2953 –C–H (CH3) stretching (asym) 4 2946-2881 2924 –C–H (CH2) stretching (asym) 5 2881-2750 2854 –C–H (CH2) stretching (sym)
6 2750-2500 2677 carbonyl group fermi resonance
7 2500-1850 non-assigned
8 1850-1677 1746
1711
–C=O (ester, aldehyde, ketone, anhydride) stretching
–C=O (free fatty acid) stretching
9 1677-1625 1654 C=C (cis) stretching
10 1625-1486 non-assigned
11 1486-1445 1465 –C–H (CH2) bending (scissoring)
12 1445-1425 1450 –C–H (CH3) bending (asym)
13 1425-1407 1417 –C–H (cis) bending (rocking)
14 1407-1390 1400 =C–H (cis) bending
15 1390-1371 1377 –C–H (CH3) bending (sym)
16 1371-1330 1359 O–H bending (in plane)
17 1330-1290 1319 non-assigned bending 18 1290-1215 1238 –C–H (CH2) bending 19 1215-1147 1163 –C–H (CH2) bending 20 1147-1127 1138 –C–O stretching 21 1127-1106 1118 –C–O stretching 22 1106-1072 1097 –C–O stretching 23 1072-1043 –C–O stretching 24 1043-1006 1033 –C–O stretching
25 1006-929 968 –HC=CH– (trans) bending (out of plane)
26 929-885 914 –HC=CH– (cis) bending (out of plane)
27 885-802 850 =CH2 wagging 28 802-650 723 685 650 –(CH2)n rocking
–HC–CH– (cis) bending (out of plane) C...C bending (out of plane)
O–H bending (out of plane)
† Table was constituted according to References [3, 6, 8, 18, 23] 3. RESULTS AND DISCUSSION
3.1. Spectra of Oil Samples
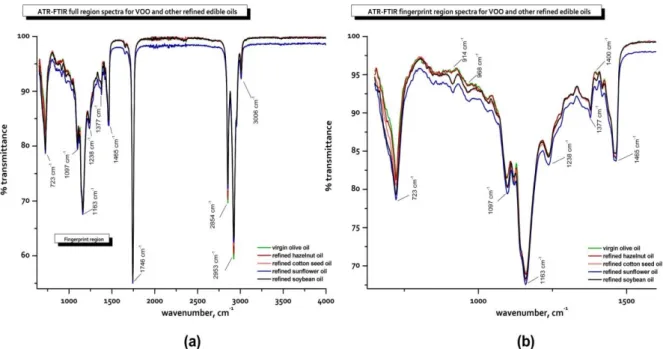
FTIR and finger–print region spectra of the extra virgin olive oil (VOO) and refined edible oils (hazelnut, cottonseed, sunflower, and soybean oils) are presented in Figure 1. Figure 1 illustrates the
examples of infrared spectra recorded from the wavenumber range of 650 to 4000 cm-1. The FTIR
spectra of edible oils are mainly controlled by the characteristic triglyceride transmittance bands, and look very similar due to their similar chemical compositions. Most of the wavenumber regions of transmittance bands are previously presented in literature [6,7,9,20,24], and here a summary was represented (see Table 1). As can be seen from Figure 1, there were not any distinct differences among the five spectra, in other words; the spectra of refined CSO, SFO and SBO samples were very quite similar to each other. As well, the spectra of extra VOO and HNO samples were also very quite similar. This is due to the similarities between their fatty acid profiles; just because CSO, SFO and SBO contain higher proportion of linoleic acid (C18:2) groups, whereas extra VOO and HNO contain higher amount of oleic acid (C18:1) groups (Table 2).
In Figure 1, there were disctinct transmittance bands in the region of functional groups (4000–1500
cm–1), but more confusing transmittance bands in finger–print region (1500–650 cm–1). The first strong
peaks at 3006 cm–1, 2953 cm–1 and 2854 cm−1 originates from the =C–H (cis) stretching, –C–H (CH3)
asymmetrical stretching and –C–H (CH2) symmetrical stretching vibrations, respectively. The second -
strong peak at 1746 cm–1 originates from the carbonyl (–C=O) stretching vibration, in this case
associated with the triglyceride ester linkage, as well as the carboxylic group of free FAs. In the
beginning of finger–print region (<1500 cm–1), three significant peaks were observed at 1377 cm–1,
1400 cm-1 and 1465 cm–1, assigned to the terminal (CH
3) groups symmetric bending, bending of =C–H
(cis) and the scissoring vibration of the CH2 groups, respectively. In this region, another peak at 1238
cm–1 was found in this case presenting some contribution from CH2 bending modes. The strongest
peak of finger–print region was observed at 1163 cm–1 corresponding to –C–H (CH2) bending
vibration. The spectra of fingerprint region also presented the differences due to the peaks at 723 cm–1
and 1097 cm–1 associated with –(CH2)n rocking and –C–O stretching vibrations, respectively. Finally, -
intensity differences were also recorded at 968 cm–1 [–HC=CH– (trans) bending (out of plane)] and
914 cm–1 [–HC=CH– (cis) bending (out of plane)].
Figure 1. a) Full and b) finger print region spectra of the virgin olive oil and other refined edible oils in the spectroscopic
wavenumber region of 4000–650 cm–1
FTIR spectra of the studied oil samples appeared quite similar, and it was very difficult to differentiate them from each other (Supplementary Figure 1a). Interpretation of the spectral bands offers information about the molecular skeleton, functional and finger–print groups of the edible oils; however, to achieve information about the determination of authenticity or discrimination of the extra VOOs from other edible oils, the band interpretation is not necessitated. Therefore, the multivariate classification and discrimination models must be constructed using the full or specific wavenumber regions. (see section 3.2 and 3.3). Multivariate analysis described in the literature has been widely utilized with FTIR data [1, 4, 6–9]. Prior to multivariate data analysis, first derivative Savitzky–Golay smoothing (Supplementary Figure 1b) and standard normal variate(SNV) pre–treatments (Supplementary Figure 1c) were performed.
931
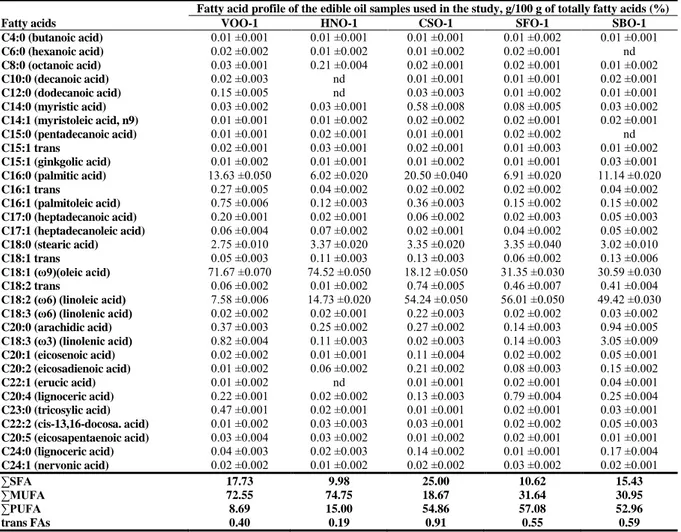
Table 2 Fatty acid profiles of the edible oils in different origins, g/100 g of totally fatty acids (%)
Fatty acid profile of the edible oil samples used in the study, g/100 g of totally fatty acids (%)
Fatty acids VOO-1 HNO-1 CSO-1 SFO-1 SBO-1
C4:0 (butanoic acid) 0.01 ±0.001 0.01 ±0.001 0.01 ±0.001 0.01 ±0.002 0.01 ±0.001 C6:0 (hexanoic acid) 0.02 ±0.002 0.01 ±0.002 0.01 ±0.002 0.02 ±0.001 nd C8:0 (octanoic acid) 0.03 ±0.001 0.21 ±0.004 0.02 ±0.001 0.02 ±0.001 0.01 ±0.002 C10:0 (decanoic acid) 0.02 ±0.003 nd 0.01 ±0.001 0.01 ±0.001 0.02 ±0.001 C12:0 (dodecanoic acid) 0.15 ±0.005 nd 0.03 ±0.003 0.01 ±0.002 0.01 ±0.001 C14:0 (myristic acid) 0.03 ±0.002 0.03 ±0.001 0.58 ±0.008 0.08 ±0.005 0.03 ±0.002 C14:1 (myristoleic acid, n9) 0.01 ±0.001 0.01 ±0.002 0.02 ±0.002 0.02 ±0.001 0.02 ±0.001 C15:0 (pentadecanoic acid) 0.01 ±0.001 0.02 ±0.001 0.01 ±0.001 0.02 ±0.002 nd C15:1 trans 0.02 ±0.001 0.03 ±0.001 0.02 ±0.001 0.01 ±0.003 0.01 ±0.002 C15:1 (ginkgolic acid) 0.01 ±0.002 0.01 ±0.001 0.01 ±0.002 0.01 ±0.001 0.03 ±0.001 C16:0 (palmitic acid) 13.63 ±0.050 6.02 ±0.020 20.50 ±0.040 6.91 ±0.020 11.14 ±0.020 C16:1 trans 0.27 ±0.005 0.04 ±0.002 0.02 ±0.002 0.02 ±0.002 0.04 ±0.002 C16:1 (palmitoleic acid) 0.75 ±0.006 0.12 ±0.003 0.36 ±0.003 0.15 ±0.002 0.15 ±0.002 C17:0 (heptadecanoic acid) 0.20 ±0.001 0.02 ±0.001 0.06 ±0.002 0.02 ±0.003 0.05 ±0.003 C17:1 (heptadecanoleic acid) 0.06 ±0.004 0.07 ±0.002 0.02 ±0.001 0.04 ±0.002 0.05 ±0.002 C18:0 (stearic acid) 2.75 ±0.010 3.37 ±0.020 3.35 ±0.020 3.35 ±0.040 3.02 ±0.010 C18:1 trans 0.05 ±0.003 0.11 ±0.003 0.13 ±0.003 0.06 ±0.002 0.13 ±0.006 C18:1 (ω9)(oleic acid) 71.67 ±0.070 74.52 ±0.050 18.12 ±0.050 31.35 ±0.030 30.59 ±0.030 C18:2 trans 0.06 ±0.002 0.01 ±0.002 0.74 ±0.005 0.46 ±0.007 0.41 ±0.004 C18:2 (ω6) (linoleic acid) 7.58 ±0.006 14.73 ±0.020 54.24 ±0.050 56.01 ±0.050 49.42 ±0.030 C18:3 (ω6) (linolenic acid) 0.02 ±0.002 0.02 ±0.001 0.22 ±0.003 0.02 ±0.002 0.03 ±0.002 C20:0 (arachidic acid) 0.37 ±0.003 0.25 ±0.002 0.27 ±0.002 0.14 ±0.003 0.94 ±0.005 C18:3 (ω3) (linolenic acid) 0.82 ±0.004 0.11 ±0.003 0.02 ±0.003 0.14 ±0.003 3.05 ±0.009 C20:1 (eicosenoic acid) 0.02 ±0.002 0.01 ±0.001 0.11 ±0.004 0.02 ±0.002 0.05 ±0.001 C20:2 (eicosadienoic acid) 0.01 ±0.002 0.06 ±0.002 0.21 ±0.002 0.08 ±0.003 0.15 ±0.002 C22:1 (erucic acid) 0.01 ±0.002 nd 0.01 ±0.001 0.02 ±0.001 0.04 ±0.001 C20:4 (lignoceric acid) 0.22 ±0.001 0.02 ±0.002 0.13 ±0.003 0.79 ±0.004 0.25 ±0.004 C23:0 (tricosylic acid) 0.47 ±0.001 0.02 ±0.001 0.01 ±0.001 0.02 ±0.001 0.03 ±0.001 C22:2 (cis-13,16-docosa. acid) 0.01 ±0.002 0.03 ±0.003 0.03 ±0.001 0.02 ±0.002 0.05 ±0.003 C20:5 (eicosapentaenoic acid) 0.03 ±0.004 0.03 ±0.002 0.01 ±0.002 0.02 ±0.001 0.01 ±0.001 C24:0 (lignoceric acid) 0.04 ±0.003 0.02 ±0.003 0.14 ±0.002 0.01 ±0.001 0.17 ±0.004 C24:1 (nervonic acid) 0.02 ±0.002 0.01 ±0.002 0.02 ±0.002 0.03 ±0.002 0.02 ±0.001 ∑SFA 17.73 9.98 25.00 10.62 15.43 ∑MUFA 72.55 74.75 18.67 31.64 30.95 ∑PUFA 8.69 15.00 54.86 57.08 52.96 trans FAs 0.40 0.19 0.91 0.55 0.59
† VOO; virgin olive oil, HNO; hazelnut oil, CSO; cotton seed oil, SFO; sunflower oil, SBO; soybean oil †† SFA; saturated fatty acid, MUFA; monounsaturated fatty acid, PUFA; polyunsaturated fatty acid
3.2. PCA and HCA Models for Differentiation of Edible Oils
To differentiate the different types of edible oil samples, the principal components analysis (PCA) and hierarchical cluster analysis (HCA) models were employed. PCAs were performed on the full
(4000–650 cm−1), the functional group (4000–1500 cm–1) and the fingerprint (1500–650 cm–1)
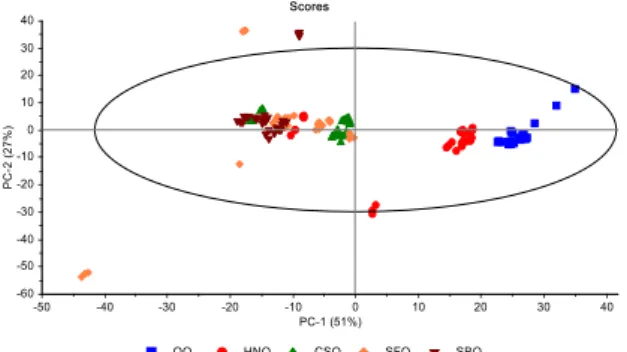
wavenumber regions. PCA is one of the unsupervised multivariate analysis methods used to reduce the dimensionality of large data sets by finding combinations of variables. PCA technique generates a few new variables called principal components (PCs) from linear combinations of the original variables and is commonly applied prior to more complex classification or prediction multivariate analysis methods [1, 29]. The optimal loadings of the first two PCs obtained by conducting score plots on the full wavenumber range are presented in Figure 2a. The score plots show that the different types of edible oils are basically differentiated, and eigen–value of 78% was achieved using
two PCs (PC1= 51%, PC2= 27%). It can be seen from Figure 2a, the differentiation of extra VOO and
other edible oil samples was successfully achieved, especially from refined CSO, SFO and SBO samples. Eight samples of the extra VOOs and ten samples of HNOs in different brands were distinctly located in different regions according to other edible oils. CSOs, SFOs and SBOs in different brands were located in the same region, so that they cannot be distinguished from each others; however two samples of the SFOs and one sample of the SBOs were distinctly located in different locations. It is well known, vegetable oils might have quite similar composition; thus, it is often difficult to differentiate them according to their origins. However, due to its capability as a fingerprint technique, infrared
spectroscopy permits one to differentiate oil types with the spectral changes. Herein, the PCA models were also performed on the wavenumber ranges of functional group and fingerprint regions (Figure 2b and 2c). It is clear from Figure 2b and 2c that eigen–values of 75% and 87% were achieved using two
PCs (PC1= 42%, PC2= 33% and PC1= 75%, PC2= 12%), respectively. The discrimination ability in the
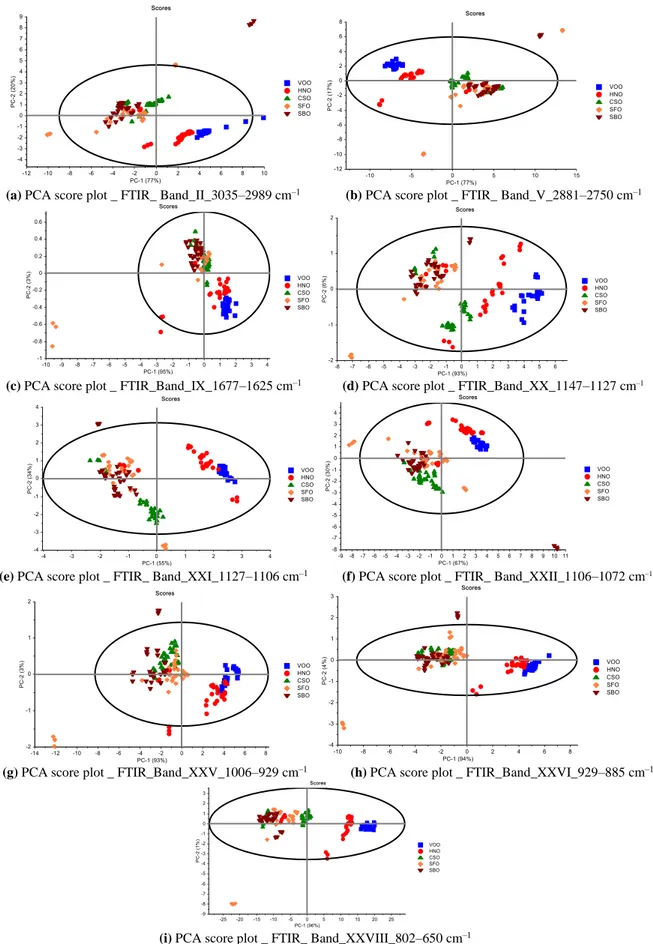
fingerprint region was detected more efficient than the functional group region. In addition, in the fingerprint region of CSO, SFO and SBO samples were well discriminated from each other; whereas in the functional group region all studied samples not well differentiated. As a result, the multivariate data analysis models constructed here appear to be more efficient in that it can group significantly different types of edible oils together and successfully differentiate extra VOO samples from other type of oils. The critical point that must be considered during the multivariate data analyses with FTIR spectra, is the selection of wavenumber ranges [3,6,8,20,25]. To that end, the spectra of edible oils were divided into 28 regions for different wavenumber ranges(see Table 1). PCA models were also constructed on these wavenumber ranges according to the literature and based on the different transmittance peaks of fats and oils (Figure 3 and Supplementary figure 2). Based on the optimization process, the wavenumber ranges
used for PCA are 3035–2989 cm–1 (band II, =C–H (trans) stretching), 2881–2750 cm–1 (band V, –C–H
(CH2) stretching (sym)), 1677–1625 cm–1 (band IX, C=C (cis) stretching), 1147–1127 cm–1 (band XX, –
C–O stretching), 1127–1106 cm–1 (band XXI, –C–O stretching), 1106–1072 cm–1 (band XXII, –C–O
stretching), 1006–929 cm–1 (band XXV, –HC=CH– (trans) bending (out of plane)), 929–885 cm–1 (band
XXVI, –HC=CH– (cis) bending (out of plane)), and 802–650 cm–1 (band XXVIII, C...C bending (out of
plane) and O–H bending (out of plane)). Higher eigen–values were obtained in specific wavenumber ranges; thus, it is evident that PCA models offer well differentiation for different types of edible oils according to their fatty acid characteristics, quality and purity degree.
(a) PCA score plot_VOO and other edible oils_ Full region_4000–650 cm–1
(b) PCA score plot_VOO and other edible oils_ Functional group region_4000–1500 cm–1 (c) PCA score plot_VOO and other edible oils_F ingerprint
region_1500–650 cm–1
Figure 2. Score plots from PCA of FTIR spectra a) in the wavenumber region of 4000–650 cm–1, b) in the functional group wavenumber region of 4000–1500 cm–1, c) in the fingerprint wavenumber region of 1500–650 cm–1 (VOO; Virgin olive oil, HNO; Hazelnut oil, CSO; Cottonseed oil, SFO; Sunflower oil, SBO; Soybean oil)
933
(a) PCA score plot _ FTIR_ Band_II_3035–2989 cm–1 (b) PCA score plot _ FTIR_ Band_V_2881–2750 cm–1
(c) PCA score plot _ FTIR_Band_IX_1677–1625 cm–1 (d) PCA score plot _ FTIR_Band_XX_1147–1127 cm–1
(e) PCA score plot _ FTIR_ Band_XXI_1127–1106 cm–1 (f) PCA score plot _ FTIR_ Band_XXII_1106–1072 cm–1
(g) PCA score plot _ FTIR_Band_XXV_1006–929 cm–1 (h) PCA score plot _ FTIR_Band_XXVI_929–885 cm–1
(i) PCA score plot _ FTIR_ Band_XXVIII_802–650 cm–1
Figure 3. PCA Score plots in the regions of (a) 3035–2989 cm–1 (band II), (b) 2881–2750 cm–1 (band V), (c) 1677–1625 cm–1 (band IX), (d) 1147–1127 cm–1 (band XX), (e) 1127–1106 cm–1 (band XXI), (f) 1106–1072 cm–1 (band XXII), (g) 1006–929 cm–1 (band XXV), (h) 929–885 cm–1 (band XXVI), and (i) 802–650 cm–1 (band XXVIII)
In second part of the classification study, the spectra recorded in the wavenumber regions of 4000–650
cm−1 were used to examine the similarity (or dissimilarity) of the studied oils by means of HCA. HCA
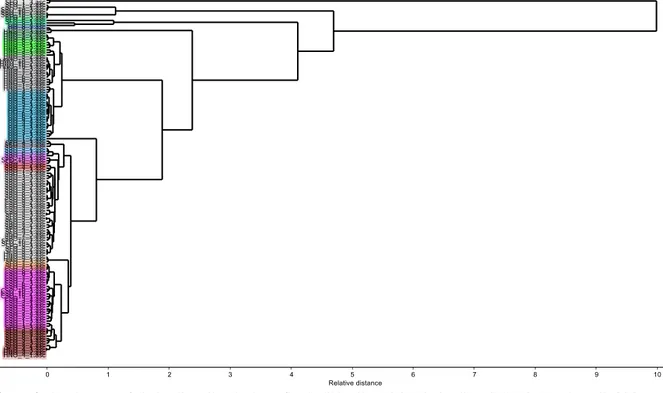
method categorizes the clustering of different samples without any a prior knowledge of the class membership on the basis of a similarity marker (relative distance) and an amalgamation rule that joins similar samples into clusters [5,29]. Figure 4 illustrates the dendrogram for the classification study of samples based on HCA technique. As can be seen from the HCA dendrogram, the clusters were formed based on the relationship between binding distances of different types of edible oils and, it was observed that the types of oil samples successfully differed from each other (Supplementary table 1).
Figure 4. Dendrogram of virgin olive oil and other refined edible oils (VOO; Virgin olive oil, HNO; Hazelnut oil, CSO;
Cottonseed oil, SFO; Sunflower oil, SBO; Soybean oil)
The differentiation of edible oils in the PCA and HCA models could be explained by the differences of their fatty acid profiles and origin (see Table 2 and 3). It is clearly seen from Table 3, the extra VOO samples are composed of average 80% poly– and monounsaturated (MUFA), particularly of oleic acid (70.94–72.97%, 18:1n–9) followed by palmitic acid (12.07–14.03%, 16:0) and minor amounts of linoleic acid (6.31–8.02%). The relative percentages of total saturated (∑SFA), monounsaturated (∑MUFA), and total polyunsaturated (∑PUFA) fatty acid contents for studied oils were also calculated. The fatty acid profile of extra VOO samples (∑SFA= 16.79%–18.04%, ∑MUFA=71.90%– 73.92%, ∑PUFA= 7.27%–9.39%) were quite similar to refined HNO (∑SFA= 9.98%, ∑MUFA=74.75%, ∑PUFA= 15.00%); despite that they are quite different from refined CSO (∑SFA= 25.00%, ∑MUFA= 18.67%, ∑PUFA= 54.86%), SFO samples (∑SFA= 10.62%, ∑MUFA= 31.64%, ∑PUFA= 57.08%) and SBO (∑SFA= 15.43%, ∑MUFA= 30.95%, ∑PUFA= 52.96%). Therefore, despite the similarity of fatty acid profile between extra VOO and refined HNO; all samples of extra VOO well discriminated from other oils, especially from CSO, SFO and SBO samples.
935
Table 3. Fatty acid profiles of the different samples of virgin olive oils, g/100 g of totally fatty acids (%) Fatty acid profile of the different brands of extra VOO samples, g/100 g of totally fatty acids (%) Fatty acids VOO-1 VOO-2 VOO-3 VOO-4 VOO-5 VOO-6 VOO-7 VOO-8 C4:0 (butanoic acid) ±0.001 0.01 ±0.002 0.02 ±0.002 0.01 ±0.001 0.02 ±0.002 0.01 ±0.002 0.02 ±0.002 0.01 ±0.002 0.01 C6:0 (hexanoic acid) ±0.002 0.02 ±0.002 0.02 ±0.002 0.01 ±0.002 0.03 ±0.001 0.03 ±0.001 0.01 ±0.001 0.02 ±0.001 0.03 C8:0 (octanoic acid) ±0.001 0.03 ±0.001 0.02 ±0.001 0.03 ±0.001 0.01 ±0.002 0.04 ±0.002 0.03 ±0.002 0.03 ±0.001 0.02 C10:0 (decanoic acid) ±0.003 0.02 ±0.003 0.01 ±0.001 0.02 ±0.003 0.03 ±0.002 0.01 ±0.001 0.03 ±0.001 0.01 ±0.003 0.03 C12:0 (dodecanoic acid) ±0.005 0.15 ±0.004 0.16 ±0.004 0.21 ±0.004 0.19 ±0.003 0.20 ±0.003 0.22 ±0.002 0.23 ±0.004 0.19 C14:0 (myristic acid) ±0.002 0.03 ±0.002 0.02 ±0.001 0.04 ±0.002 0.04 ±0.001 0.02 ±0.001 0.02 ±0.001 0.04 ±0.001 0.02 C14:1 (myristoleic acid, n9) 0.01 ±0.001 ±0.001 0.02 ±0.001 0.02 ±0.001 0.02 ±0.002 0.02 ±0.002 0.02 ±0.002 0.02 ±0.001 0.02 C15:0 (pentadecanoic acid) 0.01 ±0.001 ±0.002 0.02 ±0.002 0.03 ±0.001 0.02 ±0.002 0.03 ±0.002 0.01 ±0.001 0.03 ±0.002 0.01 C15:1 trans ±0.001 0.02 ±0.001 0.01 ±0.002 0.01 ±0.001 0.01 ±0.002 0.03 ±0.001 0.03 ±0.001 0.01 ±0.001 0.02 C15:1 (ginkgolic acid) ±0.002 0.01 ±0.001 0.01 ±0.003 0.02 ±0.003 0.02 ±0.001 0.01 ±0.001 0.02 ±0.001 0.02 ±0.001 0.01 C16:0 (palmitic acid) ±0.050 13.63 ±0.040 12.97 ±0.060 12.07 ±0.040 12.85 ±0.040 13.02 ±0.050 12.56 ±0.040 12.87 ±0.070 14.03 C16:1 trans ±0.005 0.27 ±0.003 0.21 ±0.004 0.18 ±0.004 0.34 ±0.004 0.23 ±0.004 0.24 ±0.006 0.32 ±0.007 0.42 C16:1 (palmitoleic acid) ±0.006 0.75 ±0.003 0.82 ±0.005 0.86 ±0.005 0.68 ±0.004 0.71 ±0.003 0.81 ±0.004 0.71 ±0.009 0.80 C17:0 (heptadecanoic acid) 0.20 ±0.001 ±0.002 0.14 ±0.002 0.18 ±0.001 0.30 ±0.002 0.19 ±0.002 0.25 ±0.003 0.11 ±0.002 0.10 C17:1 (heptadecanoleic acid) 0.06 ±0.004 ±0.002 0.05 ±0.003 0.07 ±0.003 0.05 ±0.002 0.05 ±0.002 0.07 ±0.002 0.04 ±0.004 0.06 C18:0 (stearic acid) ±0.010 2.75 ±0.013 2.58 ±0.030 3.21 ±0.020 3.24 ±0.010 3.02 ±0.015 2.82 ±0.015 3.05 ±0.010 3.01 C18:1 trans ±0.003 0.05 ±0.002 0.04 ±0.004 0.06 ±0.002 0.06 ±0.002 0.04 ±0.002 0.06 ±0.002 0.06 ±0.003 0.05 C18:1 (ω9)(oleic acid) ±0.070 71.67 ±0.060 70.94 ±0.060 72.56 ±0.050 72.29 ±0.050 71.86 72.84 ±0.06 ±0.060 71.94 ±0.060 72.97 C18:2 trans ±0.002 0.06 ±0.001 0.04 ±0.003 0.09 ±0.001 0.05 ±0.001 0.04 ±0.002 0.08 ±0.003 0.07 ±0.001 0.05 C18:2 (ω6) (linoleic acid) ±0.006 7.31 ±0.005 7.52 ±0.005 8.02 ±0.002 7.21 ±0.004 7.53 ±0.006 7.55 ±0.005 7.27 ±0.006 6.31 C18:3 (ω6) (linolenic acid) 0.02 ±0.002 ±0.001 0.03 ±0.001 0.05 ±0.003 0.03 ±0.002 0.03 ±0.001 0.02 ±0.001 0.02 ±0.001 0.02 C20:0 (arachidic acid) ±0.003 0.37 ±0.002 0.46 ±0.004 0.43 ±0.004 0.41 ±0.001 0.44 ±0.002 0.48 ±0.002 0.40 ±0.001 0.40 C18:3 (ω3) (linolenic acid) 0.82 ±0.004 ±0.004 0.76 ±0.006 0.97 ±0.002 0.79 ±0.002 0.73 ±0.002 0.79 ±0.003 0.78 ±0.005 0.63 C20:1 (eicosenoic acid) ±0.002 0.02 ±0.001 0.03 ±0.001 0.03 ±0.003 0.03 ±0.001 0.03 ±0.001 0.04 ±0.001 0.03 ±0.002 0.01 C20:2 (eicosadienoic acid) 0.01 ±0.002 ±0.001 0.01 ±0.001 0.02 ±0.001 0.02 ±0.002 0.02 ±0.004 0.02 ±0.001 0.02 ±0.001 0.03 C22:1 (erucic acid) ±0.002 0.01 ±0.001 0.02 ±0.001 0.02 ±0.003 0.03 ±0.002 0.03 ±0.001 0.02 ±0.001 0.02 ±0.002 0.02 C20:4 (lignoceric acid) ±0.001 0.22 ±0.002 0.28 ±0.003 0.27 ±0.002 0.24 ±0.002 0.25 ±0.002 0.31 ±0.002 0.28 ±0.002 0.25 C23:0 (tricosylic acid) ±0.001 0.47 ±0.003 0.54 ±0.002 0.52 ±0.003 0.55 ±0.003 0.52 ±0.004 0.43 ±0.004 0.57 ±0.001 0.50 C22:2 (cis-13,16-docosa. acid) 0.01 ±0.002 ±0.003 0.02 ±0.003 0.02 ±0.003 0.02 ±0.001 0.02 ±0.002 0.02 ±0.003 0.02 ±0.001 0.02 C20:5 (eicosapentaenoic acid) 0.03 ±0.004 ±0.001 0.04 ±0.002 0.04 ±0.002 0.05 ±0.002 0.01 ±0.001 0.02 ±0.005 0.02 ±0.001 0.01 C24:0 (lignoceric acid) ±0.003 0.04 ±0.002 0.02 ±0.001 0.03 ±0.001 0.06 ±0.002 0.03 ±0.002 0.03 ±0.002 0.04 ±0.001 0.05 C24:1 (nervonic acid) ±0.002 0.02 ±0.001 0.01 ±0.001 0.05 ±0.001 0.03 ±0.002 0.01 ±0.001 0.03 ±0.002 0.03 ±0.002 0.03 ∑SFA 17.73 16.98 16.79 17.75 17.56 16.91 17.41 18.40 ∑MUFA 72.55 71.90 73.63 73.15 72.72 73.85 72.81 73.92 ∑PUFA 8.69 8.66 9.39 9.36 8.59 8.73 8.41 7.27 trans FAs 0.40 0.30 0.34 0.46 0.34 0.41 0.46 0.54
† VOO; virgin olive oil
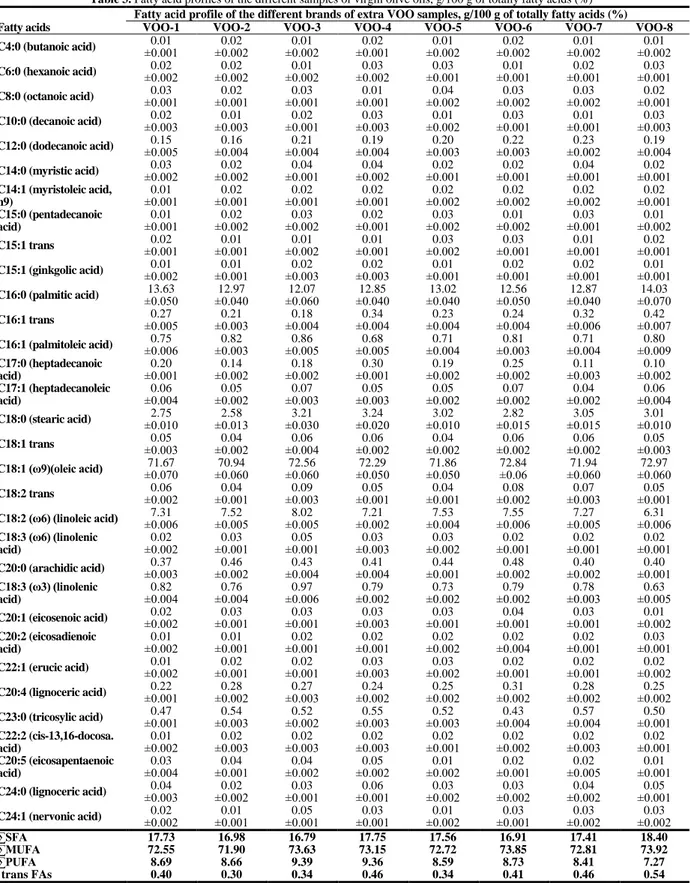
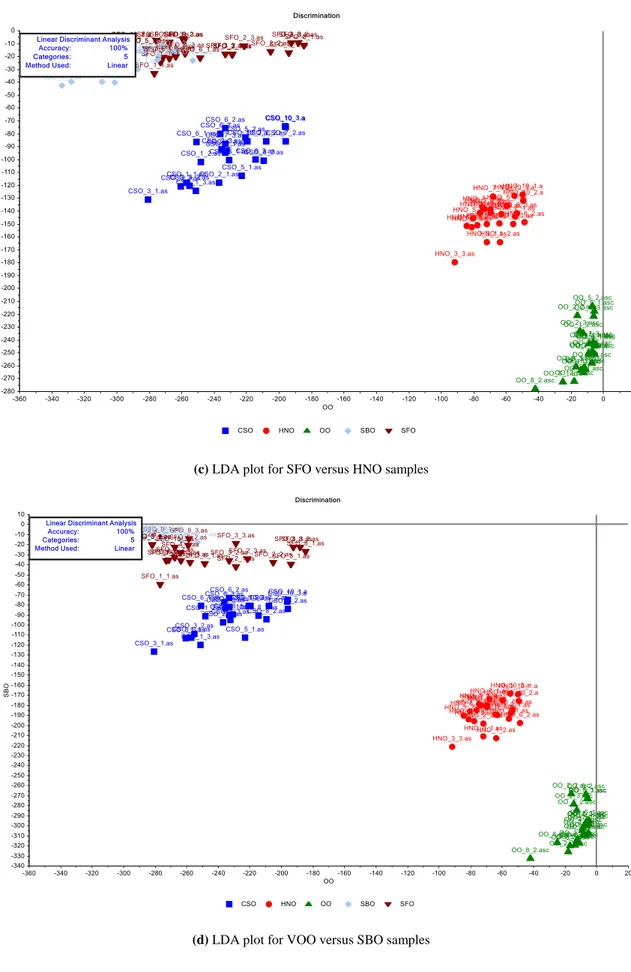
3.2. LDA and SIMCA Models for Discrimination of Extra VOOs from Refined Edible Oils
To obtain the best performance statistics, the models of linear discriminant analysis (LDA) and soft independent modeling of class analogies (SIMCA) were generated using 5% significance level for the critical distance. LDA is a supervised classification technique in which the number of categories and the samples belonging to each category are previously defined. The criterion of LDA for selection of latent variables maximizes the differences between categories and minimizes the variances within categories [25,29]. LDA models were constructed with five predictors (extra virgin olive, hazelnut, cottonseed, sunflower, and soybean oils) on simplified data sets. For this purpose, twenty nine transmittance values recorded in the selected wavenumbers (remarked as nominal frequencies in Table 1) were analyzed. Figure 5 presents the LDA plots of extra VOOs versus the samples of refined HNO, CSO, SFO and SBO. It can be seen from Figure 5, the LDA model provided good results for the discrimination of extra VOO samples from other edible oils. A total of 100% of studied samples were correctly classified on the basis of their origin in calibration and in cross-validation by LDA. Two brands of HNO (HNO-4 and HNO-9), two brands of CSO (CSO-4 and CSO-9) and one brand of SFO (SFO-7) samples were observed as doubtful samples in PCA and HCA models, for this reason these samples were processed as “testing set” in LDA models. HNO and CSO samples were defined in SBO and SFO classes, respectively. Other samples were processed as “training set” in LDA models and all of them were correctly classified in their own classes (Supplementary table 2).
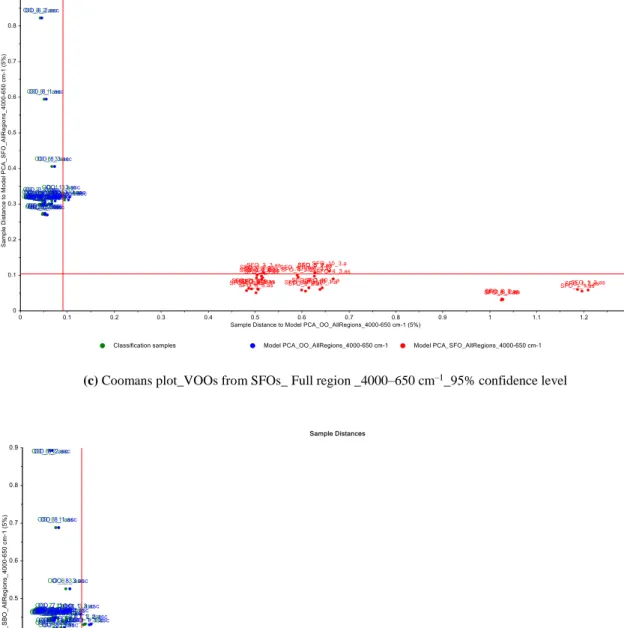
In second part, SIMCA models were constructed by using the wavenumber region of 4000–650 cm-1
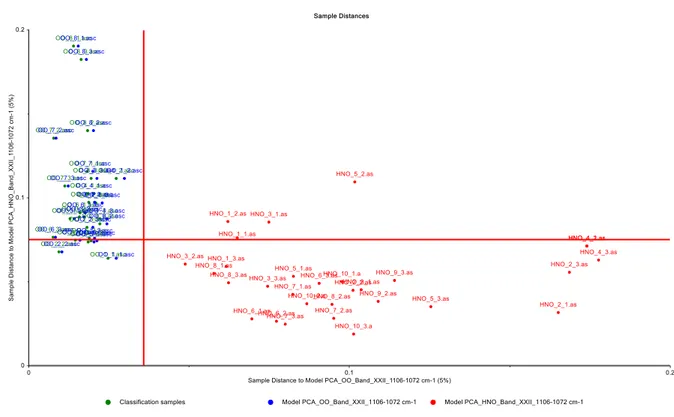
to more clearly visualize the discrimination of extra VOO samples from other edible oils. SIMCA technique calculates a PCA model for each specific class and offers better results than other modeling techniques. Coomans plots obtained from SIMCA models are also useful tools for visualizing the results of discrimination analysis. To construct the Coomans plot, PCA model is employed to each group separately and two group models are generated against each other with the certain critical levels as straight lines representing the boundaries [1,29,30]. H.erein, the SIMCA models were based on two components; different samples of extra VOO and other edible oil samples (Figure 6). In these plots, the x–axis shows the distance to extra VOO samples, while the y–axis shows the distance to other edible oil samples (hazelnut, cottonseed, sunflower, and soybean oils). It is clear from Figure 6 that two groups are well separated and each groups located closer to their respective axis. In addition, no misclassification was reported for the SIMCA models constructed for the discrimination of VOOs from SFO, SBO and CSO samples, with an accuracy of 95%. Most samples of extra VOO and refined HNO are correctly located in their region; however, a few brands of samples are not located in their region. This should be expected because of the similarities of fatty acid profiles between extra VOOs and refined HNOs. To achieve the best models for the discrimination of extra VOOs from refined HNOs, SIMCA models were also generated by using optimal wavenumber ranges. Figure 7 illustrates the Coomans plots for the classification of VOOs and refined HNOs in the wavenumber regions of
3035–2989 cm–1 (band II), 2946–2881 cm–1 (band IV), 2881–2750 cm–1 (band V), 1486–1445 cm–1
(band XI), 1407–1390 cm–1 (band XIV), 1290–1215 cm–1 (band XVIII), 1147–1127 cm–1 (band XX),
1127–1106 cm–1 (band XXI) and 1106–1072 cm–1 (band XXII). It is clear from these plots that the
classes of extra VOO and refined HNO samples are basically well separated. Therefore, FTIR spectra recorded in the full and specific wavenumber ranges could potentially be valuable for the discrimination or classification of extra VOOs from other edible oils.
937
(a) LDA plot for VOO versus HNO samples
(c) LDA plot for SFO versus HNO samples
(d) LDA plot for VOO versus SBO samples
939
(a) Coomans plot_VOOs from HNOs_ Full region _4000–650 cm–1_95% confidence level
(c) Coomans plot_VOOs from SFOs_ Full region _4000–650 cm–1_95% confidence level
(d) Coomans plot_VOOs from SBOs_ Full region _4000–650 cm–1_95% confidence level
Figure 6. Coomans plots for the classification of VOOs and a) refined HNOs, b) refined CSOs, c) refined SFOs, 2 and d) refined SBOs, from PCA of FTIR spectra in the wavenumber region of 4000–650 cm–1 (95% confidence intervals) (VOO; Virgin olive oil, HNO; Hazelnut oil, CSO; Cottonseed oil, SFO; Sunflower oil, SBO; Soybean oil)
941
(a) Coomans plot_VOO from HNO_BandII_3035–2989 cm–1
(c) Coomans plot_VOO from HNO_BandV_2881–2750 cm–1
943
(e) Coomans plot_VOO from HNO_BandXIV_1407–1390 cm–1
(g) Coomans plot_VOO from HNO_BandXX_1147–1127 cm–1
945
(i) Coomans plot_VOO from HNO_BandXXII_1106–1072 cm–1
Figure 7. Coomans plot in the wavenumber regions of (a) 3035–2989 cm–1 (band II), (b) 2946–2881 cm–1 (band IV), (c) 2881–2750 cm–1 (band V), (d) 1486–1445 cm–1 (band XI), (e) 1407–1390 cm–1 (band XIV), (f) 1290–1215 cm–1 (band XVIII), (g) 1147–1127 cm–1 (band XX), (h) 1127–1106 cm–1 (band XXI), (i) 1106–1072 cm–1 (band XXII
4.CONCLUSION
Simple, fast, non-destructive and environmentally friendly methods for the classification and differentiation of the different types of edible oils were demonstrated based on the combination of ATR–FTIR spectroscopy with multivariate data analysis. Using the full and different wavenumber ranges, the edible oil samples were correctly differentiated with an excellent resolution among the categories. LDA models constructed with five predictors, and a total of 100% of samples from different types and brands were correctly classified. Moreover, no misclassification was reported for the SIMCA models constructed for the discrimination of VOOs from SFO, SBO and CSO samples with an accuracy of 95%. It was demonstrated that the combination of ATR–FTIR with multivariate data analyses provides a promising approach capable to verify the authenticity of edible oils. Thus, the present strategy is experimentally simple and takes less than one minute, and can be extended to incorporate more edible oil sample variability and to include other possible authenticates.
ACKNOWLEDGEMENTS
The study is supported financially by the Scientific Research Project Center of Karamanoglu Mehmetbey University (Project number 18-M-17). The authors would also like to thank TUBITAK under the 2219–Research Fellowship Program for International Postdoctoral for providing the financial support to carry out this research work.
REFERENCES
[1] Gurdeniz G, Ozen B, Tokatli F. Classification of Turkish olive oils with respect to cultivar , geographic origin and harvest year , using fatty acid profile and mid-IR spectroscopy. Eur Food Res Technol 2008;227:1275–1281.
[2] Lohumi S, Lee S, Lee H, et al. A review of vibrational spectroscopic techniques for the detection of food authenticity and adulteration. Trends Food Sci Technol 2015;46:85–98.
[3] Rohman A, Man YBC. Fourier transform infrared (FTIR) spectroscopy for analysis of extra virgin olive oil adulterated with palm oil. Food Res Int 2010;43:886–892.
[4] Bevilacqua M, Bucci R, Magrì AD, et al. Tracing the origin of extra virgin olive oils by infrared spectroscopy and chemometrics: A case study. Anal Chim Acta 2012;717:39–51.
[5] Fragaki G, Spyros A, Siragakis G, et al. Detection of Extra Virgin Olive Oil Adulteration with Lampante Olive Oil and Refined Olive Oil Using Nuclear Magnetic Resonance Spectroscopy and Multivariate Statistical Analysis. J Agric Food Chem 2005;53:2810–2806.
[6] Lerma-Garcia M, Ramis-Ramos G, Herrero-Martinez J, et al. Authentication of extra virgin olive oils by Fourier-transform infrared spectroscopy. Food Chem 2010;118:78–83.
[7] Ozulku G, Yildirim RM, Toker OS, et al. Rapid detection of adulteration of cold pressed sesame oil adultered with hazelnut , canola , and sun fl ower oils using ATR-FTIR spectroscopy combined with chemometric. Food Control 2017;82:212–216.
[8] Zhang Q, Liu C, Sun Z, et al. Authentication of edible vegetable oils adulterated with used frying oil by Fourier Transform Infrared Spectroscopy. Food Chem 2012;132:1607–1613.
[9] De P, Dominguez-vidal A, Bosque-sendra JM, et al. Olive oil assessment in edible oil blends by means of ATR-FTIR and chemometrics. Food Control 2012;23:449–455.
[10] Zhao X, Dong D, Zheng W. Discrimination of Adulterated Sesame Oil Using Mid-infrared Spectroscopy and Chemometrics. Food Anal Methods 2015;8:2308–2314.
[11] Downey G, Mcintyre P, Davies AN. Detecting and Quantifying Sunflower Oil Adulteration in Extra Virgin Olive Oils from the Eastern Mediterranean by Visible and Near-Infrared Spectroscopy. J Agric Food Chem 2002;50:5520–5525.
[12] Kasemsumran S, Kang N, Christy A, et al. Partial Least Squares Processing of Near ‐ Infrared
Spectra for Discrimination and Quantification of Adulterated Olive Oils. Spectrosc Lett 2007;38:839–851.
[13] Tan J, Li R, Jiang Z, et al. Synchronous front-face fluorescence spectroscopy for authentication of the adulteration of edible vegetable oil with refined used frying oil. Food Chem 2017;217:274–280. [14] Durán I, Domínguez J, Airado D, et al. Detection and quanti fi cation of extra virgin olive oil
adulteration by means of auto fl uorescence excitation-emission pro fi les combined with multi-way classi fi cation. Talanta 2018;178:751–762.
[15] Ozturk B, Dıraman H, Ozdemir D. The Chemometric Classification of Ayvalık and Memecik Virgin Olive Oils Exposed to Dayligth and Dark Based on Their Spectroscopic Data. Gıda 2014;39:87–94.
947
[16] Dıraman H, Ozturk B, Ozdemir D. Chemometric Classification of Virgin Olive Oils Produced from Gemlik Cultivar by using Some Choromatographic and Spectroscopic Data. Gıda 2014;39:79–86.
[17] Lopez-Diez EC, Bianchi G, Goodacre R. Rapid Quantitative Assessment of the Adulteration of Virgin Olive Oils with Hazelnut Oils Using Raman Spectroscopy and. J Agric Food Chem 2003;51:6145–150.
[18] Yang H, Irudayaraj J, Paradkar MM. Discriminant analysis of edible oils and fats by. Food Chem 2005;93:25–32.
[19] Mendes TO, Rocha RA, Anjos VDC, et al. Quantification of Extra-virgin Olive Oil Adulteration with Soybean Oil : a Comparative Study of NIR , MIR , and Raman Spectroscopy Associated with Chemometric Approaches. Food Anal Methods 2015;8:2339–2346.
[20] Vlachos N, Skopelitis Y, Psaroudaki M, et al. Applications of Fourier transform-infrared spectroscopy to edible oils. Anal Chim Acta 2006;574:459–465.
[21] Georgouli K, Martinez J, Rincon D, et al. Continuous statistical modelling for rapid detection of adulteration of extra virgin olive oil using mid infrared and Raman spectroscopic data. Food Chem 2017;217:735–742.
[22] Pizarro C, Rodriguez-Tecedor S, Perez-del-Notario N, et al. Classification of Spanish extra virgin olive oils by data fusion of visible spectroscopic fingerprints and chemical descriptors. Food Chem 2013;138:915–922.
[23] Gouvinhas I, Almeida JMMM De, Carvalho T, et al. Discrimination and characterisation of extra virgin olive oils from three cultivars in different maturation stages using Fourier transform infrared spectroscopy in tandem with chemometrics. Food Chem 2015;174:226–232.
[24] Yildiz G, Huseyin T. Quantification of soybean oil adulteration in extra virgin olive oil using portable raman spectroscopy. Food Meas Charecterization 2017;11:523–529.
[25] Saucedo-hern Y, Jes M, Herrero-martínez M, et al. Classification of Pumpkin Seed Oils According to Their Species and Genetic Variety by Attenuated Total Reflection Fourier-Transform Infrared Spectroscopy. J Agric Food Chem 2011;59:4125–4129.
[26] Savitzky A, Golay MJE. Smoothing and Differentiation of Data by Simplified Least Squares Procedures. Anal Chem 1964;36:1627–1639.
[27] De-Hua D, Xu L, Ye Z-H, et al. FTIR Spectroscopy and Chemometric Class Modeling Techniques for Authentication of Chinese Sesame Oil. J Am Oil Chem Soc 2012;89:1003–1009. [28] Arslan FN, Sapci AN, Duru F, et al. A study on monitoring of frying performance and oxidative
stability of cottonseed and palm oil blends in comparison with original oils. Int J Food Prop 2017;20:704–717.
[29] Borràs E, Ferré J, Boqué R, et al. Data fusion methodologies for food and beverage authentication and quality assessment e A review s a , Joan Ferr e Eva Borr a. Anal Chim Acta 2015;891:1–14. [30] Rohman A, Man YBC, Yusof FM. The Use of FTIR Spectroscopy and Chemometrics for Rapid