Available on-line at: www.oapub.org/edu
doi: 10.5281/zenodo.1241059 Volume 4 │ Issue 5 │ 2018
EXAMINATION OF THE EFFECTS OF 8-WEEKS
CORE STABILIZATION TRAINING ON FMS
(FUNCTIONAL MOVEMENT SCREEN) TEST SCORES
APPLIED TO A 12-14 AGE GROUP OF MALE BASKETBALL PLAYERS
Özgür Doğan1i,
Seyfi Savaş2,
Ali Zorlular3
1Gazi University, Health Science Institute Training and Movement Science and
Istanbul Gelisim University, Exercise and Sports Science, Turkey
2Gazi University, Sports Science Faculty, Turkey 3Gazi University, Health Science Faculty, Turkey
Abstract:
The core area is made up of muscles, which surrounds the human body like a corset and acts in the stabilization of the body. Core stabilization training can strengthen muscles in this area and provide better stabilization. The purpose of this study is; investigate of the effect of 8-weeks core stabilization training on the FMS (Functional Movement Screen) test scores of 12-14 age group male basketballs. 27 healthy athletes (Experiment Group n=14, 13.14±0.663 ages – Control Group n=13, 13.15±0.801 ages) participated in the study. The experimental group was given 8 weeks to core stabilization training. Before the training, the Functional Movement Screen test was applied to the Pre-post test and the scores were evaluated. Statistical analysis SPSS 22 software package was performed taking into account the confidence parameter (p <0.05). Median and IQR values were used in the descriptive statistics because the data were not normally distributed. Statistical significance was analyzed between FMS (Functional Movement Screen) pre-post test scores according to the analysis results. There was no significant difference (r:0.59; p<0.05) in the pre-post FMS values for the Control Group. When the FMS values were compared for the Experimental Group, a significant difference was found (r:0.42; p<0.05). This study has achieved the result that FMS developed the movement patterns and the performance of the performance athletes increased the quality of the functional movements. Results that are more accurate can be achieved with a study conducted with a larger sample group.
The article has been presented with the same name at 15th International Sport Sciences Congress on November 15-18, Antalya, Turkey.
Keywords: basketball, core, stabilization, functional movement screen 1. Introduction
The core stabilization is lumbar spine and the ability to stabilize the pelvis area are a function of strong, well-synchronized trunk muscles (Kong, Cho and Park, 2013). A stable spine forms the basis of functional movements, is important for athletic performance (Kong etc., 2013; Leetun, Ireland, Willson, Ballantyne, and Davis, 2004), and is a postural control and balance aids (Oliver and Adams-Blair, 2010).
Typically, a coach or physical educator would define core stability as a level of strength or endurance of the abdominal musculature. But the core, described as the lumbopelvic-hip complex, comprises many more muscles than just the abdominals (Wilson, Dougherty, Ireland and Davis, 2005).
One of the most important priorities for all athletes should be to ensure adequate conditioning of the core musculature. In recent years, there has been considerable literature in both the popular media and scientific journals on the importance of these muscles for effective movement and sports performance (Willardson, 2014).
One of the key issues in prescribing appropriate exercises for the core musculature is establishing a person’s level of core muscle function, including the ability to stabilize the trunk and to move the trunk (Willardson, 2014).
Functional Movement Screen (FMS), an increasingly popular test battery, is designed to evaluate body and core strength. It consists of 7 basic patterns of motion; Each of the 7 movements is scored between 0 and 3 based on specific objective criteria (Cook, Burton and Hoogenboom, 2006; Cook, Burton, Kiesel Rose and Bryant, 2010).
2. Methods
The experimental method was included in the research. Twenty-seven healthy male athletes participated in the study (Experimental Group n=14, 13.14 ± 0.663 years old - Control Group n=13, 13.15 ± 0.801 years old). The research population: 12-14 age group basketball in Turkey, the sample of the Istbol Sports Club in Istanbul actively playing basketball 12-14 age group constitutes 27 volunteer basketball players.
Experimental method; 8 weeks of core stabilization training was given to the experimental group. Scores were assessed by performing Functional Movement Screen test before and after training. SPSS 22 data program was used for statistical analysis. The difference between pre-test and post-test arithmetic mean of experiment and control groups (p <0.05) was evaluated by taking the confidence coefficient into account. Median and IQR values were used in the descriptive statistics because the data were not normally distributed. The Wilcoxon analysis was used to examine the difference between pre-test and post-test.
2.1 FMS Scoring Method A. Scoring
The FMS is comprised of seven separate tests, and each test is ranked with a score from zero to three with a high score corresponding to proper movement. A score of three indicates the movement is complete, a score of two demonstrates some level of compensation, a score of one suggests the pattern is incomplete, and a score of zero indicates pain is present (Cook etc., 2010).
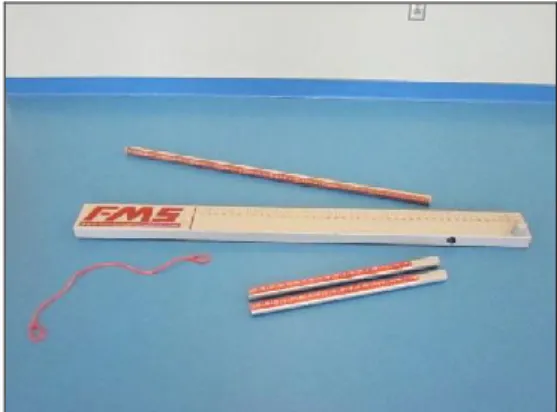
B. Equipment
The required equipment includes a four-foot dowel rod, two smaller dowel rods, a two-by-six board, and an elastic band. A picture of the equipment is provided in Figure 1.
Figure 1: The four-foot dowel rod, two smaller rods, two-by-six board,
and elastic band are pictured to the left
C. The Seven Tests
The following explains the purposes and implications of each of the seven FMS tests. A written description is provided for the tests and clearing exams. A scoring rubric is listed in Table 1.
Table 1: A Rubric Containing the Written Descriptions of Scoring Guidelines
for the Individual FMS Tests
III II I
Deep Squat *Upper Torso is parallel with tibia or towards vertical
*Femur below horizontal *Knees aligned with the feet
*Dowel aligned within footprint
*Upper Torso is parallel with tibia or towards vertical
*Femur below horizontal *Knees aligned with the feet
*Dowel aligned within footprint
*Upper Torso and tibia are not parallel
*Femur is not below horizontal
*Knees are not aligned over the feet
*Lumbar flexion is noted
Hurdle Step *Hips, knees and ankles remain aligned in the sagittal
*Minimal to no movement
*Alignment is lost between hips, knees and ankles *Movement is noted in lumbar spine
*Contact between and hurdle
noted in the lumbar spine *Dowel and hurdle remain parallel
remain parallel
In-Line Lunge *Dowel contacts remain with
L-spine extension *No torso movement is noted
*Dowel and feet remain in sagittal plane
*Knee touches board behind
the heel of the front foot
*Dowel contacts do not remain with L-spine extension
*Movement is noted torso *Dowel and feet do not remain in the sagittal plane *Knee does not touch board
behind the heel of the front foot
*Loss of balance is noted
Shoulder Mobility
*Fists are within one hand length
*Fists are within one and a half hand lengths
*Fists are not within one and a half hand
lengths Active Straight
Leg Raise
*Ankle/dowel reside between mid-thigh and ASIS
*Ankle/dowel reside between mid-thigh and mid-patella/
joint line
*Ankle/dowel reside below mid-patella/ joint line Trunk Stability Push-Up *Males perform 1 repetition
with thumbs aligned with the
top of the forehead *Females perform 1 repetition with thumbs aligned with chin
*Males perform 1 repetition
with thumbs aligned with the
chin
*Females perform 1 repetition with thumbs aligned with clavicle
*Males are unable to perform 1
repetition with thumbs aligned with the chin
*Females are unable to perform 1
repetition with thumbs aligned with clavicle Rotary
Stability
*Performs 1 correct unilateral repetition while keeping spine parallel to board
*Knee and elbow touch in line over the board
*Performs 1 correct diagonal
repetition while keeping spine parallel to the board *Knee and elbow touch in line over the board
*Inability to perform diagonal repetition
*0 - The athlete will receive a score of zero if pain is associated with any portion of these tests or clearance tests. A medical professional should perform a thorough evaluation of the painful area.
2.2 Validity
Test validity must be discussed to know that the results of a measurement are meaningful. Validity is the “soundness of the interpretations of test scores” or the degree to which a test measures what it is supposed to measure (Wood, 2011). In order for a measurement to be valid, it must be both relevant and reliable. This section will investigate the relevance and reliability of the FMS by examining existing research. Since the FMS is a fairly new screen (Cook and Burton, 2012), limited research is currently available. However, the current literature seems to indicate the screen’s degree of relevancy and reliability (and therefore its validity).
2.3 Reliability
Reliability is the ability of a test to detect consistent and precise differences between subjects across test occasions (Wood, 2011). In other words, if the FMS is administered multiple times, reliability is the consistency of scoring over repeated tests. A screen cannot be reliable if scores are not consistent from one rater (intra-rater reliability) or between raters (inter-rater reliability).
3. Results
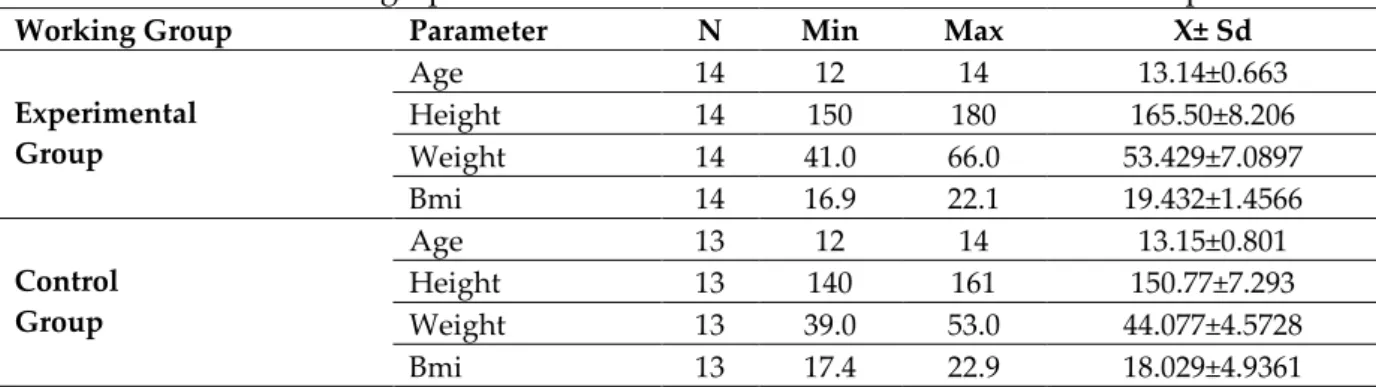
Table 2: Demographic Information and Standard Deviations of Participants
Working Group Parameter N Min Max X± Sd
Experimental Group Age 14 12 14 13.14±0.663 Height 14 150 180 165.50±8.206 Weight 14 41.0 66.0 53.429±7.0897 Bmi 14 16.9 22.1 19.432±1.4566 Control Group Age 13 12 14 13.15±0.801 Height 13 140 161 150.77±7.293 Weight 13 39.0 53.0 44.077±4.5728 Bmi 13 17.4 22.9 18.029±4.9361
In Table 2, when the demographic information and standard deviations of the participants are examined, it is seen that the Experimental Group has significant improvement in the pre-test and post-test scores.
Table 3: Participant's Functional Movement Analysis
(FMS) Scores and Standard Deviations
Working Group FMS N Min Max X± Sd
Experimental Group Ön test 14 9 19 13.50±3.368 Son test 14 9 19 15.14±3.110 Control Group Ön test 13 9 16 12.31±2.057 Son test 13 9 16 12.69±2.097
Table 3 shows that when the standard deviations of the pre-test and post-test scores of the participants were examined, there was a significant improvement in the pre-test and post-test scores of the Experimental Group.
Table 4: Difference Analysis of Participants' Performance Measures
Working Group FMS N X± Sd Z p Experimental Group Pre-test 14 13.50±3.368 -2.032 0.042* Post-test 14 15.14±3.110 Control Group Pre-test 13 12.31±2.057 -1.890 0.059 Post-test 13 12.69±2.097
In Table 4, the standard deviations of the participants' Functional Movement Analysis pretest and posttest scores were tested by the Wilcoxon Difference Analysis test. A
significant difference was found in the pre-test post-test results (r: 0.042; p <0.05) for the experimental group.
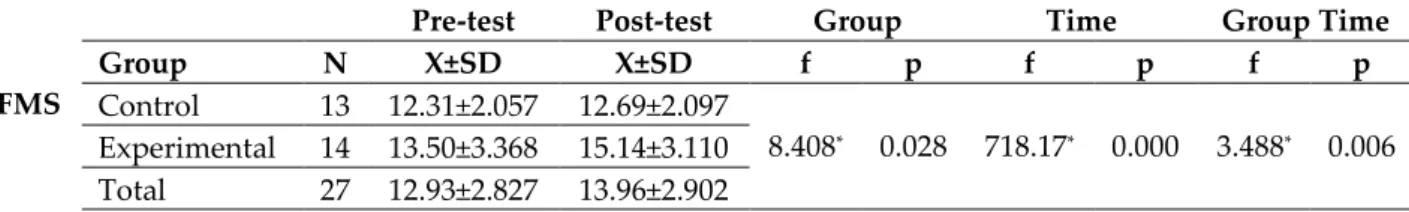
Table 5: Difference Analysis between FMS Preliminary and Final Test Measurements
When FMS values were examined in Table 5, a significant difference was found between the groups (f = 8.408; p <0.05) and over time (f = 718.17; p <0.05). There was a significant difference in time in both groups. There was the statistically significant difference between group and time interaction (f = 3.488, p <0.05). This difference appears to be due to significant improvement in the experimental group in the 8-weeks period.
4. Discussion
The main purpose of this study was to examine the effect of core stabilization training on FMS scores and the second purpose was to examine the development of FMS scores between experimental and control groups at the end of 8 weeks of training. When the pretest and posttest results of the control and experimental groups were examined with the 8 weeks core stabilization training, the experimental group showed a significant increase in the FMS scores at the end of the 8-week training session (Pre-Test: 13.50 ± 3.368, Post-Test: 15.14 ± 3.110, p <0.05) (Table 4).
Contrary to this study, in a study conducted by Frost et al. (2012), surprisingly, the mean FMS scores did not change after 12 weeks of training and there was no difference between the 3 groups. At first glance, it was understood that supervised exercise programs did not simply affect the quality of movement. If the control group did not change and the interventions had no effect on the scores, the only plausible explanation was that training was not transferred to non-exercise performance (ie, FMS score) (Frost, Beach, Callaghan, and McGill, 2012).
When the literature is examined, it is seen that Mitchell and colleagues found positive correlations both in the study they performed and in the study done by Okada and colleagues in both total FMS scores and core strength scores (Mitchell, Johnson, and Adamson, 2015; Okada, Huxel, and Nesser, 2011).
Perry and Koehle (2013) found on their study, college sports (n=13) or professional footballers, where mean FMS scores of (16.9±3.0) have been reported suggesting that active sports participation is indeed reflected in the FMS outcome score. In our study, the FMS scores were found (15.14 ± 3.110, p <0.05) in the experimental Pre-test Post-test Group Time Group Time FMS Group N X±SD X±SD f p f p f p Control 13 12.31±2.057 12.69±2.097 8.408* 0.028 718.17* 0.000 3.488* 0.006 Experimental 14 13.50±3.368 15.14±3.110 Total 27 12.93±2.827 13.96±2.902
group after training (Table 4). It was possible for 12-14 age group athletes to reach the FMS score at the elite athlete level after 8 weeks of training.
Cowen found in his study observed a large positive impact on the total FMS scores (+3.2), with significant improvements in trunk flexibility, but also a reduction in musculoskeletal pain reported postintervention (Cowen, 2010). In our study, there was a positive increase in FMS total scores after training (+ 1.64 ± 3.110, p <0.05) (Table 4).
5. Conclusion
Kiesel et al. researched that in their study has concluded that corrective strategies can increase FMS scores (Kiesel, Plisky, and Butler, 2009). Four recent studies have suggested a cutoff score of 14 (Chorba, Chorba, Bouillon, Overmyer, and Landis, 2010; Kiesel, Plisky, and Voight, 2007; Kiesel et al. 2009, Wieczorkowski, 2010). Other studies have suggested a different cutoff score (Peate, Bates, Lunda, Francis, and Bellamy, 2007) or the cutoff score of 14 should be used with caution (Schneiders, Davidsson, Horman, Sullivan, 2011). In our study, it shows that 8-weeks core training which we planned progressing the FMS scores as much as the suggested cutoff score (Pre-Test: 13.50±3.368; Post-Test:15.14±3.110, p<0.05) (Table 5.)
However, due to the litany of variables in the literature and the lack of depth on the subject, more research is needed to suggest that the FMS should be used for pre-competition screening in basketball
References
1. Chorba, R., Chorba, D., Bouillon, L., Overmyer, C., & Landis, J. Use of a Functional Movement Screening tool to determine injury risk in female collegiate athletes. North American Journal of Sports Therapy, 5(2), 47–54, 2010.
2. Cook, G, Burton, L, and Hoogenboom, B. Pre-participation screening: The use of fundamental movements as an assessment of function—Part 1. N Am J Sports Phys Ther 1: 62–72, 2006.
3. Cook, G, Burton, L, Kiesel, K, Rose, G, and Bryant, M. Functional Movement Screen Descriptions, in Movement: Functional Movement Systems: Screening, Assessment and Corrective Strategies. Santa Cruz, California: On Target Publications, 2010. pp. 81–106.
4. Cook, G., & Burton, L. (2012). FMS History. functionalmovement.com. Retrieved from http://functionalmovement.com/about
5. Cowen, VS. Functional fitness improvements after a worksite-based yoga initiative. J Bodyw Mov Ther 14: 50–54, 2010.
6. Etzel CE. A Literature Review of the Functional Movement Screen as a Predictor of Injury in the Sport of Basketball, 2012.
7. Frost, DM, Beach, TAC, Callaghan, JP, and McGill, SM. Using the functional movement screen TM to evaluate the effectiveness of training. J Strength Cond Res 26(6): 1620– 1630, 2012.
8. Kiesel, K., Plisky, P., & Butler, R. Functional movement test scores improve following a standardized off-season intervention program in professional football players. Scandinavian Journal of Medicine and Science in Sports, 21(2), 287–292, 2009.
9. Kiesel, K., Plisky, P., & Voight, M. Can serious injury in professional football be predicted by a preseason functional movement screen? North American Journal of Sports Therapy, 2(3), 147–158, 2007.
10. Kong, Y, Cho, Y, and Park, W. Changes in the activities of the trunk muscles in different kinds of bridging exercises. J Phys Ther Sci 25: 1609–1612, 2013.
11. Leetun, DT, Ireland, ML, Willson, JD, Ballantyne, BT, and Davis, IM. Core stability measures as risk factors for lower extremity injury in athletes. Med Sci Sports Exer 36: 926–934, 2004.
12. Mitchell, UH, Johnson, AW, and Adamson, B. Relationship between Functional Movement Screen scores, core strength, posture, and body mass index in school children in Moldova. J Strength Cond Res 29(5): 1172–1179, 2015.
13. Okada, T, Huxel, KC, and Nesser, TW. Relationship between core stability, functional movement, and performance. J Strength Cond Res 25(1): 252–261, 2011.
14. Oliver, G and Adams-Blair, H. Improving core strength to prevent injury. J Phys Educ Rec Dance 81: 15–19, 2010.
15. Peate, W., Bates, G., Lunda, K., Francis, S., & Bellamy, K. (2007). Core strength: A new model for injury prediction and prevention. Journal of Occupational Medicine and Toxicology, 2(3), 2007.
16. Perry, FT and Koehle, MS. Normative data for the functional movement screen in middle-aged adults. J Strength Cond Res 27: 458–462, 2013.
17. Schneiders, A. G., Davidsson, A., Horman, E., & Sullivan, J. Functional Movement Screen normative values in a young, active population. International Journal of Sports Physical Therapy, 6(2), 75–82, 2011.
18. Wieczorkowski, M. Functional Movement Screening as a predictor of injury in high school basketball athletes. University of Toledo, 2010.
19. Willardson JM. Developing the Core. Sport Performance Series. National Strength and Conditioning Association. Human Kinetics; 2014.
20. Wilson, J. D., Dougherty, C. P., Ireland, M. L., Davis, I. M. Core stability and its relationship to lower extremity function and injury. Journal of the American Academy of Orthopaedic Surgery, 13, 316-325, 2005.
Creative Commons licensing terms
Authors will retain the copyright of their published articles agreeing that a Creative Commons Attribution 4.0 International License (CC BY 4.0) terms will be applied to their work. Under the terms of this license, no permission is required from the author(s) or publisher for members of the community to copy, distribute, transmit or adapt the article content, providing a proper, prominent and unambiguous attribution to the authors in a manner that makes clear that the materials are being reused under permission of a Creative Commons License. Views, opinions and conclusions expressed in this research article are views, opinions and conclusions of the author(s). Open Access Publishing Group and European Journal of Physical Education and Sport Science shall not be responsible or answerable for any loss, damage or liability caused in relation to/arising out of conflict of interests, copyright violations and inappropriate or inaccurate use of any kind content related or integrated on the research work. All the published works are meeting the Open Access Publishing requirements and can be freely accessed, shared, modified, distributed and used in educational, commercial and non-commercial purposes under a Creative Commons attribution 4.0 International License (CC BY 4.0).