Displacement of a bubble located at a fluid-viscoelastic
medium interface
This is a post-refereeing final draft. When citing, please refer to the published
version: Hasan Koruk, James J. Choi. (2019) Displacement of a bubble located at
a fluid-viscoelastic medium interface. The Journal of the Acoustical Society of
America 145:5, EL410-EL416.
https://doi.org/10.1121/1.5108678
Displacement of a bubble located at a fluid-viscoelastic medium
interface
Hasan Koruka)
Mechanical Engineering Department, MEF University, Istanbul 34396, Turkey
Electronic mail: [email protected]
James J. Choi
Department of Bioengineering, Imperial College London, London SW7 2AZ, United Kingdom
Electronic mail: [email protected]
a) Author to whom correspondence should be addressed.
Running title: Bubble at fluid-viscoelastic medium interface
Abstract
A model for estimating the displacement of a bubble located at a fluid-viscoelastic medium interface in response to acoustic radiation force is presented by extending the model for a spherical object embedded in a bulk material. The effects of the stiffness and viscosity of the viscoelastic medium and the amplitude and duration of the excitation force on bubble
displacement were investigated using the proposed model. The results show that bubble displacement has a nonlinear relationship with excitation duration and viscosity. The time at which the steady state is reached increases with increasing medium viscosity and decreasing medium stiffness.
1. Introduction
Ultrasound has been used to determine tissue properties, such as the elastic modulus (Ophir et al., 1991; Fatemi and Greenleaf, 1998; Sarvazyan et al., 2010). More recently, the use of microbubbles in a fluid to push against tissue under ultrasound exposure was proposed to improve the contrast and spatial resolution of elasticity imaging (Koruk et al., 2015). There are several mathematical models that exist for bubbles exposed to sound in a liquid (Prosperetti, 1987; Church, 1995; Doinikov et al., 2009; Marmottant et al., 2005) or in an elastic and
viscoelastic medium (Yang and Church, 2005; Zabolotskaya et al., 2005; Barajas and Johnsen, 2017). Furthermore, there are some models for the displacement of a bubble completely
embedded in a tissue (Ilinskii et al., 2005; Chen et al., 2002; Aglyamov et al., 2007; Karpiouk et al., 2009; Urban et al., 2011; Yoon et al., 2011; Mikula et al., 2014). However, the displacement of a bubble located at a fluid-viscoelastic medium interface has not been comprehensively explored in the literature.
In the therapeutic and diagnostic ultrasound applications that use microbubbles, a large proportion of bubbles will be located at fluid-tissue interfaces (Erpelding et al., 2005; Doherty et al., 2013; Haar, 2007; Acconcia et al., 2013; Pouliopoulos et al., 2018). In a previous study, we developed a mathematical model for the displacement of a bubble located at a fluid-elastic medium interface in response to acoustic radiation force (Koruk and Choi, 2018). However, besides the elasticity, the viscosity of a tissue can significantly affect the dynamic response (Kruse et al., 2000; Yoon et al., 2011). Therefore, in the present study, a mathematical model for the displacement of a bubble located at a fluid-viscoelastic medium interface, which more accurately simulates the practice, was developed.
The technique for modelling the displacement of a bubble followed in this study is based on the approach used for the displacement of a spherical object embedded in a bulk material (Ilinskii et al., 2005; Yoon et al., 2011) and the mathematical model proposed for a bubble
located at a fluid-elastic medium interface (Koruk and Choi, 2018). However, as in practice, the medium was modelled to exhibit both the elastic and viscous characteristics this time. In
addition, after the validity of the model was briefly evaluated, the effects of the stiffness and viscosity of the viscoelastic medium and the amplitude and duration of the excitation force on bubble displacement were explored using the proposed model. Since the microbubbles used in biomedical ultrasound applications are frequently located at fluid-viscoelastic medium
interfaces, our model can be exploited in practical applications including the determination of the stiffness of tissue microenvironments.
2. Mathematical model
A bubble at fluid-solid interface (Fig. 1a) displaces the surrounding medium when it is exposed to an external force (Fig. 1b). Here, it is assumed that the surrounding environment is homogeneous and isotropic (Yoon et al., 2011). The medium is assumed to be incompressible, as it is in most tissues (Yoon et al., 2011; Sarvazyan, 1975). The model for the medium material includes both elastic and viscous characteristics (i.e., the medium is modeled as a viscoelastic material), as in practice (Yoon et al., 2011; Sarvazyan, 1975; Zhou et al., 2017; Maccabi et al., 2018). It is assumed that the medium does not rupture. The fluid dynamic properties, such as fluid inertance are ignored (Field and Drzewiecki, 1998). It should be noted that the acoustic impedance mismatch between the bubble and the surrounding fluid or tissue is much greater than the mismatch between the fluid and the tissue. Therefore, the contribution of the radiation force due to the acoustic impedance mismatch between the fluid and the viscoelastic medium is neglected. The problem here is axisymmetric and there is no force dependence in the azimuthal direction. Therefore, the deformation of the bubble is symmetrical about the x-axis. The
equation of motion for incompressible viscoelastic medium in time domain is given by (Yoon et al., 2011):
−∇𝑝 + 𝐺∇2𝐮 + 𝜂∇2𝜕𝐮
𝜕𝑡 = 𝜌
𝜕2𝐮
𝜕𝑡2 (1) where 𝑝 is the internal pressure, 𝐮 is the displacement vector, 𝐺, 𝜂 and 𝜌 are the shear modulus, viscosity and density of the medium, respectively, and 𝑡 shows the time.
FIG. 1. (Color online) The bubble (with the radius R) located at fluid-solid interface (a)
displaces the surrounding medium (with the shear modulus G, density 𝜌 and viscosity 𝜂) when it is exposed to an external force (b).
The polar axis of the spherical system of coordinates (𝑟, 𝜃, 𝜙) is along the force vector (i.e., there is an angle 𝜃 between the radius vector and displacement) and the vector of displacement due to an external force 𝑓𝑒 has radial (𝑢𝑟) and polar (𝑢𝜃) components given by 𝐮 = (𝑢𝑟, 𝑢𝜃, 0). For the problem illustrated in Fig. 1, the external force applied to a displaced bubble can be written as (Koruk and Choi, 2018):
𝑓e= −2𝜋𝑅2∫ (𝜎
𝑟𝑟cos𝜃 − 𝜎𝑟𝜃sin𝜃)sin𝜃d𝜃 𝜃ℎ
0 (2)
where 𝑅 is the radius of the bubble and 𝜃ℎ is the angle between the x-axis and r-axis
corresponding to the displacement h. Here 𝜎𝑟𝑟 and 𝜎𝑟𝜃 show the components of stress tensor at
the surface of the bubble. The boundary conditions at the bubble surface (i.e., at 𝑟 = 𝑅) can be written as:
where 𝑝𝑒 is the pressure acting on the bubble surface (i.e., acoustic radiation pressure) and 𝑝𝑔 is
the internal gas pressure. Here, we consider an external force with an amplitude 𝑓0 and a finite length 𝜏 given by:
𝑓e = {𝑓0 𝑡 > 𝜏0 0 ≤ 𝑡 ≤ 𝜏 (4)
By substituting the expressions for the relation between the external pressure 𝑝𝑒 and force 𝑓e
(Koruk and Choi, 2018) and the stress tensor components (Yoon et al., 2011) into Eq. (3), we can obtain the solution as follows:
𝑢𝑟= − 𝑗𝑓0 6𝜋𝑅[1−(1−𝑢𝑟0𝑅 )]ℱ −1[ (𝑒𝑗𝜔𝜏−1)(3−𝑗𝑘𝑅) 𝜔(𝐺−𝑗𝜂𝜔)(1−𝑗𝑘𝑅−16𝑘2𝑅2+1 18𝑗𝑘3𝑅3) ] cos𝜃 (5) 𝑢𝜃 = 𝑗𝑓0 12𝜋𝑅[1−(1−𝑢𝑟0𝑅 )]ℱ −1[ (𝑒𝑗𝜔𝜏−1)(3+𝑗𝑘𝑅) 𝜔(𝐺−𝑗𝜂𝜔)(1−𝑗𝑘𝑅−16𝑘2𝑅2+1 18𝑗𝑘3𝑅3) ] sin𝜃 (6) where 𝑘 is the wave number of the shear wave with the frequency 𝜔, 𝑢𝑟0 is the radial
displacement component for 𝜃 = 0 and ℱ−1 represents the inverse Fourier transform. For a
given force 𝑓0, specific time 𝑡 and 𝜃 = 0, the unknown 𝑢𝑟0 in Eq. (5) can be determined. Here,
the excitation duration 𝜏 was divided into N (e.g., 100) points and the calculations were repeated over the entire time period of interest using Matlab (Mathworks, Natick, MA, USA). Once 𝑢𝑟0 is determined, the radial and polar displacement components for any 𝜃 can be determined using Eqs. (5) and (6). It should be noted that we used the minimum (≈ -10309) and maximum (≈ 10309)
numbers defined in Matlab for the evaluation of the integrals in Eqs. (5) and (6). It is believed that the model presented here can simulate the practice appropriately and the model can be improved further by taking the surface tension and bubble oscillatory dynamics into account in the model. The use of different bubble models, including surface tension and radial and
translational oscillatory bubble dynamics (Watanabe and Kukita, 1993; Zheng et al., 2007; Mettin and Doinikov, 2009), will be considered in our future studies.
3. Methods
The shear modulus for a tissue-mimicking material with a viscosity of 0.7 Pa s was
determined to be around 6.5 kPa using an indentation test where a sphere with a radius of 4 mm was used (Qiang et al., 2011). In this test, a maximum displacement of 0.96 mm was obtained for the force amplitude of 75 mN. Assuming that the maximum displacements for a bubble and sphere (Ilinskii et al., 2005) will be the same for this case, our model for this displacement estimates that the shear modulus of the material is about 5.5 kPa (i.e., our model predicts that the maximum displacement of a bubble with a radius of 4 mm is 0.96 mm when the shear modulus is set to 5.5 kPa). It should be noted that, to the best knowledge of the authors, no prior study has presented experimental displacement-force relationship for a bubble located at a fluid-viscoelastic medium interface. Although the indirect comparison here helps to evaluate the validity of the proposed model, experimental investigation using small and large bubbles (e.g., 1-200 𝜇m in radius) at fluid-viscoelastic material (e.g., gelation with different concentrations) interfaces and different ultrasound parameters (e.g., sonication frequency and pulse length) will be considered in our future studies.
In the following, we explored the effects of the stiffness and viscosity of the medium and the amplitude and duration of the excitation force on bubble displacement using the proposed model. Analyses are performed for physiologically relevant materials (i.e., G = 2 - 4 kPa, 𝜌 = 1000 kg/m3 and 𝜂 = 0.02 – 2 Pa s). For example, the shear modulus, density and viscosity of
the liver are around 2 kPa (Maccabi et al., 2018), 1000 kg/m3 (Woodard and White, 1986) and
0.5 Pa s (Chen et al., 2009), respectively. It should be noted that in small vessels, such as
arterioles and capillaries, their thickness approaches a single cell and in the case of microvessels with thin walls, the vessel takes on the elasticity of the surrounding tissue microstructures (Saharkhiz et al., 2018). Therefore, the model presented here can be used to determine the stiffness of tissue microenvironments. It should be remembered that the microbubbles typically
range from 0.5 to 5 μm in radius (Postema and Gilja, 2011; Appis et al., 2015). The mean radii were reported to be 0.55-1.65 and 1.5-2.25 𝜇m (Karshafian et al., 2010), respectively, for the commercially available microbubbles Definity® and Optison®. It should be noted that large bubbles (i.e, R = 25-250 𝜇m) are frequently used in research to identify the mechanical
properties of materials and explore bubble dynamics (Erpelding et al., 2005; Yoon et al., 2011). The analyses are performed for both small and large bubbles (i.e., 𝑅 = 2 - 100 𝜇m) in this study. The magnitude of the acoustic radiation force on a bubble with a diameter of 1 𝜇m is determined to be 5 nN when the peak negative pressure is 100 kPa and the excitation frequency is 2.25 MHz (Dayton et al., 2002). The magnitude of excitation force produced on bubbles increases as the bubble diameter increases and it can be in the order of 𝜇Ns for larger bubbles even when the excitation frequency is far from the resonance frequency of the bubble (Dayton et al., 2002; Leighton et al., 1990). The magnitude of excitation force is chosen as 2.5-25 nN for small bubbles (i.e., R = 2-4 𝜇m) and 10 𝜇N for the large bubble (i.e., R = 100 𝜇m) in this study. It should be noted that it was shown that the bubble remains almost spherical when bubble displacement does not exceed half times the radius of the bubble for medium materials with similar elastic properties studied in this paper (Ilinskii et al., 2005; Koruk and Choi, 2018).
4. Results and discussion
The time response of a bubble (𝑅 = 100 𝜇m) at a fluid-medium (𝐺 = 2 kPa and 𝜌 = 1000 kg/m3) interface with different medium viscosities (𝜂 = 0.02, 0.05, 0.10 and 0.25 Pa s) and an
external force (𝑓0 = 10 𝜇N) with different durations (𝜏 = 10, 30, 100 and 300 μs) in Fig. 2
clearly show that viscosity dramatically changes the displacement profile. Oscillatory behaviour is observed in bubble displacement for small viscosity values (Fig. 2a) while there are no
oscillations when the viscosity is high enough (Figs. 2b-d). This is expected because the damping force slows the back and forth motion and, when the viscosity force is large enough,
the medium does not oscillate (i.e., move toward the equilibrium). It is seen that a minimum excitation duration to reach the steady state is required (e.g., around 300 𝜇s for 𝜂 = 0.02 Pa s).
FIG. 2. (Color online) The response of a bubble (𝑅 = 100 μm) for a medium (𝐺 = 2 kPa and
𝜌 = 1000 kg/m3) with the viscosity (𝜂) of (a) 0.02, (b) 0.05, (c) 0.10 and (d) 0.25 Pa s and an
external force with the amplitude of 𝑓0 = 10 𝜇N and different pulse durations (𝜏 = 10, 30, 100
and 300 μs).
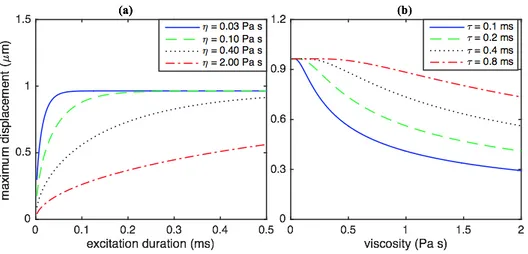
The maximum displacements for a microbubble (𝑅 = 3 𝜇m) and different medium (𝐺 = 2 kPa and 𝜌 = 1000 kg/m3) viscosities (𝜂 = 0.03, 0.10, 0.40 and 2.0 Pa s) as a function of the
duration of the excitation force (𝑓0 = 25 nN) in Fig. 3a clearly show that the bubble
displacement has a nonlinear relation with the excitation duration. For a highly damped
medium, the steady-state displacement can be achieved by keeping the excitation duration long enough. For example, the time duration to reach to the steady state for the system in Fig. 3a is 0.13, 0.38, 1.65 and 9.0 ms for 𝜂 = 0.03, 0.10, 0.40 and 2 Pa s, respectively. It is seen that when the pulse duration gets close to the values that induce the steady state displacement, the increase in maximum bubble displacement decreases slowly. The results (𝑅 = 3 𝜇m, 𝐺 = 2 kPa, 1000
3b clearly show the nonlinear effect of the medium viscosity on the bubble displacement. The bubble displacement decreases nonlinearly as viscosity increases for a specific excitation duration. For example, the bubble displacement is 0.95, 0.88 and 0.74 𝜇m for 𝜂 = 0.5, 1.0 and 2.0 Pa s, respectively, when 𝜏 = 0.8 ms.
FIG. 3. (Color online) The change of the displacement of a microbubble (𝑅 = 3 𝜇m) at the
fluid-medium (𝐺 = 2 kPa and 𝜌 = 1000 kg/m3) interface: (a) for different medium viscosities
(𝜂 = 0.03, 0.10, 0.40 and 2.0 Pa s) as a function of the duration of the excitation force (𝑓0 = 25 nN), and (b) for different excitation force (𝑓0 = 25 nN) durations (𝜏 = 0.1, 0.2, 0.4 and 0.8 ms) as a function of medium viscosity.
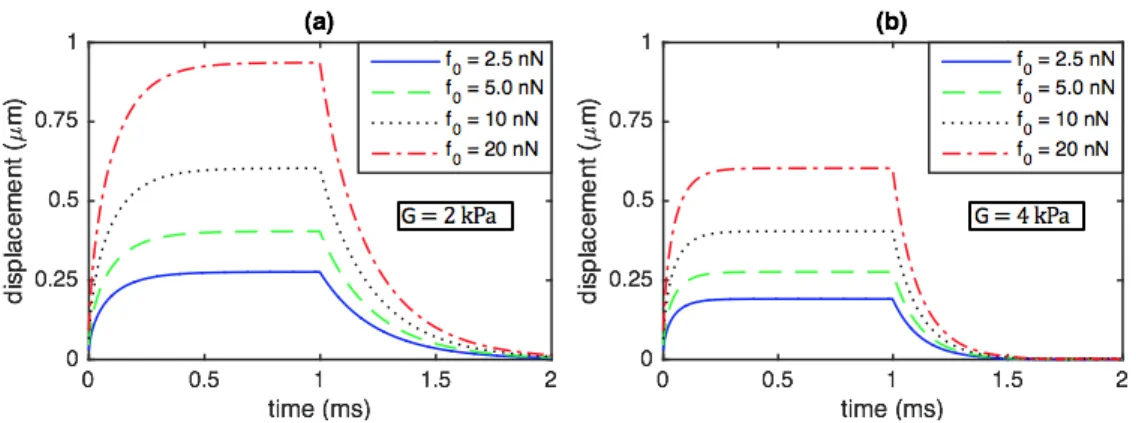
The response of a microbubble (𝑅 = 2 𝜇m) for two different medium (𝜂 = 0.25 Pa s and 𝜌 = 1000 kg/m3) moduli (𝐺 = 2 and 4 kPa) excited for 𝜏 = 1 ms with different force amplitudes
(𝑓0 = 2.5, 5, 10 and 20 nN) as a function of time in Fig. 4 shows that the force magnitude does
not change the time at which the steady state is reached. However, the time to reach steady state depends on the medium stiffness; the medium with a high shear modulus responds faster. For example, for all force levels, the steady state is revealed at about 0.9 and 0.5 ms for 𝐺 = 2 and 4 kPa, respectively. Please note that 0.9 and 0.5 ms correspond to 450 and 250 cycles of an
ultrasound plane wave, for example, if the excitation frequency is 0.5 MHz. It should be noted that the oscillatory behaviour of the excitation force is neglected here; the same has been done in
It is seen that the model presented here can provide an explanation for the dynamic response of a bubble at a fluid-viscoelastic medium interface exposed to an external force. The model can be exploited in practical applications. It can be used to understand the measured echo signal from a bubble at a fluid-medium interface under ultrasound exposure. The stiffness of tissue microenvironments can be determined by measuring the response of the bubble under
ultrasound exposure and the formulation presented here. It can be used to design experiments, for example, to select the excitation duration for a specific bubble displacement when the microbubble radius and material properties are approximately known. We have presented the model for the displacement of a single bubble located at a fluid-viscoelastic medium interface in this study, though many microbubbles will be flowing throughout the vessels in biomedical applications. However, microbubbles injected into the blood at the clinical dose will likely be isolated from each other. Although the distance between the microbubbles may vary locally, a clinical dose of microbubbles (c = 2x10⁶ microbubbles/ml), based on rough calculations using
𝐿 = 𝑐−1/3 (Kryuchkov, 2001;Lazarus et al., 2017), will result in a mean inter-bubble distance of
𝐿 = 80 μm, noting that the microbubbles typically range from 0.5 to 5 μm in radius (Postema and Gilja, 2011; Appis et al., 2015). Here we assumed that there is no tissue rupture or any long-term alteration to the tissue stiffness, though this should be investigated experimentally in future. Experimental investigation using large and small isolated bubbles and many
microbubbles flowing in a channel exposed to ultrasound as well as the improvement of the model by taking the surface tension and bubble oscillatory dynamics into account will be considered in our future studies.
FIG. 4. (Color online) The response of a microbubble (𝑅 = 2 μm) for a medium (𝜂 =0.25 Pa s
and 𝜌 = 1000 kg/m3) with the shear modulus (𝐺) of (a) 2 and (b) 4 kPa excited for 𝜏 = 1 ms
with different force levels (𝑓0 = 2.5, 5, 10 and 20 nN).
5. Conclusion
In this study, we developed a mathematical model for the displacement of a bubble at a fluid-viscoelastic medium interface in response to acoustic radiation force by extending the model for a spherical object embedded in a bulk material. We investigated the effects of the stiffness and viscosity of the medium and the amplitude and duration of the excitation force on bubble displacement using the proposed model. The results show that the bubble displacement has a nonlinear relation with the excitation duration and the medium stiffness and viscosity. The time at which the steady state is reached increases with increasing medium viscosity and decreasing medium stiffness. The potential applications of the model presented in this study include the determination of the stiffness of tissue microenvironments, as the bubbles used in biomedical ultrasound applications are frequently found at fluid-viscoelastic medium interfaces.
6. References
Acconcia, C., Leung, B. Y. C., Hynynen, K., and Goertz, D. E. (2013). “Interactions between ultrasound stimulated microbubbles and fibrin clots,” Appl. Phys. Lett., 103, 53701. doi:10.1063/1.4816750
radiation force: Theoretical analysis and experimental verification,” J. Acoust. Soc. Am.,
122, 1927–1936. doi:10.1121/1.2774754
Appis, A. W., Tracy, M. J., and Feinstein, S. B. (2015). “Update on the safety and efficacy of commercial ultrasound contrast agents in cardiac applications,” Echo Res. Pract. 2(2), R55–R62.
Barajas, C., and Johnsen, E. (2017). “The effects of heat and mass diffusion on freely oscillating bubbles in a viscoelastic, tissue-like medium,” J. Acoust. Soc. Am., 141, 908–918.
doi:10.1121/1.4976081
Chen, S., Fatemi, M., and Greenleaf, J. F. (2002). “Remote measurement of material properties from radiation force induced vibration of an embedded sphere,” J. Acoust. Soc. Am., 112, 884–889. doi:10.1121/1.1501276
Chen, S., Urban, M. W., Pislaru, C., Kinnick, R., Zheng, Y., Yao, A., and Greenleaf, J. F. (2009). “Shearwave dispersion ultrasound vibrometry (SDUV) for measuring tissue elasticity and viscosity,” IEEE Trans. Ultrason. Ferroelectr. Freq. Control, 56, 55–62. doi:10.1109/TUFFC.2009.1005
Church, C. C. (1995). “The effects of an elastic solid surface layer on the radial pulsations of gas bubbles,” J. Acoust. Soc. Am., 97, 1510–1521. doi:10.1121/1.412091
Dayton, P. A., Allen, J. S., and Ferrara, K. W. (2002). “The magnitude of radiation force on ultrasound contrast agents,” Acoust. Soc. Am. J., 112, 2183–2192. doi:10.1121/1.1509428 Doherty, J., Trahey, G., Nightingale, K., and Palmeri, M. (2013). “Acoustic Radiation Force
Elasticity Imaging in Diagnostic Ultrasound,” IEEE Trans. Ultrason. Ferroelectr. Freq. Control, 60, 685–701. doi:10.1109/TUFFC.2013.2617
Doinikov, A. A., Haac, J. F., and Dayton, P. A. (2009). “Modeling of nonlinear viscous stress in encapsulating shells of lipid-coated contrast agent microbubbles,” Ultrasonics, 49, 269– 275. doi:10.1016/J.ULTRAS.2008.09.007
Erpelding, T. N., Hollman, K. W., and O’Donnell, M. (2005). “Bubble-based acoustic radiation force elasticity imaging,” Ultrason. Ferroelectr. Freq. Control. IEEE Trans., 52, 971–979. doi:10.1109/TUFFC.2005.1504019
Fatemi, M., and Greenleaf, J. F. (1998). “Ultrasound-Stimulated Vibro-Acoustic Spectrography,” Science (80-. )., 280, 82 LP-85. Retrieved from
http://science.sciencemag.org/content/280/5360/82.abstract
Field, S., and Drzewiecki, G. M. (1998). “Dynamic Response of the Collapsible Blood Vessel,” Anal. Assess. Cardiovasc. Funct., Springer New York, New York, NY, pp. 277–296. doi:10.1007/978-1-4612-1744-2_17
Haar, G. ter (2007). “Therapeutic applications of ultrasound,” Prog. Biophys. Mol. Biol., 93, 111–129. doi:10.1016/J.PBIOMOLBIO.2006.07.005
Ilinskii, Y. A., Meegan, G. D., Zabolotskaya, E. A., and Emelianov, S. Y. (2005). “Gas bubble and solid sphere motion in elastic media in response to acoustic radiation force,” J. Acoust. Soc. Am., 117, 2338–2346. doi:10.1121/1.1863672
Karpiouk, A. B., Aglyamov, S. R., Ilinskii, Y. A., Zabolotskaya, E. A., and Emelianov, S. Y. (2009). “Assessment of shear modulus of tissue using ultrasound radiation force acting on a spherical acoustic inhomogeneity,” IEEE Trans. Ultrason. Ferroelectr. Freq. Control, 56, 2380–2387.
Karshafian, R., Samac, S., Bevan, P. D., and Burns, P. N. (2010). “Microbubble mediated sonoporation of cells in suspension : Clonogenic viability and influence of molecular size on uptake,” Ultrasonics, 50, 691–697. doi:10.1016/j.ultras.2010.01.009
Koruk, H., and Choi, J. J. (2018). “Displacement of a bubble by acoustic radiation force into a fluid–tissue interface,” J. Acoust. Soc. Am., 143, 2535–2540. doi:10.1121/1.5034175 Koruk, H., El Ghamrawy, A., Pouliopoulos, A. N., and Choi, J. J. (2015). “Acoustic particle
doi:10.1063/1.4936345
Kruse, S. A., Smith, J. A., Lawrence, A. J., Dresner, M. A., Manduca, A., Greenleaf, J. F., Ehman, R. L., et al. (2000). “Tissue characterization using magnetic resonance elastography: preliminary results,” Phys. Med. Biol., 45, 1579-1590. Retrieved from http://stacks.iop.org/0031-9155/45/i=6/a=313
Kryuchkov, Y. N. (2001). “Concentration dependence of the mean interparticle distance in disperse systems,” Refract. Ind. Ceram., 42, 390–392.
Lazarus, C., Pouliopoulos, A. N., Tinguely, M., and Garbin, V. (2017). “Clustering dynamics of microbubbles exposed to low-pressure 1-MHz ultrasound,” J. Acoust. Soc. Am., 142, 3135–3146. doi:10.1121/1.5010170
Leighton, T. G., Walton, A. J., and Pickworth, M. J. W. (1990). “Primary Bjerknes forces,” Eur. J. Phys., 11, 47–50. doi:10.1088/0143-0807/11/1/009
Maccabi, A., Shin, A., Namiri, N. K., Bajwa, N., John, M. S., Taylor, Z. D., Grundfest, W., et al. (2018). “Quantitative characterization of viscoelastic behavior in tissue-mimicking phantoms and ex vivo animal tissues,” PLoS One, 13, 1–18.
doi:10.1371/journal.pone.0191919
Marmottant, P., van der Meer, S., Emmer, M., Versluis, M., de Jong, N., Hilgenfeldt, S., and Lohse, D. (2005). “A model for large amplitude oscillations of coated bubbles accounting for buckling and rupture,” J. Acoust. Soc. Am., 118, 3499–3505. doi:10.1121/1.2109427 Mettin, R., and Doinikov, A. A. (2009). “Translational instability of a spherical bubble in a
standing ultrasound wave,” Appl. Acoust., 70, 1330–1339. doi:https://doi.org/10.1016/j.apacoust.2008.09.016
Mikula, E., Hollman, K., Chai, D., Jester, J. V., and Juhasz, T. (2014). “Measurement of corneal elasticity with an acoustic radiation force elasticity microscope,” Ultrasound Med. Biol.,
40, 1671–1679. doi:10.1016/j.ultrasmedbio.2013.11.009
Ophir, J., Céspedes, I., Ponnekanti, H., Yazdi, Y., and Li, X. (1991). “Elastography: A
Quantitative Method for Imaging the Elasticity of Biological Tissues,” Ultrason. Imaging,
13, 111–134. doi:10.1177/016173469101300201
Postema, M., and Gilja, O. H. (2011). “Contrast-enhanced and targeted ultrasound,” World J. Gastroenterol., 17, 28–41. doi:10.3748/wjg.v17.i1.28
Pouliopoulos, A. N., Burgess, M. T., and Konofagou, E. E. (2018). “Pulse inversion enhances the passive mapping of microbubble-based ultrasound therapy,” Appl. Phys. Lett., 113, 44102. doi:10.1063/1.5036516
Prosperetti, A. (1987). “The equation of bubble dynamics in a compressible liquid,” Phys. Fluids, 30, 3626–3628. doi:10.1063/1.866445
Qiang, B., Greenleaf, J., Oyen, M., and Zhang, X. (2011). “Estimating Material Elasticity by Spherical Indentation Load-Relaxation Tests on Viscoelastic Samples of Finite Thickness,” IEEE Trans. Ultrason. Ferroelectr. Freq. Control, 58, 1418–1429.
Saharkhiz, N., Koruk, H., and Choi, J. J. (2018). “The effects of ultrasound parameters and microbubble concentration on acoustic particle palpation,” J. Acoust. Soc. Am., 144, 796– 805. doi:10.1121/1.5050524
Sarvazyan, A. P. (1975). “Low-frequency acoustic characteristics of biological tissues,” Polym. Mech., 11, 594–597. doi:10.1007/BF00856791
Sarvazyan, A. P., Rudenko, O. V., and Nyborg, W. L. (2010). “Biomedical applications of radiation force of ultrasound: Historical roots and physical basis,” Ultrasound Med. Biol.,
36, 1379–1394. doi:10.1016/j.ultrasmedbio.2010.05.015
Urban, M. W., Nenadic, I. Z., Mitchell, S. A., Chen, S., and Greenleaf, J. F. (2011). “Generalized response of a sphere embedded in a viscoelastic medium excited by an ultrasonic radiation force,” J. Acoust. Soc. Am., 130, 1133–1141. doi:10.1121/1.3613939
acoustic standing wave field,” Phys. Fluids A Fluid Dyn., 5, 2682–2688. doi:10.1063/1.858731
Woodard, H. Q., and White, D. R. (1986). “The composition of body tissues,” Br. J. Radiol., 59, 1209–1218. doi:10.1259/0007-1285-59-708-1209
Yang, X., and Church, C. C. (2005). “A model for the dynamics of gas bubbles in soft tissue,” J. Acoust. Soc. Am., 118, 3595–3606. doi:10.1121/1.2118307
Yoon, S., Aglyamov, S. R., Karpiouk, A. B., Kim, S., and Emelianov, S. Y. (2011). “Estimation of mechanical properties of a viscoelastic medium using a laser-induced microbubble interrogated by an acoustic radiation force,” J. Acoust. Soc. Am., 130, 2241–2248. doi:10.1121/1.3628344
Zabolotskaya, E. A., Ilinskii, Y. A., Meegan, G. D., and Hamilton, M. F. (2005). “Modifications of the equation for gas bubble dynamics in a soft elastic medium,” J. Acoust. Soc. Am.,
118, 2173–2181. doi:10.1121/1.2010348
Zheng, H., Dayton, P. A., Caskey, C., Zhao, S., Qin, S., and Ferrara, K. W. (2007). “Ultrasound-Driven Microbubble Oscillation and Translation Within Small Phantom Vessels,”
Ultrasound Med. Biol., 33, 1978–1987.
doi:https://doi.org/10.1016/j.ultrasmedbio.2007.06.007
Zhou, B., Sit, A. J., and Zhang, X. (2017). “Noninvasive measurement of wave speed of porcine cornea in ex vivo porcine eyes for various intraocular pressures,” Ultrasonics, 81, 86–92.