THE IMPACTS OF DIVERSIFICATION STRATEGIES OF TURKISH
BANKS ON THEIR PROFITABILITY AND RISK:
A PANEL DATA ANALYSIS
*Doç. Dr. Yetkin Çınar Arş. Gör. Gökçe Gürsel Dr. Sevgi Eda Tuzcu Ankara Üniversitesi Ankara Üniversitesi Ankara Üniversitesi Siyasal Bilgiler Fakültesi Siyasal Bilgiler Fakültesi Siyasal Bilgiler Fakültesi ORCID: 0000-0002-4710-0346 ORCID: 0000-0002-1855-3944 ORCID: 0000-0002-3658-2546
● ● ● Abstract
This paper empirically analyzes the effects of product (loan), sector and income diversification strategies on the performances and risks of Turkish commercial banks over the period 2005–2016, in which 2008-2009 treated as a crisis period. Profitability is measured by Return on Assets ratio and natural logarithm of Non-performing Loans is used as a proxy of risk. We evaluate the different dimensions of diversification and using the Entropy methodology to distinguish the total diversification into related and unrelated components. Diversification is captured in three broadly defined dimensions: incomes, products and sectors. Then, we associate all dimensions of diversification with bank profitability and risk measures, across banks and in years, via panel data analyses. In this way, the paper aims to provide recent evidence for Turkish banking sector’s diversification strategies and their outcomes. Our findings indicate that, to be especially dominant on the within groups, income and product (loan) diversification increase return on assets while decreasing loan losses; sectoral diversification decreases profits, but increases risk.
Keywords: Diversification, Bank Performance, Bank Risk, Entropy Method, Panel Data Analysis
Türk Bankalarının Çeşitlendirme Stratejilerinin Kârlılık ve Riskleri Üzerindeki Etkileri: Panel Veri Analizi
Öz
Bu makale; 2005-2016 döneminde Türkiye bankacılık sektöründe faaliyet göstermekte olan mevduat bankalarının gelir, ürün (kredi) ve sektör üzerindeki çeşitlendirme eğilimlerini ortaya koymakta ve aynı zamanda bu stratejilerin bankaların karlılık ve riskleri üzerindeki etkilerini ölçmektedir. Analiz dönemi içerisinde yer alan 2008-2009 yılları kriz dönemi olarak ele alınmış ve bir kontrol değişkeni olarak kabul edilmiştir. Performans veya karlılık, kar / varlıklar oranı ile ölçülürken, riskin bir göstergesi olarak ise sorunlu kredilerin doğal logaritması kullanılmıştır. Çalışma, çeşitlendirme ölçütünü Entropi adı verilen bir yöntemle grup içi ve gruplar arası bileşenlerine ayırarak ve Türk bankacılık sektörünün son dönem çeşitlendirme stratejilerinin sektör karlılığı ve riski üzerindeki etkilerini ortaya koyarakilgili yazına katkıda bulunmaktadır. Elde edilen bulgulardan, özellikle grup içi bileşeninde baskın olmak üzere, gelir ve ürün çeşitlendirmesinin karlılığı arttırıp riski azalttığı; sektör çeşitlendirmesinin ise tersine karlılığı azaltıp riski arttırdığı sonuçlarına ulaşılmıştır.
Anahtar Sözcükler: Çeşitlendirme, Banka Performansı, Banka Riski, Entropi Modeli, Panel Veri Analizi
* Makale geliş tarihi: 30.05.2018 Makale kabul tarihi: 24.09.2018
The Impacts of Diversification Strategies of
Turkish Banks on their Profitability and Risk:
A Panel Data Analysis
*
Introduction
A deep financial crisis in the years 2000 and 2001 affected the Turkish economy especially the banking sector in Turkey. In these years, all indicators of the banking sector worsened. After overcoming that crisis, most of the indicators grew by over more than two times in the five years period between 2003 and 2008. These positive developments were due to the favorable domestic and international macroeconomic situation, concurrently with the “restructuring processes” on the banking sector, which is called as “Banking Restructuring Program” and started in May 2001.
Between the years 2005 and 2016, which is also selected as the analysis period in this study, Turkish financial system totally recovered from the effects of 2000-2001 crises and it can be generally characterized by falling interest rates, low inflation and capital inflow, in parallel with the rising economic activity.
However, within this period, besides short-term global fluctuations in the financial markets observed in 2006, beginning from 2007, global developments led to a rapid contraction in the world economy and more substantial fluctuations in financial markets. Starting from the second quarter of 2008, in particular, the global issues have had considerable reflections in Turkey, i.e. decreased the domestic and external demand. External financing became more limited and the public sector borrowing requirement increased. Assets, deposits and non-performing loans totally worsened by the end of 2008. Although the effects of 2008-2009 crisis are present in the major indicators like profitability of the banking system at that time, strong banking regulations prevented another sharp decline and the crisis did not worsen. As a result, Turkish banking system had exhibited a relatively stable outlook. In other words, the
* A preliminary version of this study was presented at the Russian Economic Congress in Suzdal, Russian Federation (17th - 21th of February 2013).
global crisis had not dramatically affected the performance of the Turkish banks, in contrast to the fact that it had caused substantial negative effects on the performances of the most the European and the US banks. Therefore, Turkish banking sector has become more attractive for foreign investors.
In the recent years, by the end of 2016, the effects of 2008-2009 global crisis has passed, the Turkish Banking System maintained a stable growth, and the total assets increased steadily. However, nonperforming loans to total assets ratio have been increasing since 2012-2013 (see Figure 6. in Chapter 4). In short, while Turkish banking system enjoys a growth period, its risk is also increasing in terms of nonperforming loans.
On the other side, this growth period in banking sector and the effects of fluctuations decreased profit margins and caused more competitive pressure for the banks. It means that the recent developments have forced banks to account for expenses and loan losses while increasing their loan supply to become more profitable. Also, there are findings which indicate that non-interest revenues earned from diversified financial services have a crucial role in bank performance in Turkish banking sector in this period (Çınar, 2011; BRSA Reports, 2010, 2011). Therefore, detecting in which way the performance and risk are affected by diversification in loan portfolio composition or income sources of banks became more important. In other words, there is a need to examine the role of diversification in this history of success for Turkish banking system. In this context, this study provides an analysis on the Turkish commercial banks with respect to their income, loan and sectoral portfolio diversification strategies and their impacts on bank performance and risk.
However, as it will be explained in detail in the following chapter of this study, the empirical findings of the related literature assert that diversification of bank’s assets (or incomes) does not guarantee to produce superior performance and/or greater safety for banks (e.g. see Acharya, et al. 2006). The aim of this paper is to evaluate different dimensions of diversification and associate the results with the bank performance measures in order to provide recent evidence from Turkish banking sector.
For this aim, in this paper, diversification is captured in three broadly defined dimensions: incomes and loans (products) and sectors. All dimensions are measured in related and unrelated components by using the Entropy methodology proposed by Palepu (1985). Then, all dimensions of diversification are associated with profitability and risk measures, by using appropriate panel data analysis methods. The paper empirically analyzes the effects of loan and income diversification strategies on the performances of a selected sample of Turkish commercial banks over the period 2005–2016.
The rest of the paper is organized as follows. Chapter 1 provides a literature review. In Chapter 2, formal methodology is introduced and the main scope and the general formulation of this research are explained. Chapter 3 introduces data used in this study and Chapter 4 presents the results of the empirical application. The last chapter concludes the paper.
1. Literature Review: Diversification and Bank
Performance
Diversification can be defined as the expansion of credit lines to new sectors, or borrowers or geographical regions etc. in order to preserve from risk of default or in order to find new profitable areas. There are some reasons that bank management should take into account for diversification of assets and their income.
First of all, there are regulatory and supervisory issues supporting diversification in the bank loan portfolios and asset choices in many countries because of their potential impacts on macro economy. There are also arguments for limiting a bank’s exposure of its loans to a single borrower in Basel II Accords (Basel Committee of Banking Supervision, 1991).
Second, there are theoretical assertions supporting diversification. According to traditional banking theory (Diamond, 1984), banks should diversify their loan portfolio in order to reduce financial information costs incurring due to asymmetric information. On the other hand, there are empirical findings as well as theoretical assertion which supports the idea that diversification is harmful in some cases. According to the corporate finance theory, banks should focus on specific sectors or group of sector in order to take benefits of expertise in these sectors (Tabak et al., 2011).
There are also empirical findings showing that diversification is beneficial for reducing risk in the loan portfolio and / or for earning higher profits. Especially for the high-risk portfolios, this effect is more expectable (Winton, 1999). Furthermore, during the crisis periods, it has a preservation effect against banks’ probability of default. On the contrary, there is also substantial amount of empirical evidence which shows that diversification increases the risk and reduces the performances of banks (Acharya et al., 2006, Berger et al., 2010; Hayden et al., 2007). Therefore, diversification is a difficult decision for bank management, and it is always a valuable effort to investigate the effects of different types of diversification on performances of banks in different periods and different regions.
The relationship between diversification and performance, and diversification and risk have been analyzed by Acharya et al. (2006) in Italy;
Meyer and Yeager (2001) and Stiroh and Rumble (2006) in the US, Mercieca et al. (2007) and Beale et al. (2007) in the Europe, Hayden et al. (2007) and Kamp et al. (2007) in Germany, Baele et al. (2007) and Berger et al. (2010) in China, and Tabak et al. (2011) in Brazil, separately for economic sector and asset decompositions and/or geographical focus and/or sources of income.
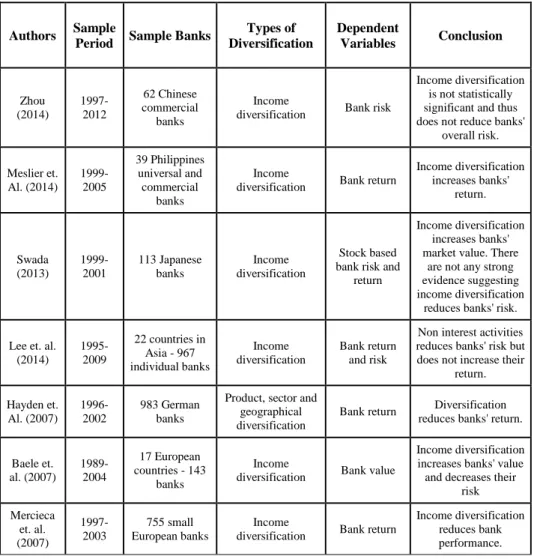
More detailed literature review is provided by using Table 1. Below, Table 1 summarizes the studies in the related literature.
Table 1. Selected Studies from the Literature
Authors Sample
Period Sample Banks
Types of Diversification Dependent Variables Conclusion Zhou (2014) 1997-2012 62 Chinese commercial banks Income
diversification Bank risk
Income diversification is not statistically significant and thus does not reduce banks'
overall risk. Meslier et. Al. (2014) 1999-2005 39 Philippines universal and commercial banks Income
diversification Bank return
Income diversification increases banks' return. Swada (2013) 1999-2001 113 Japanese banks Income diversification Stock based bank risk and
return
Income diversification increases banks' market value. There
are not any strong evidence suggesting income diversification
reduces banks' risk.
Lee et. al. (2014) 1995-2009 22 countries in Asia - 967 individual banks Income diversification Bank return and risk
Non interest activities reduces banks' risk but does not increase their
return. Hayden et. Al. (2007) 1996-2002 983 German banks
Product, sector and geographical diversification
Bank return Diversification reduces banks' return.
Baele et. al. (2007) 1989-2004 17 European countries - 143 banks Income
diversification Bank value
Income diversification increases banks' value and decreases their
risk Mercieca et. al. (2007) 1997-2003 755 small European banks Income
diversification Bank return
Income diversification reduces bank performance.
Elsas et. al. (2010) 1996-2008 9 European countries - 380 banks Income diversification Bank value and profitability Income diversification increases bank profitability and market value Berger et. al. (2010) 1996-2006 88 Chinese banks Loans, deposits, assets and geographical diversification Bank return and expenses Diversification increases cost and reduces profitability.
Lee et. al. (2012) 2002-2010 17 European countries - 710 banks Income
diversification Bank return
Diversification reduces return for high performance banks but for low performance banks diversification increases return. Stiroh and Rumble (2006) 1997-2002
U.S. Bank and financial holding
companies
Income
diversification Bank return
Diversification increases bank return.
Acharya et. al. (2006)
1993-1999 Italian banks
Broad asset sector and economic sector
diversification
Bank risk and return
Diversification increases bank return.
There is a U shaped bank diversification vs. bank return relationship is observed. Tabak et. al. (2006) 2003-2009 96 Brazilian commercial banks Economic sector diversification
Bank risk and return
Diversification increases bank risk
and reduces bank return Gurbuz et. al. (2013) 2005-2011 26 Turkish banks Income
diversification Bank return
Diversification increases bank return.
The diversification literature contains different countries, diversification measures, time periods and methodologies and the results are contradictory. Income diversification is generally measured by the proportion of non-interest income activities in total operating income. The studies employ different control variables like size, ownership structure and time dummies. Bank return or performance is generally measured by Return on Asset (ROA) or a risk adjusted version of ROA. Also, some studies use banks’ market value as dependent variables.
Results from these studies are mixed. It seems that even with the robustness checks, there is not a clear trend stating the positive effect of diversification on bank return. For example, Mercieca et al. (2007: 1984) found that for small European banks income diversification reduces bank performance whereas Baele et.al. (2007: 2013) found income diversification increases bank value and bank risk. Furthermore, Elsas et al. (2010: 1280) showed that income
diversification increases bank profitability and value. It is worthwhile to note that while these studies differ in sample, they chose similar time periods therefore, these banks operate similar macroeconomic environments which seem to not have a significant effect on results.
Another trend to observe from the literature is that in developed economies, the diversification generally has a positive effect on bank return whereas in developing economies, this effect either does not exist or is the opposite, i.e. diversification reduces bank return. Also, Tabak et al. (2006) note that in emerging economies, banks have more concentrated loan portfolios than developed economies’ banks. Therefore, some of the differences in these findings stems from the differences in the economic outlook.
2. Performance and Diversification in Turkish
Banking: Data, Methodology and Application
2.1. Data and VariablesAs of 2016, there are 52 banks operating in the Turkish banking system. 34 of them are commercial banks. 3 banks are state owned, while in 21 of the commercial banks, more than 51% the shares are held by foreigners ( the Banks Association of Turkey, 2017). However, only 20 banks can be included into the analyses because of the following reasons: First, many of the banks that are not included into the dataset mainly have one or two branches in Turkey and they do not deal with the main banking activities. Others are too small to be analyzed or the data are not available for them within the entire sample period.
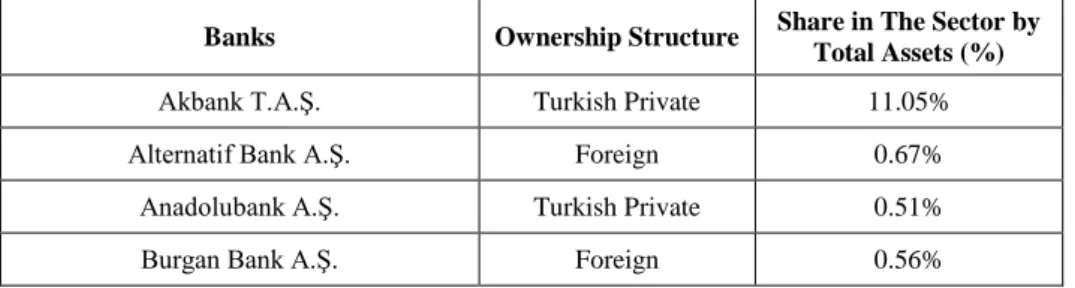
Although our sample consists of a relatively small number of banks (cross sections) when compared to the literature, these banks control 96.66% of the total bank assets by the end of the analysis period. The banks included in the analyses, their ownership structures and their shares in the banking sector by total assets at the end of 2016 are given in Table 2.
Table 2. Banks Included into the Sample
Banks Ownership Structure Share in The Sector by Total Assets (%)
Akbank T.A.Ş. Turkish Private 11.05%
Alternatif Bank A.Ş. Foreign 0.67%
Anadolubank A.Ş. Turkish Private 0.51%
Citibank A.Ş. Foreign 0.33%
Denizbank A.Ş. Foreign 4.21%
QNB FinansBank A.Ş. Foreign 4.14%
HSBC Bank A.Ş. Foreign 0.99%
ING Bank A.Ş. Foreign 2.03%
Şekerbank T.A.Ş. Turkish Private 0.97%
ICBC Bank Foreign 0.34%
Türk Ekonomi Bankası A.Ş. Foreign 3.25%
Turkish Bank A.Ş. Turkish Private 0.06%
Türkiye Cumhuriyeti Ziraat Bankası A.Ş. State-owned 14.59%
Türkiye Garanti Bankası A.Ş. Foreign 11.59%
Türkiye Halk Bankası A.Ş. State-owned 9.44%
Türkiye İş Bankası A.Ş. Turkish Private 12.71%
Türkiye Vakıflar Bankası T.A.O. State-owned 8.67%
Turkland Bank A.Ş. Foreign 0.23%
Yapı ve Kredi Bankası A.Ş. Turkish Private 10.31%
Total 96.66%
Financial data for the banks are obtained from the database provided by the Banks Association of Turkey (BAT) and the Public Disclosure Platform. The detailed information about the annual financial positions, balance sheets and income statements of all banks in the sample are examined from these two databases. The sample period covers the years between 2005 and 2016. It is the most recent period for which the data is available for the sample. The annual unconsolidated accounting reports are used.
2.2. Variables Used in the Analyses
As mentioned before, the main goal of this paper is to show that the relation between the banks’ diversification strategy and its performance, such as profitability and risk. This paper argues that bank performance depends on the degree or type of the diversification, that is to say diversification in interest and non-interest revenues, and diversification with respect to borrowers or financial products. In addition, diversification is split into two parts, namely related and
unrelated diversification, in order to observe their own effects. To do so, regression analyses are conducted. First, the variables will be defined. Next, the general formulation of our empirical approach will be explained.
Dependent Variables: Performance and Loan Risk
Two separate dependent variables have been defined. Return on Assets (ROA) is defined as the performance measure to understand whether diversification results in higher returns. For risk models, InNPL (Natural
logarithm of Nonperforming Loans) is used as a proxy for banks’ risk. Independent Variables: Diversification Measures
Since this study investigates the effect of diversification on banks’ performance, the main independent variables are the diversification measures obtained from the Entropy methodology. As it will be explained in the following chapter (Chapter 3) in formal terms, this methodology distinguishes the total diversification (TD) into its components, such as across groups diversification (AGD) and total within group diversification (TWGD). Entropy depends on hierarchical structures, so in this study, three hierarchical structures (or groupings) are constructed. These groupings are based on banks’ loan exposures and sources of income. They lead us to define the related (within group) and unrelated (across groups) diversification components, which are defined and measured for each bank at a specific point of time. By doing so, we investigate the sensitivity of these different types and dimensions (levels) of diversification as well.
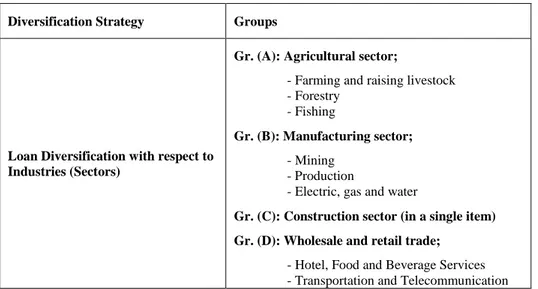
These groupings and detailed classifications in Turkey are given in Table 3.
Table 3. Diversification Strategies
Diversification Strategy Groups
Loan Diversification with respect to Industries (Sectors)
Gr. (A): Agricultural sector;
- Farming and raising livestock - Forestry
- Fishing
Gr. (B): Manufacturing sector;
- Mining - Production
- Electric, gas and water
Gr. (C): Construction sector (in a single item) Gr. (D): Wholesale and retail trade;
- Hotel, Food and Beverage Services - Transportation and Telecommunication
- Financial Institutions
- Real Estate and Rental Services - Self-Employment Services - Education Services
- Health and Social Services in The Services Sector
Gr. (E): Other sectors which are not classified above (in a single item)
Diversification in terms of Financial Products (Loans)
Gr. (A): Consumer Loans
- Housing - Vehicle - Consumer - Credit Cards - Other
Gr. (B): Commercial - Business Loans;
- Vehicle
- Corporate Credit Cards - Other
Income Diversification with respect to interest and non-interest revenues
Gr. (A): Interest based revenues; revenues from;
- Borrowers (Loans) - Banks
- Financial Market Operations - Treasury Bonds and Issues - Other
Gr. (B): Non-Interest based revenues;
revenues from; - Dividends
- Fees and Commissions
As it can be seen from these groupings in the Turkish Banking System, the main sectorial decomposition is as follows: Agricultural, Manufacturing, Construction, Services, and other sectors. Loan risk, on the other hand, is divided into two groups in terms of financial products, namely consumer loans, and commercial loans. Following these groupings, the loan portfolio diversification (concentration) is measured by identifying the individual bank loan exposures to different industries / sectors.
The other grouping is realized with respect to income diversification. Actually, it would be a better way to measure the income diversification according to the two main groups of banking activities; i.e. (i) income from traditional banking activities which includes activities related to lending, taking
deposits and investment in securities and (ii) income from non-traditional banking activities, which are trading and security market services and fund management and insurance services (Vallascas et al., 2011; Chiorazzo, et al., 2008). However, due to the data limitations, we use interest based revenues and fee-based revenues. By using these different groupings, we are allowed to discuss the diversification from various dimensions. Hence, this approach provides us the capability of assessing the consequences of different diversification strategies in a closer view.
Control Variables and Dummies
While ROA and NPL are the dependent variables for two different analyses and the Entropy methodology is used for the diversification measures as independent variables, this study uses different control variables as well, as follows:
- Size: In order to observe whether size of a bank is important in the relation between diversification and risk or return, we use the natural logarithm of total assets in the analyses.
- Ownership Structure: Two different ownership dummies are employed to understand whether the ownership structure affects the diversification – risk and return relation. These are defined whether the bank is state owned or not, and more than 51% of its shares are held by foreigners.
- Macroeconomic Factors (Time Dummy): In order to capture the effects of recent mortgage crisis on the banking sector, a time dummy is added into the analyses for years 2008 and 2009.
- Interest Rate: Overnight interest rates of Central Bank of Turkey observed at the end of analysis years are used as interest rate.
- Total Loans/Total Assets: This variable is used as a proxy for banks’ risk preference.
- Growth: Annual growth rate of total assets of banks.
The detailed variable definitions can be seen in the Appendix. 3.2. Methodology
In this chapter, formal methodology used in this study is introduced and the framework of the empirical research which is constructed in accordance with the concepts stated above is presented.
Diversification Measure and Its “Related” and “Unrelated” Components: Entropy Models
In this paper, diversification is measured by Entropy methodology to distinguish the total diversification into related and unrelated components. Entropy measure stems from the seminal work of Shannon (1948), used in informatics (Theil, 1967), adapted to measurement of diversification by Jacquemin and Berry (1979) and distinguished its components which are used to determine the related and unrelated product diversification components by Palepu (1985).
Entropy index distinguishes between diversification within groups which consist of highly-related components and diversification across these groups.1
Formally, Entropy measure can be defined as follows:
Let the amount of exposure of bank b at time t to each product (or the amount of each type of earning) i denoted as Xibt, where (i = 1…m). Then, relative amount of the exposure / earnings in total amount of loan exposure/earnings will be;
𝑃𝑖𝑏𝑡 = 𝑋𝑖𝑏𝑡
∑𝑚𝑖=1𝑋𝑖𝑏𝑡 (1) Then the total diversification of this bank, at the given point of time is measured by this equation, by the entropy measure:
𝑇𝐷𝑏𝑡= ∑ 𝑃𝑖𝑏𝑡𝐼𝑛 ( 1 𝑃𝑖𝑏𝑡)
𝑚
𝑖=1 (2)
Here, ln represents natural logarithm.
According to this measure, for different relative measures (Pi’s), lower
bt
TD
is calculated. IfTD
btis near to 0 then it means the loan portfolio of the bank is highly concentrated (low diversified). On the other side, if relative exposures are very close to each other, thenTD
bttakes higher values. At the extreme point, if they are near equal, thenTD
bttakes its highest value, which is In(m). It means perfect diversification.Consider loan or earning types which have similar characteristics, for example, earnings from traditional banking activities, e.g. interest revenues
1 Herfindahl Hirschman Indices (HHI) were also calculated and used in the analyses, however since they have more than 98% correlation with total Entropy measures, they are not reported, but only used for the robustness checks.
from loan exposures (rather than fee based revenues) or loans to consumers / households (rather than banks) and let m types of loan exposures or earnings can be distinguished to n groups, where (j=1,…n) and m n.
Then within any jth group, the diversification is measured by 𝑊𝐺𝐷𝑏𝑡𝑗 = ∑ 𝑃𝑖𝑏𝑡𝑗 𝐼𝑛( 1
𝑃𝑖𝑏𝑡𝑗 )
𝑖∈𝑗 (3)
which is called as “Within Group Diversification” or “Related Entropy” measure.
Here
P
ibtjshows the share of the exposure to the product i in its group j, which is done by the bank b at time t. Since the bank b distributes its total exposures among n groups, by taking into account the shares of the groups in total exposure “Total” Within Group Diversification is calculated as:𝑇𝑊𝐺𝐷𝑏𝑡= ∑ 𝑊𝐺𝐷𝑏𝑡 𝑗
𝑃𝑏𝑡𝑗 𝑛
𝑗=1 (4)
Here Pbtj indicates the relative weights of each group in total.
Across Groups or Unrelated Diversification (AGD) measures the degree
of diversification of loans between groups and shows all relative groups’ shares in total. This component is computed as follows:
𝐴𝐺𝐷𝑏𝑡= ∑ 𝑃𝑗 𝐼𝑛( 1 𝑃𝑗)
𝑛
𝑗=1 (5)
Palepu (1985: 253) has shown that Total Diversification (TD) is the sum of its two components, i.e. Total Within Groups (Related) Diversification and Across Groups (Unrelated) Diversification:
𝑇𝐷𝑏𝑡= 𝑇𝑊𝐺𝐷𝑏𝑡+ 𝐴𝐺𝐷𝑏𝑡 (6)
Panel Data Analysis
This study mainly follows the panel specification used by Acharya, et al. (2006) and Tabak, et al. (2011). First, we investigate the impact of diversification measures on bank return by running the following regression: 𝑅𝑂𝐴𝑏,𝑡= 𝛼0+ 𝛼1𝐴𝐺𝐷𝑏,𝑡+ 𝛼2𝑇𝑊𝐺𝐷𝑏,𝑡+ 𝛼3𝑆𝑖𝑧𝑒𝑏,𝑡+ 𝛼4𝑂𝑤𝑛1+ 𝛼5𝑂𝑤𝑛2+ 𝛼6𝐷𝑡𝑖𝑚𝑒+ 𝛼7𝑇𝑜𝑡𝑎𝑙 𝐿𝑜𝑎𝑛𝑠 ⁄𝑇𝑜𝑡𝑎𝑙 𝐴𝑠𝑠𝑒𝑡𝑠
To measure the effects of Total Diversification (TD) on ROA, the following regressions are run.
𝑅𝑂𝐴𝑏,𝑡 = 𝛼0+ 𝛼1𝑇𝐷𝑏,𝑡+ 𝛼2𝑆𝑖𝑧𝑒𝑏,𝑡+ 𝛼3𝑂𝑤𝑛1+ 𝛼4𝑂𝑤𝑛2+ 𝛼5𝐷𝑡𝑖𝑚𝑒+ 𝛼6𝑇𝑜𝑡𝑎𝑙 𝐿𝑜𝑎𝑛𝑠 ⁄𝑇𝑜𝑡𝑎𝑙 𝐴𝑠𝑠𝑒𝑡𝑠
𝑏,𝑡+ 𝛼7𝐺𝑟𝑜𝑤𝑡ℎ𝑏,𝑡+ 𝛼8𝐼𝑛𝑡𝑒𝑟𝑒𝑠𝑡𝑏,𝑡+ 𝜀𝑏,𝑡 (8) For the estimation procedure, Tabak, Fazio, and Cajueiro (2011) recommend Feasible Generalized Least Squares (FGLS), since they have a high degree of group wise heteroscedasticity. In this study, our data set has a high degree of heteroscedasticity across error terms. As a result, Robust OLS estimations are employed and White heteroscedasticity consistent standard errors are reported.
Acharya, et al. (2006) and Tabak, et al. (2011) note that the relation between diversification and bank return can be a function of bank risk as well. In fact, bank risk may affect the bank’s diversification policy in a non-linear way. As a result, the ratio of nonperforming loans to total loans (NPL_percentage=NPL/Total Loans) and its square ([NPL_percentage]2= (NPL/Total Loans)2) are added into the previous equation. The new bank return – across groups and total within groups diversification relation becomes as follows:
𝑅𝑂𝐴𝑏,𝑡 = 𝛼0+ 𝛼1𝐴𝐺𝐷𝑏,𝑡+ 𝛼2𝑇𝑊𝐺𝐷𝑏,𝑡+ 𝛼3𝑆𝑖𝑧𝑒𝑏,𝑡+ 𝛼4𝑂𝑤𝑛1+ 𝛼5𝑂𝑤𝑛2+ 𝛼6𝐷𝑡𝑖𝑚𝑒+ 𝛼7𝑇𝑜𝑡𝑎𝑙 𝐿𝑜𝑎𝑛𝑠 ⁄𝑇𝑜𝑡𝑎𝑙 𝐴𝑠𝑠𝑒𝑡𝑠
𝑏,𝑡+ 𝛼8𝐺𝑟𝑜𝑤𝑡ℎ𝑏,𝑡+ 𝛼9𝐼𝑛𝑡𝑒𝑟𝑒𝑠𝑡𝑏,𝑡+ 𝛼9𝑇𝐷𝑏,𝑡∗ 𝑁𝑃𝐿𝑝𝑒𝑟𝑐𝑒𝑛𝑡𝑎𝑔𝑒 𝑏,𝑡+ 𝛼10𝑇𝐷𝑏,𝑡∗ 𝑁𝑃𝐿𝑝𝑒𝑟𝑐𝑒𝑛𝑡𝑎𝑔𝑒 𝑏,𝑡2+ 𝜀𝑏,𝑡 (9)
To investigate the effect of total diversification (TD) on ROA with multiplicative terms, the following regression is run.
𝑅𝑂𝐴𝑏,𝑡 = 𝛼0+ 𝛼1𝑇𝐷𝑏,𝑡+ 𝛼2𝑆𝑖𝑧𝑒𝑏,𝑡+ 𝛼3𝑂𝑤𝑛1+ 𝛼4𝑂𝑤𝑛2+ 𝛼5𝐷𝑡𝑖𝑚𝑒+ 𝛼6𝑇𝑜𝑡𝑎𝑙 𝐿𝑜𝑎𝑛𝑠 ⁄𝑇𝑜𝑡𝑎𝑙 𝐴𝑠𝑠𝑒𝑡𝑠
𝑏,𝑡 + 𝛼7𝐺𝑟𝑜𝑤𝑡ℎ𝑏,𝑡+ 𝛼8𝐼𝑛𝑡𝑒𝑟𝑒𝑠𝑡𝑏,𝑡+ 𝛼9𝑇𝐷𝑏,𝑡∗ 𝑁𝑃𝐿𝑝𝑒𝑟𝑐𝑒𝑛𝑡𝑎𝑔𝑒 𝑏,𝑡+ 𝛼10𝑇𝐷𝑏,𝑡∗ 𝑁𝑃𝐿𝑝𝑒𝑟𝑐𝑒𝑛𝑡𝑎𝑔𝑒 𝑏,𝑡2+ 𝜀𝑏,𝑡 (10)
Finally, the influence of diversification on bank’s risk is examined through the risk regression reported below.
𝐼𝑛𝑁𝑃𝐿𝑏,𝑡= 𝛼0+ 𝛼1𝐴𝐺𝐷𝑏,𝑡+ 𝛼2𝑇𝑊𝐺𝐷𝑏,𝑡+ 𝛼3𝑆𝑖𝑧𝑒𝑏,𝑡+ 𝛼4𝑂𝑤𝑛1+ 𝛼5𝑂𝑤𝑛2+ 𝛼6𝐷𝑡𝑖𝑚𝑒+ 𝛼7𝑇𝑜𝑡𝑎𝑙 𝐿𝑜𝑎𝑛𝑠 ⁄𝑇𝑜𝑡𝑎𝑙 𝐴𝑠𝑠𝑒𝑡𝑠
𝑏,𝑡+ 𝛼8𝐺𝑟𝑜𝑤𝑡ℎ𝑏,𝑡+ 𝛼9𝐼𝑛𝑡𝑒𝑟𝑒𝑠𝑡𝑏,𝑡+ 𝛼10𝑅𝑂𝐴𝑏,𝑡−1+ 𝜀𝑏,𝑡 (11)
To measure the effect of total diversification (TD) on banks’ risk, the following regression is used.
𝐼𝑛𝑁𝑃𝐿𝑏,𝑡= 𝛼0+ 𝛼1𝑇𝐷𝑏,𝑡+ 𝛼2𝑆𝑖𝑧𝑒𝑏,𝑡+ 𝛼3𝑂𝑤𝑛1+ 𝛼4𝑂𝑤𝑛2+ 𝛼5𝐷𝑡𝑖𝑚𝑒+ 𝛼6𝑇𝑜𝑡𝑎𝑙 𝐿𝑜𝑎𝑛𝑠 ⁄𝑇𝑜𝑡𝑎𝑙 𝐴𝑠𝑠𝑒𝑡𝑠
𝑏,𝑡+ 𝛼7𝐺𝑟𝑜𝑤𝑡ℎ𝑏,𝑡+ 𝛼8𝐼𝑛𝑡𝑒𝑟𝑒𝑠𝑡𝑏,𝑡+ 𝛼9𝑅𝑂𝐴𝑏,𝑡−1+ 𝜀𝑏,𝑡 (12)
In all of the specifications above, t represents the time period, while b reflects banks.
4. Findings
In this section, first, the recent trends in the several diversification measures will be discussed. Next, the results of the above mentioned regression specifications for each product, loan and income diversification measure are reported in turn.
4.1. Trends in Diversification and Other Variables In order to analyze the trends of total diversification measures, Figure 1 and Figure 2 are prepared. For the comparison, all the diversification measures are normalized by dividing them to ln(m), where m stands for the number of components, e.g. loan types in a group.
Figure 2. Total Within Group (WG) Diversification Trends 2005 2006 2007 2008 2009 2010 2011 2012 2013 2014 2015 2016 AG_Sector Div. 0,74 0,77 0,77 0,78 0,78 0,78 0,78 0,77 0,77 0,77 0,78 0,78 AG_Income Div. 0,52 0,53 0,47 0,46 0,49 0,54 0,56 0,52 0,55 0,52 0,51 0,50 AG_Product Div. 0,76 0,77 0,74 0,73 0,71 0,75 0,77 0,77 0,77 0,76 0,74 0,69 0,00 0,10 0,20 0,30 0,40 0,50 0,60 0,70 0,80 0,90 1,00 Adj us ted E ntr o py Sco re
Across Groups Diversification Trends (Avg.)
2005 2006 2007 2008 2009 2010 2011 2012 2013 2014 2015 2016 WG_Sector Div. 0,15 0,17 0,17 0,17 0,18 0,19 0,18 0,18 0,20 0,22 0,23 0,23 WG_Income Div. 0,36 0,37 0,37 0,34 0,33 0,32 0,30 0,29 0,26 0,26 0,24 0,23 WG_Product Div. 0,48 0,47 0,44 0,41 0,39 0,39 0,39 0,40 0,41 0,39 0,35 0,33 0,00 0,10 0,20 0,30 0,40 0,50 0,60 0,70 0,80 0,90 1,00 Adj us ted E ntr o py Sco re
Above figures show that the income diversification is more focused than product diversification. Also, both diversification measures decreases as the time period comes close to 2016. This shows that, for income diversification, proportion of either interest or non-interest income increased during the time period. On the other hand, sector diversification has an increase in time.
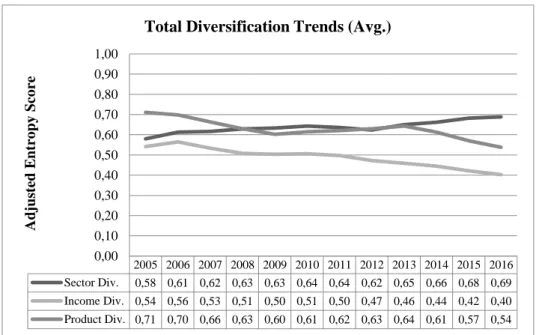
Figure 3. Total diversification trends
Figure 3 shows the overall downward trend of income and product diversification. It is interesting to note that between 2008 and 2011 income diversification and in the 2009-2013 period product diversification was relatively stable. On the contrary, sector diversification increased in the study period. These figures also show that the addition of trends in across groups and within groups diversification are in line with the trends in total diversification measure. Therefore, by using all these diversification measures in this study, the changes in total diversification measure can be traced back to its components and better analyzed. Given the relatively constant trend in across groups diversification, it is clear that the downward trend in total diversification is a result of effects of within groups diversification measure.
The graphs of variables used in the regressions are given below.
2005 2006 2007 2008 2009 2010 2011 2012 2013 2014 2015 2016 Sector Div. 0,58 0,61 0,62 0,63 0,63 0,64 0,64 0,62 0,65 0,66 0,68 0,69 Income Div. 0,54 0,56 0,53 0,51 0,50 0,51 0,50 0,47 0,46 0,44 0,42 0,40 Product Div. 0,71 0,70 0,66 0,63 0,60 0,61 0,62 0,63 0,64 0,61 0,57 0,54 0,00 0,10 0,20 0,30 0,40 0,50 0,60 0,70 0,80 0,90 1,00 Adj us ted E ntr o py Sco re
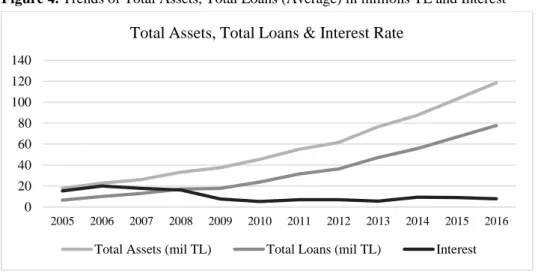
Figure 4. Trends of Total Assets, Total Loans (Average) in millions TL and Interest
Here, we can see that total assets have an upward trend while interest rate has a downward trend in the analysis period. Upward trend in these variables means that the Turkish banking system expanded during the analysis period, especially after 2012. However, it also increased its risk in terms of non-performing loans which can be observed below in Figure 6.
Figure 5. Trends in ROA (Average)
In Figure 5, we see a general downward trend in ROA with a small increase in 2016. Especially in 2008, 2011 and 2015, ROA was smaller than a year before and after.
0 20 40 60 80 100 120 140 2005 2006 2007 2008 2009 2010 2011 2012 2013 2014 2015 2016
Total Assets, Total Loans & Interest Rate
Total Assets (mil TL) Total Loans (mil TL) Interest
2005 2006 2007 2008 2009 2010 2011 2012 2013 2014 2015 2016 ROA 1,0891 1,9368 2,1526 1,5775 1,8772 1,7498 1,2671 1,4101 1,1119 1,0731 0,8508 1,0429 0,00 0,50 1,00 1,50 2,00 2,50 ROA
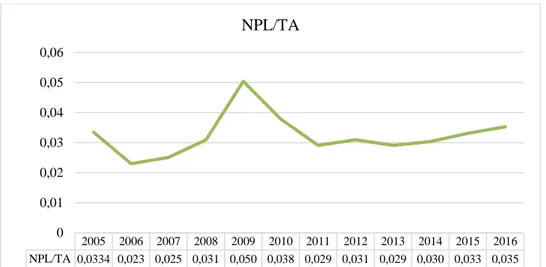
Figure 6. Trends in NPL/TA (Average)
In Figure 6, we see a subtle increase in Nonperforming Loans/Total Assets in the study period. This means that the banks in Turkish banking system increased their risks. We also observe a peak during 2008-2009. To measure the effects of that peak, we included a time dummy in the analysis.
4.2. Bank Return – Diversification Relationship
In this section, we will explain the effects of different diversification measures, such as product, sector and income diversification types on the bank returns. Each type of diversification is decomposed using entropy measures in their within and across groups components, and each will be explained in turn. In addition, the possible nonlinearities in this relation are taken into account by employing the nonlinear model as explained in the previous sections.
The Effects of Diversification on Bank Returns
As mentioned before, to observe the impact of diversification for different diversification groupings, this paper employs a panel regression specification. First of all, all the regression assumptions are checked. No omitted variable problem is observed. Normal distribution of the error terms assumption is not satisfied. However, since the number of observations is large enough for the central limit theorem, the main implications of the model will not be changed in a considerable way. In addition, Citibank has missing values that do not allow us to compute the entropy measures for product diversification. Therefore, the analyses are conducted for 19 banks. Similarly,
2005 2006 2007 2008 2009 2010 2011 2012 2013 2014 2015 2016 NPL/TA 0,0334 0,023 0,025 0,031 0,050 0,038 0,029 0,031 0,029 0,030 0,033 0,035 0 0,01 0,02 0,03 0,04 0,05 0,06 NPL/TA
since Turkishbank and Turklandbank have missing values, they are dropped from sector diversification analyses.
The variance of error terms is not constant, therefore, there is a heteroscedasticity problem. As mentioned before, to correct this problem we employ the White estimator. For income diversification, no bank is needed to be removed from the dataset because of the missing value problem. The results from the Eq. (7) and (8) for the product, sector and income diversification for time t can be seen in Table 5.
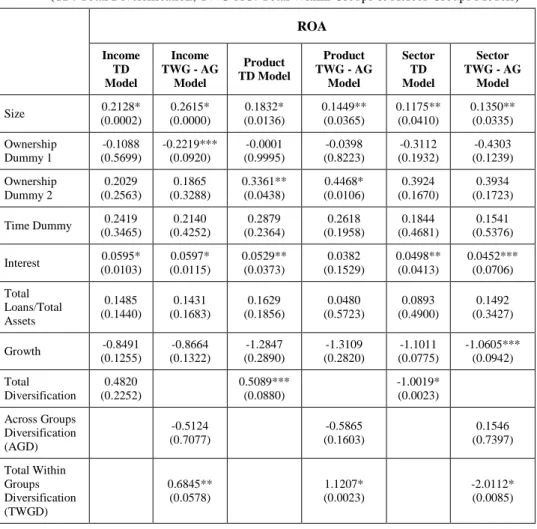
Table 5. The Effect of Income and Product Diversification Measures on ROA
(TD: Total Diversification; TWG-AG: Total Within Groups & Across Groups Models)
ROA Income TD Model Income TWG - AG Model Product TD Model Product TWG - AG Model Sector TD Model Sector TWG - AG Model Size (0.0002) 0.2128* (0.0000) 0.2615* (0.0136) 0.1832* 0.1449** (0.0365) 0.1175** (0.0410) 0.1350** (0.0335) Ownership Dummy 1 -0.1088 (0.5699) -0.2219*** (0.0920) -0.0001 (0.9995) -0.0398 (0.8223) -0.3112 (0.1932) -0.4303 (0.1239) Ownership Dummy 2 0.2029 (0.2563) 0.1865 (0.3288) 0.3361** (0.0438) 0.4468* (0.0106) 0.3924 (0.1670) 0.3934 (0.1723) Time Dummy (0.3465) 0.2419 (0.4252) 0.2140 (0.2364) 0.2879 (0.1958) 0.2618 (0.4681) 0.1844 (0.5376) 0.1541 Interest 0.0595* (0.0103) 0.0597* (0.0115) 0.0529** (0.0373) 0.0382 (0.1529) 0.0498** (0.0413) 0.0452*** (0.0706) Total Loans/Total Assets 0.1485 (0.1440) 0.1431 (0.1683) 0.1629 (0.1856) 0.0480 (0.5723) 0.0893 (0.4900) 0.1492 (0.3427) Growth -0.8491 (0.1255) -0.8664 (0.1322) -1.2847 (0.2890) -1.3109 (0.2820) -1.1011 (0.0775) -1.0605*** (0.0942) Total Diversification 0.4820 (0.2252) 0.5089*** (0.0880) -1.0019* (0.0023) Across Groups Diversification (AGD) -0.5124 (0.7077) -0.5865 (0.1603) 0.1546 (0.7397) Total Within Groups Diversification (TWGD) 0.6845** (0.0578) 1.1207* (0.0023) -2.0112* (0.0085) p values in parantheses *** p<0.1, ** p<0.05, * p<0.01
As seen from Table 5, total diversification in terms of banking products has a positive impact on the return on assets of Turkish banking industry. In fact, this positive effect is a result of total within diversification, which is a part of total diversification. Sector diversification, on the other hand, has a negative impact on profitability. Since ROA, income and product diversification are decreasing and sector diversification is increasing in the analysis period, these results are coherent.
Size is positive and significant in all of the models which means that bigger banks have higher profitability in Turkish Banking System. Also, in income diversification model, one of the ownership dummies is significant meaning that state owned banks have lower ROAs. Moreover, in product diversification models, it is observed that Turkish banks have higher performance in terms of profitability. Interest rate is significant in most of the models which is expected. Time dummy is insignificant in all models indicating that there are significant changes in ROA between 2008 and 2009. Total loans and growth are mostly insignificant.
In these models, product and sector total diversification measures are significant. The source of these significance can be traced back to its components, in this case total within groups diversification.
As explained before, the product and income diversification can also be discussed in detail as a function of risk in the nonlinear model. Results of this model are given in Table 6.
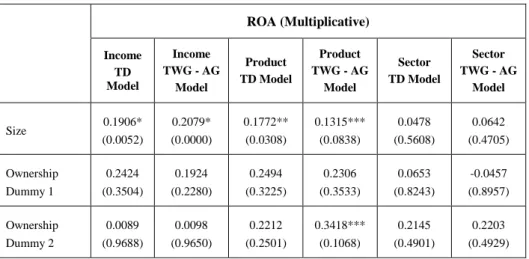
Table 6. Product, Sector and Income Diversification on ROA (Multiplicative Model)
(TD: Total Diversification; TWG-AG: Total Within Groups & Across Groups Models)
ROA (Multiplicative) Income TD Model Income TWG - AG Model Product TD Model Product TWG - AG Model Sector TD Model Sector TWG - AG Model Size 0.1906* (0.0052) 0.2079* (0.0000) 0.1772** (0.0308) 0.1315*** (0.0838) 0.0478 (0.5608) 0.0642 (0.4705) Ownership Dummy 1 0.2424 (0.3504) 0.1924 (0.2280) 0.2494 (0.3225) 0.2306 (0.3533) 0.0653 (0.8243) -0.0457 (0.8957) Ownership Dummy 2 0.0089 (0.9688) 0.0098 (0.9650) 0.2212 (0.2501) 0.3418*** (0.1068) 0.2145 (0.4901) 0.2203 (0.4929)
Time Dummy 0.3517 (0.2685) 0.3384 (0.2859) 0.3457 (0.2332) 0.3012 (0.2204) 0.3417 (0.3062) 0.3128 (0.3467) Interest 0.0499** (0.0434) 0.0503** (0.0445) 0.0508** (0.0528) 0.0341 (0.2038) 0.0360 (0.1874) 0.0324 (0.2351) Total Loans/Total Assets 0.0720 (0.4927) 0.0729 (0.4900) 0.1056 (0.4236) -0.0291 (0.7814) -0.0737 (0.5663) -0.0193 (0.8998) Growth -0.8497*** (0.0998) -0.8555 (0.1103) -1.2808 (0.2842) -1.3119 (0.2757) -1.1355*** (0.0663) -1.1005*** (0.0799) Total Diversification * NPL Percentage -7.5641 (0.3763) -7.2955 (0.3593) -3.3849 (0.5617) -2.2949 (0.6988) -8.0948*** (0.0851) -7.9380*** (0.0992) Total Diversification * NPL Percentage2 -0.2507 (0.9934) -0.3337 (0.9912) -2.7508 (0.9025) -9.4860 (0.6613) 10.5534 (0.4666) 10.5314 (0.4716) Total Diversification 0.9863** (0.0334) 0.5964 (0.1796) -0.7481*** (0.0753) Across Groups Diversification 0.6295 (0.5292) -0.7297 (0.1787) 0.2225 (0.5468) Total Within Groups Diversification 1.0372** (0.0400) 1.2940* (0.0050) -1.6061** (0.0567) p values in parantheses *** p<0.1, ** p<0.05, * p<0.01
Again, the size of the banks is significant in product and income diversification models. In one of the product diversification models, the Turkish banks are found more profitable indicated by the positive and significant coefficient of the ownership dummy 2. As expected, time dummy is insignificant in all models which means that there is no crisis observed in ROA between 2008 and 2009. The growth of total assets has a negative and significant impact on ROA in the analysis period. Multiplicative terms are insignificant in most of the models.
Similar to the ROA models above, income and product diversification have a positive impact on ROA and sector diversification has a negative and
significant effect. When we trace the significance of total diversification, we find that total within groups diversification is significant.
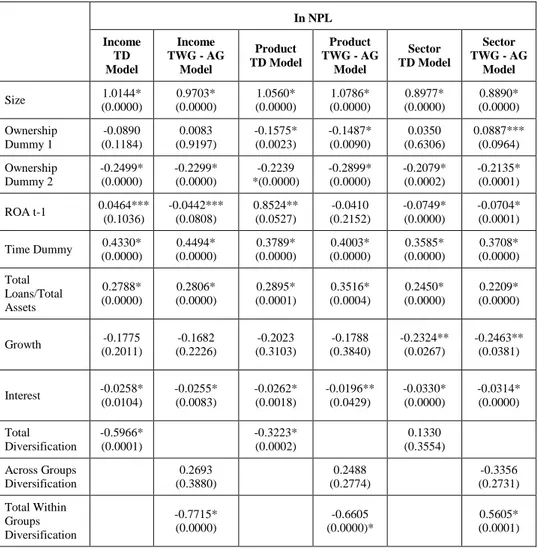
Table 7. Product, Sector and Income Diversification on RISK
(TD: Total Diversification; TWG-AG: Total Within Groups & Across Groups Models)
In NPL Income TD Model Income TWG - AG Model Product TD Model Product TWG - AG Model Sector TD Model Sector TWG - AG Model Size (0.0000) 1.0144* (0.0000) 0.9703* (0.0000) 1.0560* (0.0000) 1.0786* (0.0000) 0.8977* (0.0000) 0.8890* Ownership Dummy 1 -0.0890 (0.1184) 0.0083 (0.9197) -0.1575* (0.0023) -0.1487* (0.0090) 0.0350 (0.6306) 0.0887*** (0.0964) Ownership Dummy 2 -0.2499* (0.0000) -0.2299* (0.0000) -0.2239 *(0.0000) -0.2899* (0.0000) -0.2079* (0.0002) -0.2135* (0.0001) ROA t-1 0.0464*** (0.1036) -0.0442*** (0.0808) 0.8524** (0.0527) -0.0410 (0.2152) -0.0749* (0.0000) -0.0704* (0.0001) Time Dummy 0.4330* (0.0000) 0.4494* (0.0000) 0.3789* (0.0000) 0.4003* (0.0000) 0.3585* (0.0000) 0.3708* (0.0000) Total Loans/Total Assets 0.2788* (0.0000) 0.2806* (0.0000) 0.2895* (0.0001) 0.3516* (0.0004) 0.2450* (0.0000) 0.2209* (0.0000) Growth -0.1775 (0.2011) -0.1682 (0.2226) -0.2023 (0.3103) -0.1788 (0.3840) -0.2324** (0.0267) -0.2463** (0.0381) Interest -0.0258* (0.0104) -0.0255* (0.0083) -0.0262* (0.0018) -0.0196** (0.0429) -0.0330* (0.0000) -0.0314* (0.0000) Total Diversification -0.5966* (0.0001) -0.3223* (0.0002) 0.1330 (0.3554) Across Groups Diversification 0.2693 (0.3880) 0.2488 (0.2774) -0.3356 (0.2731) Total Within Groups Diversification -0.7715* (0.0000) -0.6605 (0.0000)* 0.5605* (0.0001) p values in parantheses *** p<0.1, ** p<0.05, * p<0.01
Lastly, when we look at the risk models, we observe the opposite results from the ROA models. Product and income diversification have a negative impact on risk, whereas sector diversification increases banks’ risk. Time dummy is significant in this case, which can be observed from the NPL/TA
graph. Also, interest rate has a negative effect on risk. As expected, banks’ risk attitude measured by Total Loans/Total Assets has a positive and significant coefficient. Growth and lagged ROA have a negative and significant relationship with risk in many of the models. Also, Turkish banks are observed to have smaller NPL whereas bigger banks have high NPL.
For the sake of simplicity all the results explained above are summarized in Table 8.
Table 8. Summary of the Results
Dependent Variables
Diversification Component ROA ROA (Multiplicative) RISK
AGD-Income N/Sig N/Sig N/Sig
TWGD-Income (+) (+) (-)
AGD-Product N/Sig N/Sig N/Sig
TWGD-Product (+) (+) (-)
AGD-Sector N/Sig N/Sig N/Sig
TWGD-Sector (-) (-) (+)
TD-Income N/Sig (+) (-)
TD-Product (+) N/Sig (-)
TD-Sector (-) (-) N/Sig
Conclusion
After the year 2003, the performance of Turkish Banking Sector generally improved over time in terms of healthiness measures, i.e. CAMEL indicators which consists of the weighted average of returns, loan risk, capital adequacy, asset quality and liquidity measures altogether; the profit rates (margins) of the Turkish banking sector decreased due to the more competitive environment and the effects of global crises. Then, diversification decisions become more crucial in bank management strategies.
In this context, the main hypothesis of the paper was the banks that have a higher degree of loan and/or income diversification are the ones that have higher performance, i.e. they are more profitable and less risky because they benefitted from some of the measures (or types/components) of diversification. In order to analyze the costs and benefits of diversification for banks panel data
regressions are held between performance measures and diversification measures. When dealing with components separately, main research question of this study stated as follows: Is diversification mostly done within groups, i.e. related diversification or between groups, i.e. unrelated diversification more related with performance measures? Moreover, which component of total diversification and in which way does it affect the performance?
In order to answer these questions and test the hypothesis, the paper empirically analyzes the effects of loan and income diversification strategies on the performances of a selected sample of Turkish commercial banks over the period 2005–2016.
We found that the income and product (sector) diversification increase (decrease) the banks’ performance, whereas income and product (sector) diversification decrease (increase) the banks’ risk. These effects are mainly apparent for the within groups diversification, rather than the across groups.
In conclusion, the main results which are summarized in the previous section show that there is evidence in our study that diversification in terms of product and income increases ROA (profitability) and reduces NPL (risk). Moreover, it is shown in this study that when investigating the effects of diversification using many dimensions of this factor is more beneficial than using only total measures.
Repeating the analyses for the other dimensions of diversification (geographical and with respect to borrowers), in the future periods would be valuable extensions of this study.
References
Aleskerov, Fuad., Hasan Ersel and Mercan (2001), “Structural Dissimilarity in Turkish Banks 1988-1999”, Bogazici Journal Review of Social Economic and Administrative Studies, 15 (1): 57-69.
Acharya, Viral V., Iftekhar Hasan and Anthony Saunders (2006), “Should Banks be Diversified? Evidence from Individual Bank Loan Portfolios”, Journal of Business, 79 (3): 1355-1412. Baele, Lieven, Olivier De Jonghe, and Rudi Vander Vennet (2007), “Does the Stock Market Value
Bank Diversification?”, Journal of Banking & Finance, 31 (7): 1999-2023.
Banking Regulation and Supervision Agency (2011), Turkish Banking Sector Main Indicators. Banking Regulation and Supervision Agency (2010), Turkish Banking Sector Main Indicators. Banks Association of Turkey (2017), Bankalarımız 2016 (İstanbul: TBB Yayın No:321).
Basel Banking Committee on Banking Supervision (2011), “Basel II: Revised International Capital Framework”.
Behr, Andreas, Andreas Kamp, Andreas Pfingsten and Christoph Memmel (2007), “Diversification and the Banks’ Risk-Return Characteristics: Evidence from Loan Portfolios of German Banks”, Working paper, Deutsche Bundesbank.
Berger, Allen N., Nathan Miller, Mitchell Petersen, Raghuram Rajan and Jeremy Stein (2001), “Does Function Follow Organizational Form? Evidence from the Lending Practices of Large and Small Banks” Working paper, University of Chicago.
Berger, Allen N., Iftekhar Hasan and Mingming Zhou (2010), “The Effects of Focus versus Diversification on Bank Performance: Evidence From Chinese Banks”, Journal of Banking
& Finance, 34 (7): 1417–1435.
Berger, Philip G. and Eli Ofek (1995). “Diversification’s Effect on Firm Value”, Journal of Financial
Economics, 37 (1): 39-65.
Campa, J.M., and S. Kedia (2002). “Explaining the Diversification Discount”. Journal of Finance, 57, 1731-1762.
Cerasi, Vittoria and Sonja Daltung (2000), “The Optimal Size of A Bank: Costs and Benefits of Diversification”, European Economic Review, 44 (9): 1701-1726.
Chiorazzo, Vincenzo, Carlo Milani and Francesca Salvini (2008), “Income Diversification and Bank Performance: Evidence from Italian Banks”, Journal of Financial Services Research, 33 (3): 181-203.
Çınar, Yetkin (2011), “Efficiency Dynamics and Structural Characteristics of the Largest Commercial Banks in Turkey”, Economic Journal Higher School of Economics, 15 (3): 315-335.
Denis, David J., Diane K. Denis and Atulya Sarin (1997), “Agency Problems, Equity Ownership and Corporate Diversification”. Journal of Finance, 52 (1): 135-160.
Diamond, Douglas (1984), “Financial Intermediation and Delegated Monitoring”, Review of
Economic Studies, 51 (3): 393-414.
Diamond, Douglas and Raghuram Rajan (2001), “Liquidity Risk, Liquidity Creation and Financial Fragility: A Theory of Banking”, Journal of Political Economy, 109 (2): 287-327.
Elsas, Ralf, Andreas Hackethal and Markus Holzhäuser (2010) "The Anatomy of Bank Diversification." Journal of Banking & Finance 34 (6): 1274-1287.
Gascón, Fernando and Victor González (2000), “Diversification, Size and Risk at Spanish Banks”, Working Paper.
Graham, John R., Michael L. Lemmon, and Jack G. Wolf (2002), “Does Corporate Diversification Destroy Value?”, Journal of Finance, 57 (2): 695-720.
Gurbuz, Ali Osman, Serhat Yanik, and Yusuf Ayturk (2013), “Income Diversification and Bank Performance: Evidence from Turkish Banking Sector”, Journal of BRSA Banking and
Financial Markets, 7 (1): 9-29.
Hayden, Evelyn, Daniel Porath and Natalja V. Westernhagen (2007). “Does Diversification Improve The Performance of German Banks? Evidence from Individual Bank Loan Portfolios”, Journal of Financial Services Research, 32 (3): 123-140.
Jacquemin, Alexis P. and Charles H. Berry (1979), “Entropy Measure of Diversification and Corporate Growth”, The Journal of Industrial Economics, 27 (4): 359-369.
Kaufman, George G. (1994), “Bank Contagion: A Review of Theory and Evidence”, Journal of
Financial Services Research, 8 (2): 123-150.
Lee, Bong Soo, and Ming-Yuan Leon Li (2012), “Diversification and Risk-Adjusted Performance: A Quantile Regression Approach”, Journal of Banking & Finance, 36 (7): 2157-2173.
Lee, Chien-Chiang, Shih-Jui Yang, and Chi-Hung Chang (2014), “Non-Interest Income, Profitability, and Risk in Banking Industry: A Cross-Country Analysis”, The North American Journal of
Economics and Finance, 27: 48-67.
Mercieca, Steve, Klaus Schaeck, and Simon Wolfe (2007), “Small European Banks: Benefits From Diversification?”, Journal of Banking and Finance, 31 (7): 1975-1998.
Meslier, Céline, Ruth Tacneng, and Amine Tarazi (2014), “Is bank income diversification beneficial? Evidence from an emerging economy”, Journal of International Financial Markets,
Institutions and Money, 31: 97-126.
Palepu, Krishna G. (1985), “Diversification Strategy, Profit Performance and the Entropy Measure”,
Strategic Management Journal, 6 (3): 239–255.
Rajan, Raghuram (1992), “Insiders and Outsiders: The Choice between Relationship and Arms Length Debt”, Journal of Finance, 47 (4): 1367-1400.
Sawada, Michiru (2013), “How Does the Stock Market Value Bank Diversification? Empirical Evidence from Japanese Banks”, Pacific-Basin Finance Journal, 25, 40-61.
Shannon, Claude E. (1948), “A Note on the Concept of Entropy”, Bell System Tech. J, 27 (3): 379-423.
Sharpe, Steven (1990), “Asymmetric Information, Bank Lending and Implicit Contracts: A Stylized Model of Customer Relationships”, Journal of Finance, 45 (4): 1069-1087.
Stein, Jeremy (2002), “Information Production and Capital Allocation: Decentralized vs. Hierarchical Firms”, Journal of Finance, 57 (5): 1891-1921.
Stiroh, Kevin J. (2002), “Diversification In Banking: Is Noninterest Income The Answer?” Working Paper, Federal Reserve Bank of New York.
Stiroh, Kevin J., and Adrienne Rumble (2006), “The Dark Side of Diversification: The Case of US Financial Holding Companies”, Journal of Banking & Finance, 30 (8): 2131-2161. Vallascas, Francesco, Fabrizio Crespi, and Jens Hagendorff (2011), “Income Diversification and
Bank Performance during the Financial Crisis”, Working Paper
Villalonga, Belen (2004), “Diversification Discount or Premium? New Evidence from the Business Information Tracking Series”, Journal of Finance, 59 (2): 479-506.
Winton, Andrew (1999), “Don’t put all your eggs in one basket? Diversification and specialization in lending”, Working paper, University of Minnesota.
Tabak, Benjamin M., Dimas M. Fazio, and Daniel O. Cajueiro (2011), “The Effects of Loan Portfolio Concentration on Brazilian Banks’ Return and Risk”, Journal of Banking & Finance, 35 (11): 3065-3076.
Zhou, Kaiguo (2014), “The Effect of Income Diversification on Bank Risk: Evidence from China”, Emerging Markets Finance and Trade, 50 (Sup3): 201-213.
Appendix
Table A. Variable Definitions for Analyses:
Variable Definition
Dependent Variable Ln(NPLbt) Natural Logarithm of
Non-Performing Loans of each bank b at time t
Return on Assets (ROAb,t)
Net Income /Total Assets of each bank b at time t
Independent Variables
Total Diversification (TD)
Defined in Equation (2)
Diversification Measures Total Within Group Diversification (Related Diversification - TWGD) Defined in Equation (4) Across Group Diversification (Unrelated Diversification – AGD) Defined in Equation (5)
Ownership Dummies Ownership Dummy 1 t
={1 if the bank is state − owned0 if the bank is private − owned Ownership Dummy 2 t
={
1 if more than 51% of the shares are held by Turkish investors 0 if foreign held Macroeconomic Factors Time Dummy
={1 if year = 2008 and 2009 0 otherwise
Total Loans/Total Assetsb,t
Total Loans divided by Total Assets of bank b at time t
Interest Overnight interest rate at time t
Control Variables Sizeb,t Ln(Total Assets) of each bank b at
time t Return on
ROAb,t-1 Net Income /Total Assets of each
bank b at time t-1
Growthb,t Annual Growth Rate of bank b at
time t
Risk Variables NPL_percentageb,t Non-Performing Loans (NPL) /Total
Loans NPL_percentage2
b,t (NPL/Total Loans)2
TDb,t x
NPL_percentageb,t
Total Diversification of each bank b at time t multiplied by NPL/Total Loans
TDb,t x
NPL_percentage2 b,t
Total Diversification of each bank b at time t multiplied by (NPL/Total Loans)2