Comparing The Different Fixatives For Examination of Liver
Tissue Ultrastructure
Farklı Fiksatiflerin Karaciğer Dokusunda İnce Yapı Düzeyinde Etkilerinin Karșılaștırılması
Sibel Kılıçoğlu
1, Esra Erdemli
21 Ufuk Üniversitesi Tıp Fakültesi Histoloji-Embriyoloji Anabilim Dalı
2 Ankara Üniversitesi Tıp Fakültesi Histoloji-Embriyoloji Anabilim Dalı Amaç: Enfeksiyonlar ve depo hastalıkları gibi karaciğer patolojilerinde dokunun ince yapı düze-yinde incelenmesi önem tașımaktadır. Bu çalıșma; çeșitli tespit sıvılarının etkinliğini ve birbirine olan üstünlüğünü araștırarak, dokunun değișken laboratuvar yöntemlerinden etkilenmesini en aza indirmek üzere planlanmıștır.
Yöntemler: Çalıșmada 5 adet Wistar Albino rat kullanıldı. Ratların %4 paraformaldehitle
perfüzyonundan sonra dokular çıkarıldı ve dört farklı tespit solusyonuyla takip edildi: I- Trump’s solüsyonu %4 paraformaldehit (P) ve %1 gluteraldehit (G ),
II- % 2 PFA ve % 2.5 G, 2,5 mM CaCl içeren, III- % 2 PFA ve % 2,5 G,
IV- % 2,5 G.
I, II, III. Yöntemlerde fosfat tampon kullanılırken, IV. yöntemde kakodilat tamponlu fiksatif kulla-nıldı. Diğer ișlemler bilinen elektron mikroskobi takip yöntemiyle sürdürüldü ve geçirimli elekt-ron mikroskobunda incelendi. Örnekler skorlanarak istatistiksel olarak değerlendirildi.
Bulgular: Plazma zarı ve hücreler arası bağlantı kompleksleri grup I ve II’ de daha iyi korundu.
Grup IV mitokondriyon yapısının en iyi izlendiği grup olarak belirlendi. İnce yapının değerlendi-rildiği beș kritere göre yapılan skorlama ve istatistiksel sonuçlara göre karaciğer için en iyi tespit solusyonu sıralaması I, IV, II ve III olarak belirlendi.
Sonuç: Uygulanan diğer fiksatiflere göre değerlendirildiğinde Trump’s solusyonun karaciğer
dokusu tespitinde daha iyi olduğu bulundu.
Anahtar Sözcükler: Fiksatifler, karaciğer, teknik, geçirimli elektron mikroskobu.
Aim: It is important to examine liver tissue ultrastructure in pathologies of infections and
storage diseases. The aim of this study was to assess the effects and advantages of various fixatives on liver ultrastructure and to minimize the methodological errors during the fixation of liver tissue for transmission electron microscopy.
Materials and Methods: Five Wistar rats were used. After the rats were perfused with 4%
paraformaldehyde (PFA), tissues were extracted and immersed with four different fixation techniques:
I- Trump’s solution 4% paraformaldehyde (PFA) and 1% glutaraldehyde (G) II- 2% F and 2.5% G with 2.5 mM CaCl
III- 2% PFA and 2.5% G
IV- 2.5% G in 0.1M Cacodylate buffer
Samples were embedded, cut, stained and examined with transmission electron microscope. Samples were scored and analyzed.
Results: The plasma membrane and cellular junctions were better preserved in group I and II.
The best mitochondria structure was in group IV. The total score rank from the highest to the lowest was as follows: Group I, IV, II, and III.
Conclusion: The results for the samples fixed in Trump’s fixative were better than those
achieved by other fixing agents.
Key words: Fixatives, liver, technique, transmission electron microscope (T.E.M.)
A significant number of studies of liver tissue with electron microscope has been published. Although they have provided interesting morphological
information, the results with the technique have not thus far come up to expectations, particularly in the range of fine structure. This is due to
Araștırma Makalesi / Research Article
Received: 14.03.2011 • Accepted: 20.07.2011 Corresponding author
Doç. Dr. Sibel KILIÇOĞLU Ufuk Üniversitesi Tıp Fakültesi Histoloji-Embriyoloji Anabilim Dalı GSM : 0 505 229 68 66 Fax : 0 312 204 40 55 E-mail : [email protected]
the poor fixation of the specimens, although, in most instances, fixatives known to give good results in light microscopy used. It was soon realized, even before sectioning became practical, that as far as fixation is concerned, electron microscopy is going to be more exacting than light microscopy. Since some structures observed in electron micrographs of ultrathin sections cannot be visualised by any other method, there is an inevitable ele-ment of subjectivity in judging the quality of preservation achieved (1,2). There has been a recent increase in the number of fixatives recommended for electron microscopy. This variety of fixatives, when combined with the several common dehydrating, embedding, and staining procedures provide a very large number of ways in which tissues can be prepared for fine-structure study.
The first stage of microscopic process is fixation. A structure should have the same appearance with different fixatives. Gluteraldehyde-osmium tetraoxide are commonly used in electron microscopic process. Different specimens require different preparation, particularly at the fixation stage. Usual methods should be preferred by new beginners. The aim of this study was to assess the effects of four different fixatives on liver tissue ultrastructure.
Materials and Methods
This study was conducted with five female albino Wistar rats of 200-250 grams body weight in animal laboratory of Ankara University Faculty of Medicine. The sedation of the rats was provided by ketamin and xsilazin. Prior to perfusion, heparin was given in SF(serum physiological) in order to prevent intravascular coagulation. 1% glutaraldehyde in Tyrode's solution was used as perfusion fluid. Polyvinylpyrrolidone 2.5% was added in order to adjust the colloid osmotic pressure of the perfusion fluid to that of the blood. Perfusion was maintained for 5 min.
until the liver, ear and nose of each rat were whitened The tissue extracts of each five rats’ were divided into four slices and were immersed in four different fixation techniques. Each fixative group was composed of five tissue specimens.
The samples of the first group were fixed with 0.1 M Sorenson’s sodium phosphate buffered (pH= 7.3) 4% formaldehyde (F) and 1% glutaraldehyde (G) mixture solution of Trump’s 4F:1G fixative for two hours at room temperature (1). They were washed with Sorenson’s sodium phosphate buffer solution (pH= 7.3) and were fixed with 0.2 M Sorenson’s sodium phosphate buffered (pH=7.3) 1% osmium tetroxide for one hour at room temperature (mixture of equal volumes of 2% aqueous osmium tetroxide and 0.2 M Sorenson’ sodium phosphate buffer, pH=7.3 as secondary fixation).
The samples of the second group were fixed for one hour at 4°C in 2% paraformaldehyde (PFA) plus 2.5% G in 0.1 M phosphate buffer, pH= 7.4, containing 2.5 mM calcium chloride Karnovsky's fixative (2). They were washed for two hours (or overnight) at 4°C in three changes of 0.1 M phosphate buffered saline solution (PBS) (pH=7.3) containing 2.5 mM calcium chloride (CaCl). The second fixation was for one hour at room temperature in 1% osmium tetroxide in 0.1 M phosphate buffer, pH=7.3 containing 2.5 mM calcium chloride.
The samples of the third group were fixed with phosphate buffered (pH=7.3) 2.5% glutaraldehyde and 2% PFA mixture solution for two hours at room temperature. They were washed with phosphate-buffered saline solution (PBS) (pH=7.3) and were fixed with 1% osmium tetraoxide in 0.1 M phosphate buffer, pH= 7.3 for two hours as secondary fixation.
The samples of the fourth group were fixed in 2.5% G in 0.1M Cacodylate buffer ( pH= 7.4) for two hours (3). They were washed in 0.1 M
cacodylate buffer with 4% sucrose, pH= 7.3. The samples were placed in 1% osmium tetroxide in 0.1M cacodylate buffer, for one hour as a secondary fixation.
Eventually, the fixatives used were as follows: The first group: Trump’s solution 4% PFA and 1% gluteraldehit (G), the second group: 2% PFA and 2.5% G with 2.5 mM CaCl, the third group: 2% PFA and 2.5% G, and the fourth group:2.5% G. Phosphate buffer was used in the first , second and third techniques while, cacodylate buffer was used in the fourth. The liver tissue samples were dehydrated
in graded ethanol solutions after fixation with four different fixatives. Araldite 6005 (Ciba Geigy, Summit, NJ, USA) was used for embedding the samples. Three sections were cut from each specimen with Leica EM FCS (Vien- Austria) ultramicrotome. The semi-thin sections of 1 μm size were stained with Toluidin blue-Azur II to detect the site for the following procedures. 60-70 nm thin sections were contrasted with uranyl acetate and lead citrate. They were examined and photographed using a LEO 906 E TEM (80 kV- Oberkochen-Germany).
Histological evaluation:
TEM micrographs of each tissue specimen were evaluated by two histologists. The ultrastructure of cellular components was examined for five characteristics modified from the Hayat’s criteria (4) in liver tissue specimens. The scoring was performed blind:
I- Nuclear membrane: Double-membrane intact (1), essentially parallel to each other (1), dense (1), no breaks (1) II- Fine cytoplasmic ground substance:
Finely granular precipitate showing no empty spaces, nominal (present/ absent), to convey the complete specimens expressed as the number of samples and the percentage.
III- Endoplasmic reticulum: Rough
endoplasmic reticulum with flattened cisternae uniformly arranged in long profiles with attached ribosomes (1),
closely packed ribosomes, smooth endoplasmic reticulum having branching tubules with intact membranes not associated with ribosomes (1)
IV- Mitochondria: Neither swollen nor shrunk (1), outer double membrane (1), cristae intact (1), dense matrix (1)
V- Plasma membrane and cellular
junction: Intact plasma membrane (1), good membrane contrast (1), pa-tent bile canaliculi (1), observable cellular junctions (1)
Statistical analysis
Statistical analysis was performed by Statistical Package for Social Sciences (SPSS) 11.5 software (SPSS Inc., Chicago, IL, United States). The ordinal variables were expressed as
mean ± standard deviation (mini-mum - maxi(mini-mum). The nominal data were presented as numbers and percentages. The differences between the groups for the ordinal variables were analyzed using Kruskal Wallis test. The level of significance was set as p< 0.05. Bonferroni adjusted Mann Whitney U test was used to find the group differences. The level of significance wais set at 0.0083 for Mann Whitney U test regarding for Bonferroni Adjustment.
Results
Histological Results:
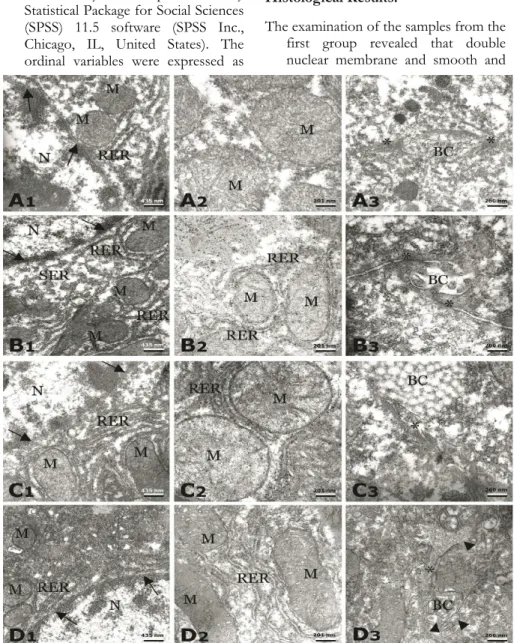
The examination of the samples from the first group revealed that double nuclear membrane and smooth and
rough endoplasmic reticulum were intact. The structure of ribosomes and rough endoplasmic reticulum were best in this group. Cytoplasmic ground substance was finely granular precipitate with no empty spaces. Mitochondria architecture was well preserved with intact cristae, double membrane and dense matrix. The bi-le canaliculi, plasma membrane and junctional complexes were best preserved regular tissues (Figure IA). The examination of the samples from the
second group revealed that nuclear membrane seemed to be double-membrane, continuous and not dilated. There was no empty space in the cytoplasmic ground substance. The cristae of mitochondria and double membrane were well-preserved. Matrix did not seem to have adequate density. Mitochondria were with mild swelling. There was degradation in ribosomes attached to the rough endoplasmic reticulum. Smooth endoplasmic reticulum was regular. Bile canaliculi and junctional complex were well-preserved (Figure IB). The examination of the samples from the
third group revealed that nuclear double membrane was continuous. Plasma membrane and intercellular junctions did not seem to have well-appearance. Contrary to other groups; cristae, double membrane and mitochondria matrix were not intact. The rough endoplasmic reticulum was regular (Figure IC). The examination of the samples from the
fourth group revealed that the best preserved structure of mitochondria with cristae, double membrane and matrix were similar to the first group. There were discontinuous patches of plasma membrane, bile canaliculi and intercellular junctions. The ribosomes attached to the endoplasmic reticulum were regular. The nuclear double membrane was regular and the cytoplasmic ground substance was fine with no empty spaces as in the first group (Figure ID).
Statistical Results
Nuclear envelopes and cytoplasmic ground substance evidence were identical but
Figure 1: Transmission electron micrographs of Group 1 (A), 2 (B), 3 (C) and 4 (D). A1, B1, C1, D1;
N: nucleus, RER: rough endoplasmic reticulum, M: mitochondrion, arrow: nuclear membrane, SER: smooth endoplasmic reticulum, X27800. A2, B2, C2, D2; X60000. A3, B3, C3, D3; BC: bile canaliculi, *: intercellular junctional complex, arrow head: patches of discontinuity X46460.
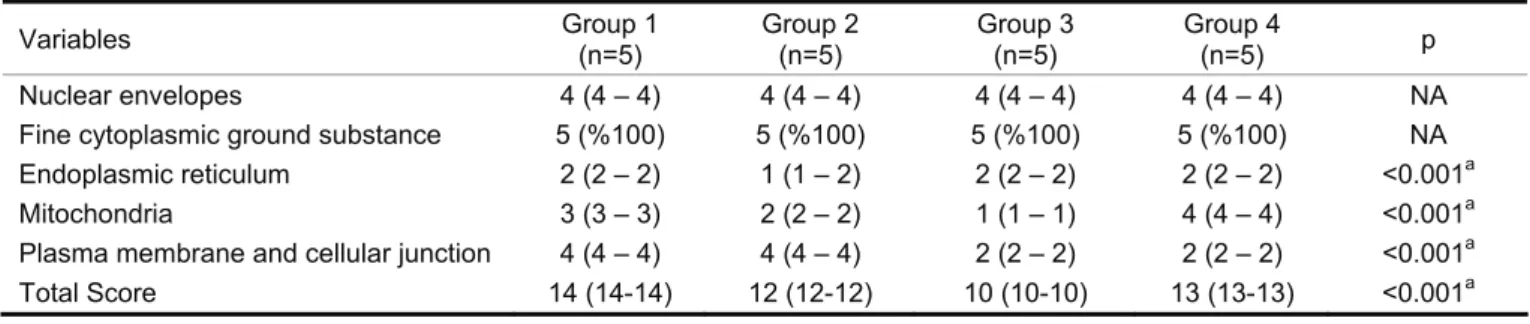
weren’t assessed statistically. The endoplasmic reticulum evaluation was significantly lower in the second group than the other groups (p<0.0083). Mitochondria scores were significantly different in all groups (p<0.001) and the fourth group had the highest score (p<0.0083). Plasma membrane and cellular junction scores of the first and second groups were significantly higher than those of the third and fourth groups (p<0.0083). The total scores were significantly different in all groups (p<0.001). There was significant difference in transmission electron micrograph assessment of specimens fixed with different fixatives. The ranking from the highest to the lowest total score was as follows: The first, fourth, second, and third groups (Table I).
Discussion
Since it is almost impossible to visualize some structures except for electron micrography subjectivity in judging the quality of preservation is inevitable. This problem can be overcome by defining criteria including the lack of clear structural damage which requires the reduction of interaction by various laboratory methods. An ideal fixative should provide a constant
pH during fixation, appropriate osmolarity to avoid swelling or shrinking of cells and organelles, and ionic constitution to avoid extraction or precipitation. The fixing agent may have unpredictable effects on the permeability of membranes and organelles. Fortunately the tissue proteins with their strong buffering capacity tend to keep the pH within a
narrow range when immersed in a fixative. We frequently measured the pH of fixatives. Osmolarity and osmolality refer to interactions between cellular components and external solutions. As measuring osmotic potential of cytoplasm or individual cellular compartments is difficult, it is determined by observing the cell behaviour (swelling or shrinking) in solution. In addition osmometers do not have a major function in routine electron microscopy laboratories (1). Maser et al showed relationship between pH, osmolality, and fixative concentrations (5) however various researcher published their evidence for changes in subcellular morphology caused by fixative osmolality (6-8). Saito and Tanaka studied the glutaraldehyde fixation of the fish tissue for electron microscopy (9). Osmotic pressures of the fixatives were estimated by an osmometer, and the osmotic effect of the fixatives was studied using peripheral blood cells and the liver. Peripheral blood cells were more sensitive to osmotic alteration of the fixatives than hepatic tissue. They stated that for the best fixation result a minor adjustment in osmotic pressures of the fixatives may be required for an individual group of fish (9). On the other hand, Wood and Luft suggested that the buffer type was more important than osmolality in structural preservation (10). For many tissues, particularly those with “dense” nature such as liver, osmotic effects within reasonable limits appear to be negligible (5). Additional criteria, such as lack of
toxicity govern the choice for fixation tools. In fact, it does not appear to be
generally realised that all the buffers used in electron microscopy, with the notable exception of phosphate buffers, are potentially harmful for both the specimen and microscopist, since they are toxic having barbiturates (veronal-acetate) and arsenic compounds (cacodylate). We used cacodylate as a buffer in one group (group IV) and strongly recommended phosphate buffers in others (2).
As liver has a dense tissue favoring a less rapid diffusion of the fixative throughout the tissue blocking for good fixation, choice of fixation technique is very important. Reith et al (11) qualitative results reported that perfusion fixed liver tissue displays a homogeneous fine structure. However, David and Uerlings (12) reported that morphometric and qualitative investigations of rat liver with immersion fixation and perfusion fixation have not produced any significant differences in the volume densities and numbers per area of elements of hepatocytes. Confirming the results of Reith (11), we began fixating with perfusion of 4% PFA before we extracted tissues and then immersed with four different fixation techniques. We recommended the highest concentration of PFA (4%) to ensure that the center of the liver tissue receives adequate concentration of aldehyde and adequate penetration of fixative in the center of the tissue block (13). The liver slices exposed to the PFA showed that, rapidly penetrating responses seemed proportional both to the fixative concentration and the fixation technique of perfusion.
Table 1: The points matching with the appearance of well-fixed components criteria. NA: Not Analyzed, a: Kruskal Wallis test
Variables Group 1 (n=5) Group 2 (n=5) Group 3 (n=5) Group 4 (n=5) p
Nuclear envelopes 4 (4 – 4) 4 (4 – 4) 4 (4 – 4) 4 (4 – 4) NA
Fine cytoplasmic ground substance 5 (%100) 5 (%100) 5 (%100) 5 (%100) NA
Endoplasmic reticulum 2 (2 – 2) 1 (1 – 2) 2 (2 – 2) 2 (2 – 2) <0.001a
Mitochondria 3 (3 – 3) 2 (2 – 2) 1 (1 – 1) 4 (4 – 4) <0.001a
Plasma membrane and cellular junction 4 (4 – 4) 4 (4 – 4) 2 (2 – 2) 2 (2 – 2) <0.001a
Formaldehyde, freshly prepared from the paraformaldehyde, has similar favourable effect with glutaraldehyde. It has advantage of more rapid penetration into the specimen. Various mixtures of aldehydes were tested and a mixture of PFA and G was proved to be superior to aldehyde used alone. We used combinations of F, PFA and G as immersion fixatives after the tissue was perfused with PFA (1,2).
Various studies compared the preservation of subcellular structure of liver with different concentrations of fixatives. Kraemer et al decided that the best qualitative and quantitative preservation was assumed with 4% paraformaldehyde and at a less
degree with 6% paraformaldehyde + 0.25% glutaraldehyde (14). Our results were consistent with literature. Romert and Matthiessen found that
swollen and disrupted mitochondria occur predominantly in liver cells exposed to low concentrations of glutaraldehyde (15). Our results were not consistent with this study. The lower concentration of glutaraldehyde was in Trump’s solution and the scores of Group I was significantly higher than Group II and III with higher concentrations of glutaraldehyde. It was well established that the
ultrastructure of cells and tissues was greatly influenced by the methods of fixation and tissue preparation. The
electron microscopic findings change due to fixative and its composition (16,17).
After studying the effects of fixatives on the ultrastructure, we can conclude that Trump’s fixation was easy to prepare, had lower tonicity, could be stored at 4°C for months and functions as an excellent perfusate. Immersion fixative is an excellent method for preserving the liver cell structure for transmission electron microscopy. When starting a study of any specimen it is advisable to first follow the most recent methods used succesfully by others and then to make any modifications required. This paper will guide to researchers focused on liver tissue ultrastructuraly.
KAYNAKLAR
1. Dykstra M.J. A manual of applied techniques for biological electron microscopy, Plenum Press. New York & London; 1993.
2. Glauert A.M. Fixation, Dehydration and Embedding of Biological Specimens (Practical Methods in Electron Microscopy). Volume 1, 5th repr. PA: Elsevier Science. 1987. p.77-79.
3. Yankah A.C., Yacoub M.H., Hetzer R. Cardiac Valve Allografts II: Science and Practice, 1st ed. Steinkopff-Verlag Darmstadt. 1998. p.4-8.
4. Hayat M.A. Principles and Techniques of Electron Microscopy: Biological Applications, Volume 1, 1sted. PA: Litton Educational Publishing. 1970. p.8-12. 5. Maser MD., Powell TE., 3rd Philpott
CW. Relationships among pH, osmolality, and concentration of fixative solutions. Stain Technol 1967;42(4):175-82.
6. Elbers PF. Ion permeability of the egg of Limnea stagnalis L. on fixation for electron microscopy. Biochim. Biophys Acta 1966;112:318-29.
7. Tahmisian TN. Use of the freezing point method to adjust the tonicity of fixing solutions. J Ultrastructure Res 1964;10:182-88.
8. Fahimi HD, Drochmans P. Essais de standardisation de la fixation au glutrarldehyde. II. Influence des concentrations en aldehyde et de l’osmolalite. J Microscopie 1965;4:737-48. 9. Saito Y, Tanaka Y. Glutaraldehyde
fixation of fish tissues for electron microscopy. J Electron Microsc 1980;29(1):1-7.
10. Wood RL., Luft JH. The influence of buffer systems on fixation with osmium tetroxide. J. Ultrastructure Res 1965; 12:22-45.
11. Reith A, Kraemer M, Vassy J. The influence of mode of fixation, type of fixative and vehicles on the same rat liver: a morphometric/stereologic study by light and electron microscopy. Scan Electron Microsc 1984;2:645-51.
12. David H, Uerlings I. Quantitative ultrastructure of the rat liver by immersion and perfusion fixations. Exp Pathol 1983;23(3):131-41.
13. Palade GE. A study of fixation for electron microscopy. J Exp Med. 1952;95(3):285-98.
14. Kraemer M, Vassy J, Chalumeau MT, Reith A. Effect of paraformaldehyde fixation on the qualitative preservation and stereological parameters of the adult rat liver. Arch Anat Microsc Morphol Exp 1983;72(4):279-97.
15. Romert P, Matthiessen ME. Swelling of mitochondria in immersion-fixed liver tissue. Effect of various fixatives and of delayed fixation. Acta Anat (Basel) 1981;109(4):332-8.
16. Fahimi HD. Perfusion and immersion fixation of rat liver with glutaraldehyde. Lab Invest 1967;16(5):736-50.
17. Bohman SO, Maunsbach AB. Effects on tissue fine structure of variations in colloid osmotic pressure of glutaraldehyde fixatives. J Ultrastruct Res 1970;30(1):195-208.