Full Terms & Conditions of access and use can be found at
https://www.tandfonline.com/action/journalInformation?journalCode=tjti20
ISSN: 0040-5000 (Print) 1754-2340 (Online) Journal homepage: https://www.tandfonline.com/loi/tjti20
The Turkish handmade carpet industry: an
analysis in comparison with select Asian countries
Mehmet Huseyin Bilgin , Ender Demir , Marco Chi Keung Lau , Chester
Kin‐Man To & Zhi‐Ming Zhang
To cite this article: Mehmet Huseyin Bilgin , Ender Demir , Marco Chi Keung Lau , Chester Kin‐Man To & Zhi‐Ming Zhang (2011) The Turkish handmade carpet industry: an analysis in comparison with select Asian countries, Journal of The Textile Institute, 102:6, 514-526, DOI: 10.1080/00405000.2010.498171
To link to this article: https://doi.org/10.1080/00405000.2010.498171
Published online: 15 Feb 2011.
Submit your article to this journal
Article views: 393
View related articles
The Journal of The Textile Institute
Vol. 102, No. 6, June 2011, 514–526
ISSN 0040-5000 print/ISSN 1754-2340 online Copyright © 2011 The Textile Institute DOI: 10.1080/00405000.2010.498171 http://www.informaworld.com
The Turkish handmade carpet industry: an analysis in comparison with select
Asian countries
Mehmet Huseyin Bilgina*, Ender Demirb, Marco Chi Keung Lauc, Chester Kin-Man Toc and Zhi-Ming Zhangc
aDepartment of International Finance, Kadir Has University, Turkey; bAdvanced School of Economics, Università
Ca’ Foscari di Venezia, Italy; cInstitute of Textiles and Clothing, Hong Kong Polytechnic University, Hong Kong
Taylor and Francis
(Received 8 September 2009; final version received 29 May 2010)
Journal of the Textile Institute
The main purpose of this paper is to analyze the Turkish handmade carpet industry and to compare it with select Far East countries. In particular, the Turkish handmade carpet industry is compared with the handmade carpet industries of Iran, India, China, Afghanistan, Pakistan, and Nepal. In this context, the determinants of handmade carpets in the US market are analyzed empirically. Our results show that the Turkish handmade carpet industry has been experiencing a period of recession in the past decade. Through the relative comparative advantage (RCA) index and the Kreinin–Finger similarity (KFS) index, we observed that the RCA index for Turkey indicates that Turkey’s RCA has been declining since 1992. However, despite this decline, the RCA of Turkey was above that of other countries until 1997. But after this, the advantage disappeared eventually and was gained by Iran. During this period, the other competitors of Turkey showed small increases. Furthermore, the empirical results from the gravity model suggests that a 10% real depreciation/appreciation of the US dollar against foreign currency leads to a 0.2% decrease/increase in imports. This finding suggests relatively low exchange rate import pass-through in carpet commodity. The results also support the Linder hypothesis that countries with similar preferences and demand structures will tend to trade more.
Keywords: handmade carpet industry; US market; gravity model; relative comparative advantage index; Kreinin– Finger similarity index
Introduction
The world handmade carpet trade has fluctuated in recent years. Worldwide handmade carpet imports showed a steady performance between 2004 and 2007 and reached 1.885 million US dollars (USD) in 2007. However, it declined to 1.659 million USD, with a decrease of 13.6% in 2008. As the fluctuations, both in handmade exports and imports, exhibits, there have been some problems in the handmade carpet industry and the industry has experienced a notable unsteady trend. Due to a variety of factors, the demand for handmade carpets
has been decreasing. The world handmade carpet trade statistics are given in Table 1.
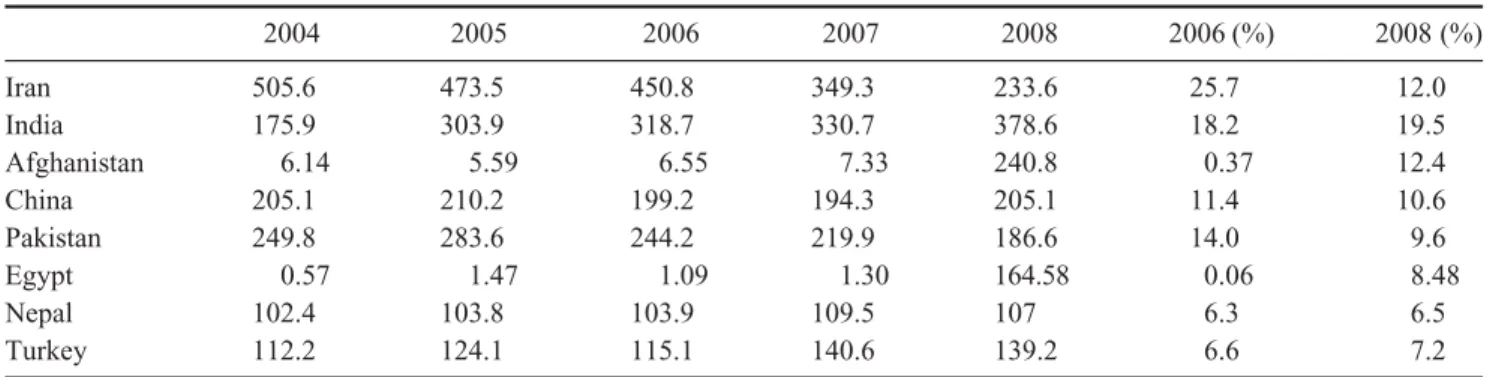
The world handmade carpet and rug production and exports are generally conducted by Iran, China, Pakistan, India, Turkey, Afghanistan, Nepal, and Tibet. These countries performed 79.1% of the world hand-made carpet exports in 2008. As of 2006, the share of Iran’s production in the world market was 26%, that of India was 18%, that of Pakistan was 14%, that of China was 11%, and that of Turkey was 7%. Nevertheless, when we consider 2008, we observe that Iran has lost more than half of its share in the world handmade carpet exports. Turkey and China almost managed to maintain their 2006 levels in the world handmade carpet exports. The list of major exporting countries in the world hand-made carpet market is given in Table 2.
In the EU market, there are six major handmade carpet exporting countries competing with each other: Iran (with 24.7% of the EU market share), India (21.3%), China (13.9%), Nepal (8.4%), Pakistan (8.3%), and Turkey (7.1%). Afghanistan does not hold an important position in the EU market (McCord, 2007). However,
*Corresponding author. Email: [email protected]
Table 1. World handmade carpet trade (million USD)a.
2004 2005 2006 2007 2008
Export 1.655 1.817 1.751 1.691 1.940
Import 1.793 1.787 1.838 1.885 1.659
Source: International Trade Center, Trade Map, Trade Statistics for International Business Development (http://www.trademap.org).
aProduct code 5701 and 570210 are included in the handmade carpet
these rates can show changes due to fluctuations in the world handmade carpet market in 2008 and 2009.
Handmade carpets and rugs are generally imported by Western countries with high levels of welfare. The countries with the largest import shares can be ranked as follows: the United States at 31%, followed by Germany (13%), Turkey (8%), Italy (4%), the United Kingdom (3%), France (3%), and Japan (3%). The handmade carpet imports of these countries compose 64.3% of the world handmade carpet imports. The major handmade carpet importing countries are given in Table 3.
The handmade carpet market is highly competitive. Consumer preferences in this market are changing rapidly and competition in design has become more noticeable in recent years. Nepal and India have managed to adapt to these changes rapidly, thereby becoming prominent countries in the world handmade carpet market. In China, on the other hand, production has shifted towards machine-made carpets, and increas-ing wages are gradually decreasincreas-ing the handmade carpet manufacturing (AISA, 2007).
The main purpose of this paper is to analyze the Turkish handmade carpet industry and to compare it with a few select Far East countries. Initially, the Turkish handmade carpet industry is analyzed in detail. Afterwards, the handmade carpet industries of Iran, India, China, Afghanistan, Pakistan, and Nepal are
investigated.1 Then, the determinants of handmade
carpets in the US market are analyzed empirically. Finally, our results are discussed.
Turkish handmade carpet industry
In contrast to the machine-made carpet manufacturing that is generally located in the southeast Anatolian region, handmade carpet production is widespread throughout Turkey (Surek, 2008). Handmade carpet manufacturing, which is adopted in almost every locale of the country as carpet weaving on looms, takes place in several locations throughout the country. It has been observed that in recent years, production has shifted from western regions to eastern regions due to the lower labor costs. Handmade carpet manufacturing in Turkey is mainly carried out by unorganized local family busi-nesses. In addition to the cooperative associations estab-lished by local administrations and Sumer Hali, people weave carpets at home and sell them in the markets.
It could be said that the Turkish handmade carpet industry has been going through a recession period in the past decade. In contrast to the share of machine-made carpets in total carpet exports, which has been increasing, the share of handmade carpets has been decreasing, which clearly indicates a recession in the industry. The share of machine-made carpet exports in
Table 2. Major exporting countries in the world handmade carpet market (million USD).
2004 2005 2006 2007 2008 2006 (%) 2008 (%) Iran 505.6 473.5 450.8 349.3 233.6 25.7 12.0 India 175.9 303.9 318.7 330.7 378.6 18.2 19.5 Afghanistan 6.14 5.59 6.55 7.33 240.8 0.37 12.4 China 205.1 210.2 199.2 194.3 205.1 11.4 10.6 Pakistan 249.8 283.6 244.2 219.9 186.6 14.0 9.6 Egypt 0.57 1.47 1.09 1.30 164.58 0.06 8.48 Nepal 102.4 103.8 103.9 109.5 107 6.3 6.5 Turkey 112.2 124.1 115.1 140.6 139.2 6.6 7.2
Source: International Trade Center, Trade Map, Trade Statistics for International Business Development (http://www.trademap.org).
Table 3. Major importing countries in the world handmade carpet market (million USD).
2004 2005 2006 2007 2008 2006 (%) 2008 (%) USA 617.9 645.9 652.3 622.6 511.2 35.5 30.8 Germany 337.8 293.5 286.8 283.7 219.3 15.6 13.2 Turkey 47 58.9 89.2 117.0 128.5 4.9 7.7 Free Zones 50.2 60.6 55.7 63.7 65.6 3.0 4.0 Italy 103.5 97.6 94.3 97.4 68.7 5.1 4.1 UK 72.1 64.8 67 64.7 52.7 3.6 3.2 France 47.1 46.4 43.9 46.6 45.3 2.4 2.7 Japan 60.6 61.9 58.9 55.5 41.9 3.2 2.5
516 M.H. Bilgin et al. total carpet exports was 71% in 2002 and rose to 85%
in 2006 and 86% in 2007. Conversely, the share of handmade carpet exports was 29% in 2002 and fell to
15% in 2006 and 14% in 2007.2 Furthermore, the total
value of handmade carpet exports, which was 145 million USD in 1996, declined in the 2000s and only barely reached its 1996 level in 2007.
In spite of its problems in the handmade carpet and rug industry, Turkey holds an important position in the world market for machine-made carpets. Turkey ranks sixth among world machine-made carpet exporting countries, with a share of 6% (Alkan, 2008). In addi-tion, Turkey’s machine-made carpet exports are grow-ing at a faster rate than the world machine-made carpet imports. This indicates that Turkey’s market share in the world machine-made carpet market is gradually increasing. The most important market for Turkey’s machine-made carpet exportation is that of the EU (EU-27) countries: 25.1% of the total machine-made carpet exports of Turkey go to the EU market.
Turkey also ranks seventh in the world among hand-made carpet exporting countries, with a share of 7.2% in 2008. It could be said that Turkey’s handmade carpet exports are following a trend similar to that seen in the world handmade carpet imports. In 2007, Turkey’s handmade carpet exports were about 145 million USD, which represented a 31% increase over the previous year (ITKIB, 2008). It is necessary to mention that the share of Turkey’s handmade carpets that are exported from the free-trade zones is high. For instance, 52% of handmade carpet exports in 2005 were made from the Istanbul AHL free trade zone and the Kocaeli free trade zone (Undersecretariat of the Prime Ministry for Foreign Trade, 2007). As of 2007, the share of exports from the free trade zones was 45%.
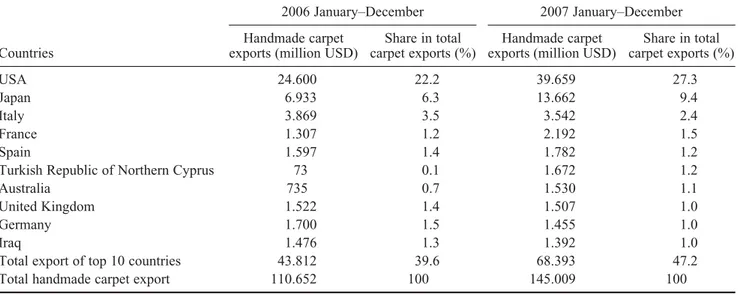
In 2007, handmade carpets valued at 57.2 million USD (a 67.7% increase over the previous year) were exported to other OECD countries, which represent the highest share of Turkey’s handmade carpet exports at 39.4%. The countries with the highest share in this country group were the United States (27.3%) and Japan (9.4%). The share of EU member countries in Turkey’s handmade carpet exports was 10.7%. Other markets that have an important share in Turkey’s hand-made carpet exports (as of 2007) were Italy (with a share of 2.4%), France (1.5%), Spain (1.2%), Turkish Republic of Northern Cyprus (T.R.N.C.) (1.2%), and Australia (1%). On the other hand, as can be observed from Table 4, the top 10 countries in handmade carpet exports as of 2007 were the United States, Japan, Italy, France, Spain, T.R.N.C., Australia, United Kingdom, Germany, and Iraq, in that order (ITKIB, 2008).
Turkey’s carpet imports statistics show that there has been a continuous increase in carpet imports in recent years. As a matter of fact, Turkey’s total carpet imports were about 57 million USD in 2002 and reached 184 million USD in the January–November period of 2007. In the January–November period of 2007, machine-made carpet imports totaled 69 million USD, whereas handmade carpet imports were 115 million USD. On the other hand, while machine-made carpet imports were decreasing after 2005, handmade carpet imports kept increasing at higher rates. Indeed, with the signing of Customs Union Agreement with the EU, handmade carpet and rug imports increased gradually, from their 12 million USD level in 1996, to 51 million USD in 2005, and up to 115 million USD as of the Janu-ary–November period of 2007. As of 2008, Turkey ranks third in the world among handmade carpet import-ing countries, with a share of 7.7%. As a result, it can
Table 4. The top 10 countries in the handmade carpet exports of Turkey.
2006 January–December 2007 January–December
Countries
Handmade carpet exports (million USD)
Share in total carpet exports (%)
Handmade carpet exports (million USD)
Share in total carpet exports (%) USA 24.600 22.2 39.659 27.3 Japan 6.933 6.3 13.662 9.4 Italy 3.869 3.5 3.542 2.4 France 1.307 1.2 2.192 1.5 Spain 1.597 1.4 1.782 1.2
Turkish Republic of Northern Cyprus 73 0.1 1.672 1.2
Australia 735 0.7 1.530 1.1
United Kingdom 1.522 1.4 1.507 1.0
Germany 1.700 1.5 1.455 1.0
Iraq 1.476 1.3 1.392 1.0
Total export of top 10 countries 43.812 39.6 68.393 47.2
Total handmade carpet export 110.652 100 145.009 100
be said that the increase in imports is one of the most important problems in the Turkish handmade carpet sector. The countries that Turkey is importing most of its carpets from were China, India, and Pakistan. The reason that Germany’s share of Turkish imports is high is that Far East carpets are often imported over Germany.
Carpet industry of select Asian countries
Iranian carpet industry
Iran is one of the world’s prominent carpet manufactur-ers and exportmanufactur-ers. The carpet industry is one of the most important industries in the Iranian economy. Iran
manu-factures more than 5 million m2 of handmade carpets
and exported around 500 million USD annually between 2004 and 2006. However, handmade carpet exports of Iran decreased dramatically after 2006 and declined to 233.6 million USD in 2008. Indeed, a down-ward trend has been observed in Iranian carpet exports since the 1990s.
According to carpet manufacturers, the main reason for this decline is weak support in foreign markets. Iranian carpet manufacturers believe that they are moving away from the global advertisement industry. Because of these reasons, Iranian manufacturers are not endowed with sufficient resources to compete in inter-national markets.
There are also some internal factors, such as low quality and high costs, which hinder the competitive power of Iranian handmade carpets in international markets. Indeed, marketing and sustentation costs are high in Iran (Bakhshandeh, 2006). Moreover, to a large extent, the manufacture of carpets in private homes makes it almost impossible to control the industry. Therefore, the industry is not able to meet and fulfill the preferences and demands of foreign consumers. In Iran, 90% of carpets are woven in rural areas, where weavers do not have enough information about the demands of customers in international markets.
Another reason for the decrease is the flow of low-cost carpets into the world market from coun-tries such as China, India, Pakistan, and Afghanistan. Consequently, world-renowned Iranian carpets have been confronted by unfair competition from low-cost, imitation carpets from countries such as mentioned above. These countries have captured the handmade carpet market. For instance, China has captured some part of the Iran’s carpet market share in the United States by imitating Iranian carpets and producing low-quality carpets (Bakhshandeh, 2006).
Despite the declines in recent decade, Iran is still one of the largest carpet exporters in the world. Handmade carpet exports rank first among Iran’s non-petrol exports and third in Iran’s total exports. Carpet manufacturing
constitutes 12% of Iran’s non-petrol exports. Iranian handmade carpets are exported to more than 20 coun-tries. Its main export markets are Germany, the United States, Persian Gulf countries, Italy, Japan, Russia, and Tunisia. The United States and Germany capture 60% of Iranian carpet exports.
The carpet industry is very important for Iranian economy in terms of generating employment, growth, creating added value for non-petrol industries, and exports (Bazargani, 1997). Many people make a living by carpet weaving. The carpet industry also provides the most important job opportunities in rural areas. Throughout the country, more than 200,000 weavers and approximately 2 million people work in the industry (Bakhshandeh, 2006). It is reported that nearly 5 million Iranians work in jobs related to carpet industry. Currently, throughout the country, the carpet industry employs most of the women. In 1996, carpet production occurred at 1.2 million looms located in 210 towns and 27,000 villages (Iran Commerce, 2000). Today, this number has decreased to 1 million looms (Sobhe, 2008). Kerman, Kashan, Tabriz, Esfahan, Shiraz, Hamadan, Arak, and Mashhad are the main cities for carpet manu-facturing in Iran.
Iran is searching for policies to protect its handmade carpet industry against unfair competition from other countries. The Iranian government has prepared several reforms in order to help the industry to minimize losses. Moreover, the Iranian carpet industry is working on a distinctive brand identity that will ensure the authenti-cation and originality of its carpets on the world market. Furthermore, the Iranian government has planned to eliminate the export of low-quality carpets by controlled licensing through the Association of Carpet Exporters of Iran (Keshavarzian, 2006, p. 190). In addition, Iran is asking for intellectual property rights for designs, models, and brands in order to compete with other coun-tries’ imitation and cheap carpets. Iran also strives to increase the education level of weavers in order to manufacture high-quality carpets. It is obvious that the Iranian government regards it as a public service to protect the image of Iran’s carpets in the world by preventing the imitation of Iranian models, restricting the sale of non-Iranian carpets as “Iranian”, and limiting low-quality carpet exports from Iran (Keshavarzian, 2006, p. 190).
Indian carpet industry
Indian carpets have become famous in the world for their elegant design, stylishness, attractive colors, crafts-manship, and workmanship. The rapidly developing Indian carpet industry is famous for its adaptation, inno-vativeness, and ability to adjust to changes.3 Besides, India has a great price advantage in both European and
518 M.H. Bilgin et al. American markets by manufacturing handmade carpets
at approximately the same prices as machine-made carpets.
India exports 90% of the carpets that it produces. The United States ranks first in India’s export destina-tions with 49% of India’s carpet exports and Germany ranks second with 153.5 million USD valued exports. These two countries are followed by the United Kingdom, Japan, and Australia. India has attempted to extend its target markets by conducting sales to coun-tries, such as Poland, which have developing economies and can buy handmade carpets.
Carpet production centers in India are specialized in different fields. Bhadohi is the main carpet production center of the country. Kashmir, which is located in the north, specializes in silk carpet production. Panipat specializes in tufted carpets, which use blends of tradi-tional and modern designs. In Jaipur and Agra, hand-made carpets are produced (USAID, 2006, p. 68). Due to its crowded population, India has a large cost advan-tage over its competitors in handmade carpet production. Although the economy is developing, approximately 25% of the people are under the poverty threshold. For this reason, labor-intensive carpet production is socio-economically very important, and approximately 3 million people work in carpet industry in India.
India has shown increasing performance in terms of handmade carpet exports. India has more than doubled its handmade carpet exports from 2004 to 2008. The Indian carpet industry has made great progress with the strategies exercised by the Indian Carpet Export Promotion Council. Therefore, India has an important place in the world handmade carpet trade. However, the unit value of exported carpets from India is still low. Woolen carpets, rugs, Indian druggets, durry rugs, and similar products constitute the highest exported product group, 59% of India’s 2007–2008 handmade carpet exports. Silk carpet exports are 6% of total carpet exports. Providing a wide product range, the Indian carpet industry is developing in terms of both value and volume. Estimates are that in approximately 5 years, Indian carpet exports will exceed 3 billion USD (Srivastava & Goswami, 2007).
Chinese carpet industry
Chinese handmade carpets have an important position in the world carpet market. China is able to produce handmade carpets of different qualities and at several price intervals. As in many other industries in China, increasing labor costs have a potential to weaken the competitive power of China in the handmade carpet industry. A large part of production in China is tufted carpets, and in this market, China competes with India. China is competing in the middle segment of the market
by producing high-quality machine-made carpets. By producing machine-made carpets at low price and high quality, it competes with handmade carpets as well. This has made things difficult for other handmade carpet producers, forcing them to develop different strategies (USAID, 2006, p. 68).
In the 2002–2005 period, China’s handmade carpet exports demonstrated on average a greater than 20% increase per annum. But after 2005, handmade carpet exports declined, and in 2008, China managed to reach only the level of 2005. China’s carpet exports are primarily to the United States and Japan. In the United States and Japan, one out of every five handmade carpets is made in China.
The improvement in Chinese handmade carpets generates great social benefits for agriculture, rural areas, and farmers. Since they require intensive labor, Chinese handmade carpets have an important role in terms of both employment, especially for rural areas, and regional economic development. For instance, in Ningjin city of Shandong State, the carpet industry constitutes 25% of the total private sector. In Qianan city of Hebei State, the carpet industry provides employment for 12,000 people. In 2005, the carpet industry provided employment for 20,000 people in Qinghai State.
The number of handmade carpet producers in China has been growing. As of 2002, there were 1080 firms operating in the carpet industry in China. Leading firms of the industry consider technological improvements very important and have independent design rooms. Some firms even have independent research and devel-opment (R&D) and training centers that employ about 100 technical personnel. For instance, between 1995 and 2005, Qianan Carpet Corporation created 9000 different designs, which were in high demand in over-seas countries. The Qinghai Tibetan Sheep Carpet Corporation has developed 100 new products and holds six patents in carpet weaving and techniques.
Like many other carpet-producing countries, China exports a great portion of its carpets. The markets for Chinese carpets are extending both locally and globally. While the Chinese carpet industry is becoming more competitive in the world market, there exists a market with great potential within China itself. In 2004, local
consumption in China reached 80 million m2, and this
consumption is increasing by 10% per annum.
Afghan carpet industry
The carpet industry is one of the most important indus-tries of the Afghan economy. The carpet industry has the potential to support the structural change and trans-formation of the Afghan economy (Banwal, 2005). It is a prominent industry in terms of exports and is an
important source of employment and income for the population in rural areas (AISA, 2005). In general, labor-intensive carpet production is widespread throughout the country. Carpet production is mainly concentrated in the northern region; Kabul is one of the new production centers. Although in other countries weavers are mostly women, in Afghanistan, men also weave carpets.
According to the Afghan Carpet Exporters Guild, over 1 million people work in carpet manufacturing. Millions of people work in related areas such as wool production, carpet cutting, washing, and design. For this reason, the carpet industry is one of the main industries on which both the Afghan government and its private sector companies are focused. More than 95% of carpet production occurs in households on independent looms provided by carpet exporting companies. Because factory-style manufacturing is not in accordance with Afghan traditions, only a small portion of total produc-tion can be done in factories. However, nowadays, an increasing number of investors are heading toward building factories (McCord, 2007).
Afghan carpet producers have serious problems in expanding into the world market. Direct relationships of producers and sellers with the markets are weak. Gener-ally, either buyers or traders contact the weavers or they buy the carpet before the “finishing” stage and supply it to the world market. Afghanistan’s capacity is insuffi-cient in the “finishing” stage, which is accepted as an important stage of carpet production and consists of cutting and washing. Afghanistan’s logistics infrastruc-ture is also inadequate. As a result, more than 80% of Afghan carpets are transported to Pakistan via trucks for the “finishing” stage and logistics; they are collected there and exported to the world market under Pakistani brands. This situation decreases the efficiency and recognition of Afghan carpet exports to the world market (McCord, 2007).
Despite its shrinkage in the world market, between 2000 and 2005, the Afghan carpet industry grew by 2% on average. According to the estimates of the Afghani-stan Export Promotion Agency, 2 million carpets are exported per annum. Pakistan is one of the prominent handmade carpet exporting countries of the world, but more than 70% of the carpets that are sold as Pakistani carpets are actually Afghan carpets (AISA, 2007). Exports were realized as 123 million USD in 2000, 154 million USD in 2001, 136 million USD in 2003, 149 million USD in 2004, and 140 million USD in 2005 (USAID, 2006). It is observed that Afghanistan has increased its handmade carpet exports in recent years. According to data of International Trade Center (Trade Map, Trade Statistics for International Business Development, http://www.trademap.org), the value of exports in 2008 was 240 million USD.
According to the estimates of the OTF Group, if Afghanistan is able to increase its production capacity and develop finishing facilities, it could increase carpet exports rapidly. According to a study of the US Agency for International Development, under the assumption that Afghanistan carpet exports grow by 11% per annum, exports can reach up to 350 million USD in 2015 (Kurata, 2007). Moreover, it is targeted that 80% of Afghan carpets could be finished in Afghanistan and exported to the world market (USAID, 2006).
The Afghan government has realized the impor-tance of the carpet industry and supports it, together with the non-governmental organizations and interna-tional organizations (AISA, 2005). In fact, since 2001, both the Afghan government and international organi-zations have been trying to lead Afghan carpets to important positions in the world market. In spite of such efforts, insufficient technology, infrastructure, difficulty in accessing capital, security problems and the inability to reach markets have prevented Afghan carpets from becoming exceptionally prominent in the world market (USAID, 2005).
Pakistani carpet industry
The carpet industry has a vital role in the economy of Pakistan and provides many job opportunities, especially for people in rural areas. According to the Pakistan Carpet Manufacturers and Exporters Association
(PCMEA),4 there are 150,000–200,000 looms in the
country and the number of weavers is estimated around 200,000–250,000 (Cameron & Khair-uz-zaman, 2006). Moreover, more than 1.5 million people are employed in this industry and more than 3 million people directly or indirectly depend on its earnings. The handmade carpet industry constitutes 0.64% of the total GDP, 3.66% of the manufacturing industry GDP, and approx-imately 14% of the small-scale manufacturing sector GDP (Nasir, 2004).
The unique characteristics of the Pakistan carpet industry are the high quality and low price of the carpets produced. The patterns and designs of carpets and rugs made in Pakistan incorporate local, Persian, and Turkish designs. This blend creates a design that is unique to Pakistani carpets. Although a large variety of carpets are produced, the main two types of Bokhara and Persian dominate the market (Nasir, 2004).
Pakistan is one of the world’s largest carpet export-ers. More than 99% of carpets woven in the country are exported; local consumption is negligible (Cameron & Khair-uz-zaman, 2006). As mentioned above, most Afghan carpets are transported to Pakistan for the finishing stage and are then exported to the world market as Pakistani carpets. It is mentioned that over
520 M.H. Bilgin et al. Pakistan produces and exports both handmade and
machine-made carpets; however, the proportion of machine-made carpets is very low. Pakistan realized a decrease in the export of handmade carpets from 2005 to 2008. The value of exports was 284 million USD in 2005, but it declined to 186 million USD in 2008. Carpet and rugs exports accounted for 1.56, 1.37, and 1.14 of the total exports in 2005–2006, 2006–2007, and 2007– 2008, respectively. However, this value equaled an aver-age of 2.7 for the 1994–2002 period. Obviously, carpet exports, as a proportion of total exports, have declined in Pakistan (Trade Development Authority of Pakistan, n.d.6). The main reason for this dramatic decline is the start of the export of some Afghan handmade carpets over Afghanistan instead of over Pakistan in the last few years. Major markets for the Pakistan carpet industry in 2007–2008 were Germany, France, Turkey, South Africa, and Canada (Trade Development Authority of Pakistan, n.d.). When we compare these data to the major markets in 2002–2003, namely the United States, Germany, Italy, UK, and France, a change in buyers is observed (Cameron & Khair-uz-zaman, 2006).
Nepalese carpet industry
Nepalese carpets are made of the highest quality fleece wool, which is imported from Tibet, New Zealand, and
Britain.7 Nepalese handmade woolen carpets are major
export products of unique qualities, such as texture, color combinations, resiliency, strength, and durability. Around 95% of Nepalese carpet production is concen-trated in the Kathmandu valley. The Nepalese carpet industry is very important to the Nepalese economy. It is one of the highest employment generator industries in the country, especially for the rural people.
Woolen carpet exports constituted 32% of total exports exported to all countries other than India in the 2006–2007 fiscal year. However, in 2007–2008, this rate decreased to 23%. The values of woolen carpet exports to the all countries except India were 5838.7, 5600.2, and 5048.2 million rupees in 2005– 2006, 2006–2007, and 2007–2008, respectively. The annual manufacturing index for woolen carpets (the fiscal year 2003–2004 is 100) was 106.9 in 2005– 2006, 96.6 in 2006–2007, and 90.2 in 2007–2008. It is apparent that the manufacturing of woolen carpets has declined in the most recent years. Also, the volume of carpet exports peaked in the 1990s, but after 2000, the export volume (measured in square meters) declined (Chakrabarty, 2006).
Nepalese carpets have been exported to more than 40 countries and the leading export markets are Germany, the United States, Belgium, Britain, Turkey, Switzerland, Japan, Spain, Canada, and Italy. The United States and Germany are the two largest export
markets, with Germany’s share being more than 45% of the total carpet export market.
In the past, Nepal has faced problems regarding the use of illegal child labor and to overcome this problem,
the Nepal RUGMARK Foundation8 was established in
1995. Also, the Central Carpet Industries Association was established in July 1990 as a result of the need for coordinating policies and activities between the govern-ment and the carpet industry (http://nepalcarpet.org/ index.php?page=about).
Several studies prove that Nepal has revealed comparative advantage on carpets over various prod-ucts. Despite this importance, the carpet industry, which is a mainstay of the Nepalese manufacturing industry, has lost over half of its market in recent years due to decrease in demand, implemented price controls, long order cycles, and increased competition (Pant & Panta, 2009).
Empirical analysis of “handmade carpet” in the US market
In this section, we examine the revealed comparative advantage (RCA) index, the Kreinin–Finger similarity (KFS) index, and the export determinants of “handmade
carpet”9 in the US market using a gravity model.10
Export data of “handmade carpet” spanning from 1989 to 2008, involving Turkey and her five main
competitors11 in the US market, was collected. The
RCA index provides guidance to examine whether Turkey possesses a comparative advantage in the US market over her trade competitors.
Revealed comparative advantage (RCA) index
The RCA index is calculated as the percentage share of a country’s exports of “handmade carpet” divided by the share of the world exports of “handmade carpet”. If the index takes a value greater than unity, then the country is said to have revealed comparative advantage in the commodity. The calculated figure measures the relative importance of a country’s export of “handmade carpet” as compared with that for the world as a whole. If the calculated RCA is greater than unity, it implies that the country’s exports are moving closer to the pattern of the world exports of that partic-ular commodity.
Figure 1 summarizes the RCA index for Turkey and her main competitors for “handmade carpet” (SITC 6593). As observed from the figure, RCA values of all countries are lower than unity, which means that these countries do not have an RCA in handmade carpets. Turkey maintained high RCA over other countries before 1997, but this advantage disappeared eventually. Since 1992, as a result of the both domestic and international
problems and difficulties in the handmade carpet indus-try, Turkey is experiencing a sharp decline in its RCA. Turkey is supposed to make a crucial decision about the future of its handmade carpet production. The RCA of Iran declined from 1997 to 2006, but still Iran manages to keep its RCA over Turkey. Contrary to Turkey, the Iranian government has prepared several reforms to cope with the declining RCA. Although these two countries are experiencing decline in RCA for many years, the other countries mostly stayed under these two countries in terms of RCA values.
Figure 1.Revealed comparative advantage index (1989–2008).
Source: Authors’ estimates based on data from the UN Commodity Trade Statistics database (UN Comtrade).
Notes: RCAij = xij/Xwj, where xij is the share of commodity j in country i’s exports of “handmade carpet”, and Xwj is the share of commodity j in the world total exports of “handmade carpet”. Turkey, Iran, India, Pakistan, Nepal, and China are denoted by number 1, 2, 3, 4, 5, and 6, respectively.
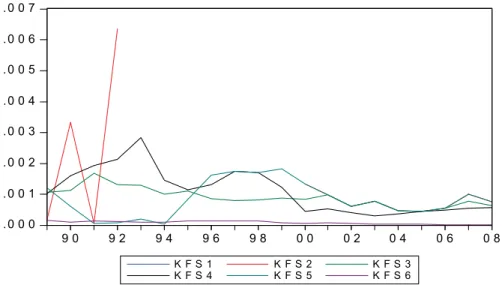
Kreinin–Finger similarity (KFS) index
We use the KFS index presented by Finger and Kreinin (1979) as a mean to measure the degree of export simi-larity of “handmade carpet” in the US market. The index is defined as the sum of the smaller value for which:
where x is the share of a commodity in exports, j is the product, and 1 and 2 are the two countries for which the index is being calculated.
The value of the index ranges from 0, where there is no overlap between the products the two countries export, to 1, when they have identical export structures. We use Turkey as the benchmark country for the purpose of comparison. Figure 2 presents the results, and we can observe that Iran and Pakistan have most similar export
structure in terms of “handmade carpet” in the early 1990s. However, this pattern was later on replaced by India and Nepal eventually. And after 2004, Pakistan also followed a similar export structure with India and Nepal. As a result of the strategies implemented by the PCMEA, Indian Carpet Export Promotion Council, and Nepalese Central Carpet Industries Association, these countries have increased their effectiveness in the hand-made carpet industry and have become the important competitors of Turkey in the United States and in the world handmade carpet market.
Figure 2.Kreinin–Finger similarity index (1989–2008).
Source: Authors’ estimates based on data from the UN Commodity Trade Statistics database (UN Comtrade).
Determinants of export performance
Model specification
The import demand function of “handmade carpet” imported from Turkey and her main competitors to the US market is specified using the following equation:
where i represents the exporting country (i = 1, …, 6);12
t (t = 1, …, 19), starting from year 1989, represents the
time at which transaction takes place; c denotes US
variables; IMit represents the US dollar value of
“hand-made carpet” exported from country i to the US market;
Y is GDP; y is per capita GDP; E is the real exchange
rate as per the unit of foreign currency; D is the
KFS=
∑
jMIN(xj1,xj2) (1) IM Y y Y y E D OPEN YD P KFS i t i t i t c t c t i t i t i t i t i t i t , , , , , , , , , , , ( = β β β β β β β β β β 1 2 3 4 5 6 7 8 9 10 2)Figure 1. Revealed comparative advantage index (1989–2008). Source: Authors’ estimates based on data from the UN
Com-modity Trade Statistics database (UN Comtrade). RCAij = xij/Xwj, where xij is the share of commodity j in country i’s exports of
“handmade carpet”, and Xwj is the share of commodity j in the world total exports of “handmade carpets”. Turkey, Iran, India,
522 M.H. Bilgin et al.
geographical distance (in km) between the capital of
country i and New York City of the US.
The focus of our study is on the determinants of
“handmade carpet” exported from country i to the US
market during 1989–2008. Some main determinants of
IMit are under our consideration. Firstly, textile industry is labor-intensive, so we expect that IMit is negatively correlated with exporting country’s per capita GDP (yit), whereas we use yi as a proxy for China’s capital inten-sity. The economic rationale is that a country tends to export fewer carpets when the country becomes rela-tively more capital abundant. In the same fashion, we expect that IMit and yct exhibit positive relation because importing countries that are more relatively abundant in capital are supposed to import more labor-intensive products such as carpets.
Secondly, we use exporting country’s GDP (Yit) as a proxy for carpet supply and expect that it is positively correlated with IMit.
Thirdly, we expect that the wealth of the importing country is positively correlated with its imports. We use importer’s GDP (Yct) as proxy for its wealth and expect that IMit and Yct are positively correlated.
Fourthly, we expect the real exchange rate as per the unit of foreign currency has a negative impact on country’s exports so that IMit and Eit are negatively correlated. Lastly, we normally expect that geographi-cal distance has a negative impact on exports; however, we would like to argue that such an effect may not be significant in our case because sourcing markets are rather diverged in this industry and hence distance may not play a significant role on carpet exports.
Other control variables include the following:
(1) Openness (i.e. total trade/GDP) (OPEN): this
variable indicates the degree of free trade of a country. We expect a positive sign for this vari-able because the more open the country is, the more trade opportunities take place.
(2) Real exchange rate (foreign currency/USD)
(RER): we expect a positive sign for this
variable because US dollar appreciation will induce more imports, holding other things constant.
(3) Per capita differential (US GDP – GDP of
exporting countries) (YD): this factor
repre-sents the degree of factor endowment differen-tial between two countries. The coefficient of this variable could be positive or negative. The reason for this ambiguity is that β8 would
be positive if Heckscher–Ohlin hypothesis13
holds and negative if the Linder hypothesis
holds.14 The former hypothesis proposed that
international trade pattern would be deter-mined by the relative factor endowments of different nations, while the latter hypothe-sized that nations with similar demands would develop similar industries and consumption goods for exchange.
(4) Unit price (USD/KG) (P): according to the law
of demand, higher the price or opportunity cost of importing the goods, lesser will the consumer be willing to buy. Therefore, we expect a nega-tive sign associated with this variable.
(5) KFS index (KFS): we expect a positive sign because the more concentrated is an exporting country on a product, the higher will be the import volume of that product.
Figure 2. Kreinin–Finger similarity index (1989–2008). Source: Authors’ estimates based on data from the UN Commodity
where αi captures all unobserved time-constant factors that affect Xit, where Xit is the natural log of the US dollar value of “handmade carpet” exported from coun-try i to the US market. αi is called unobserved effect or simply fixed effect and it does not change over time. Geographical features, such as the country’s location,
can be included in αi. Many other factors may not be
exactly constant, but might be roughly constant in the short run. The model is called the fixed-effect model. εit is the idiosyncratic error or time-varying error because it represents unobserved factors that change over time and affect Xit.
Empirical findings
One possibility to obtain estimates is to just pool the 19 years of data and use the ordinary least squares (OLS) technique. However, this method has three drawbacks. Firstly, it assumes that the effect of each explanatory variable has remained constant over time. Secondly, there may be heteroskedasticity in the error term under-lying the estimated equation. Thirdly, in order for pooled OLS to produce a consistent estimator, we would have to assume that the unobserved fixed effect, αi, is
uncorrelated with explanatory variables. However, if αi
is correlated with the explanatory variables, OLS will be biased, since αi is part of the error term. The fixed-effects estimator is an estimator which, like first differ-encing, uses a transformation to remove the unobserved
effect αi prior to the estimation. Any time-constant
explanatory variables are removed along with αi. Some more advantages for the panel data model are that with panel data, we can control for factors that vary across countries but do not vary over time. We can also control for those factors that could cause omitted vari-able bias if they are omitted in pooled OLS estimation. Moreover, since αi is unobserved or unmeasured, there-fore it cannot be included in the regression using multi-ple regression. Essentially, we need to determine between fixed and random effect by running a Hausman specification test as suggested by J.A. Hausman (1978). Normally, fixed effect is reasonable in dealing with panel data because it always gives consistent results; however, random effect is a more efficient estimator, so we should run random effects if it is statistically justifiable to do so. The Hausman test checks a more
tor estimated the same coefficients as done by the consistent fixed-effects estimator. The Chi-square statistics of the Hausman test is 39.11, which is signifi-cant at the 1% level, suggesting that fixed-effect model-ing is appropriate.
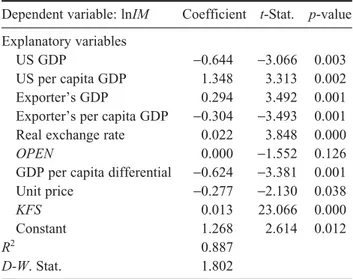
Table 5 shows that all variables are significant at 5% level, except for the proxy for openness, which is marginally significant (p = 0.126). The results suggest that imports will increase by 2.94%, as induced by a 10% increase in exporter’s GDP. It also shows that imports will decrease by 3.04%, as induced by a 10% increase in exporter’s per capita GDP. Moreover, a 10% increase in US per capita GDP will lead to 13.48% increase in import volume. However, this effect was cancelled out by a 6.4% decrease in exports due to a 10% increase in US GDP, implying that carpet is an inferior good in the United States.
The findings also suggest that whenever there is a 10% real depreciation/appreciation of US dollar against foreign currency, there is a 0.2% decrease/increase in imports. This finding suggests relatively low exchange rate import pass-through in carpet commodity. In addi-tion, β8 is negative, which supports the Linder hypothe-sis that countries with similar preferences and demand structures will tend to trade more. We also estimate a pooled regression model, which confirms a negative coefficient related to distance.
Conclusion
In Turkey, which has been known for many years as a “carpet country,” handmade carpet manufacturing has
ln ln ln ln ln ln ( , , , , , , , X Y y Y y E D OPEN YD P KFS i t i t i t c t c t i t i i i t = + + + + + + + + + + + + β β β β β β β β β β β α ε 0 1 2 3 4 5 6 7 8 9 10 3)
Table 5. Panel data estimation results on carpet import
(1989–2004).
Dependent variable: lnIM Coefficient t-Stat. p-value
Explanatory variables
US GDP −0.644 −3.066 0.003
US per capita GDP 1.348 3.313 0.002
Exporter’s GDP 0.294 3.492 0.001
Exporter’s per capita GDP −0.304 −3.493 0.001
Real exchange rate 0.022 3.848 0.000
OPEN 0.000 −1.552 0.126
GDP per capita differential −0.624 −3.381 0.001
Unit price −0.277 −2.130 0.038
KFS 0.013 23.066 0.000
Constant 1.268 2.614 0.012
R2 0.887
524 M.H. Bilgin et al.
been in a serious recession in the last decade. In the past, Turkey had an important position in the world handmade carpet market. Although Turkey has knowl-edge and a thriving culture in handmade carpet produc-tion that has been carried throughout its history, the Turkish handmade carpet and rug industry is undergo-ing a rough period. The main reason for its difficulties and problems is the cheap labor-based competitiveness of Far East countries, primarily China, India, Pakistan, and Nepal. Since labor as well as other costs is lower in these countries than they are in Turkey, Turkish hand-made carpet production is losing its competitive power both in the domestic market and in the world market.
Additionally, rapid changes in the consumer prefer-ences in this market, with design, models, and colors becoming more prominent, have caused Turkish hand-made carpet industry to enter into a dreary period. As the RCA index for Turkey indicates, Turkey’s RCA has been declining since 1992. However, despite this decline, the RCA of Turkey was above that of other countries until 1997. But after this, the advantage disap-peared eventually and was gained by Iran.
Turkey’s per capita GDP was 2.941 USD in 2002 and rose to 5.477 USD in 2006, with an increase of 86%. In addition to the increase in the per capita GDP, the implementation of 8 years of mandatory education in 1997 became an important problem for the industry. The increase in income and education levels in recent years has resulted in a decrease in the supply of weav-ers. Another important factor in the exports of Turkey is the overvalued Turkish Lira against USD. As indicated by the panel data estimation, the depreciation of US dollar against Turkish Lira has had a negative effect on the handmade carpet exports of Turkey.
As a consequence of these problems and difficulties, Turkey has lost its competitive advantage. Therefore, Turkey’s handmade carpet exports are gradually declin-ing and its handmade carpet imports are continuously increasing. Furthermore, in Turkey, handmade carpet and rug production is in a serious recession. The number of firms producing at high volumes has decreased substantially. This industry, which created employment for women and became a source of extra income for families for many years in rural areas, especially in mountain villages, has seen a great decline in employ-ment, and interest in weaving has dropped off.
If the current trend continues, handmade carpet and rug production in Turkey might cease as something of industrial magnitude, and production would continue only with cultural and artistic concerns. It could be expected, however, that, with the handmade carpet and rug trade, the importation of carpets from Far East countries will continue in the future.
For further studies, as the data about the handmade carpet industry is highly limited, a semi-structured
survey of the manufacturers in the handmade carpet sector can be performed to better understand the current situation in the Turkish handmade carpet industry. We believe that in this way, important policy implications in terms of fostering the handmade carpet exports can be achieved. Also, a survey of the consumers of hand-made carpets in the US market can be conducted. Hence, the determinants of handmade carpet such as design, color, and brand can also be analyzed.
Acknowledgements
The authors would like to thank the anonymous referees for their helpful comments and suggestions that improved the quality of this paper.
Notes
1. In this paper, the sections on Turkey, Iran, India, China,
and Afghanistan have been prepared based on a report written in 2008 in Turkish for the Istanbul Chamber of Commerce (see Bilgin and Demir (2008)).
2. Data is compiled from ITKIB reports.
3. The information on Indian carpet industry was collected
to a large extent from the website of Indian Carpet Export Promotion Council (http://www.india-carpets.com).
4. The PCMEA provides guidance to its members on issues
related to manufacturing and exporting (http://www. pcmea.com.pk).
5. http://www.aisa.org.af
6. Trade Development Authority of Pakistan develops
projects for value-added exports and implements market-ing consultant for the carpet sector to establish and strengthen the marketing of carpets to create a successful image and to achieve long-term competitiveness in the world market.
7. The information about the Nepalese carpet industry
was collected, to a large extent, from the website of Trade and Export Promotion Centre of Nepal (http:// www.tepc.gov.np) and the Nepal Rastra Bank (http:// www.nrb.org.np).
8. http://www.nepalrugmark.org/about.php
9. The definition given by the United Nations Statistics
Division Classification Registry using the Standard International Trade Classification, Revision 3 (SITC, Rev. 3). The SITC code that defined “textile floor coverings, kelem, schumacks, karamanie, and similar handwoven rugs” is 6593.
10. The issues of bilateral trade flows and trade elasticity are
examined widely in the literature (see, e.g. Bergstrand, 1985, 1989; Carrillo and Li, 2002; Christie, 2002; Egger and Pfaffermayr, 2003; Mátyás, Konya, and Harris, 2000; Mathur, 1999; Sharma and Chua, 2000).
11. Main competitors including Iran, Pakistan, India, Nepal,
and China. However, due to data constraint, we did not include Afghanistan in the empirical analysis.
12. Turkey, Iran, India, Pakistan, Nepal, and China are
denoted by number 1, 2, 3, 4, 5, and 6, respectively.
13. The Heckscher–Ohlin theorem predicts that a
capital-abundant country will export the capital-intensive good, while the abundant country will export the labor-intensive good. This implies that a country will import more from another country if the factor endowment in her
closer between these two nations.
References
AISA. (2005). Investing in Afghanistan: Business opportuni-ties in the carpet industry. Retrieved June 29, 2010, from http://www.rugandcarpets.com/pdfs/carpet-afghania.pdf AISA. (2007). Support market business opportunities,
subsec-tor analysis and business plan development/North & NE/ Economic viability & technical feasibility. Retrieved June 28, 2010, from http://www.aisa.org.af/Downloads/mrrd/ Almonds%20-%20%20processing%20plant.pdf
Alkan, F. (2008). Dunya hali pazarlari ve Turkiye’nin durum tespiti [World carpet markets and position of Turkey]. Retrieved June 28, 2010, from http://www.itkib.org.tr/ ihracat/DisTicaretBilgileri/raporlar/dosyalar/dunya_hali_ pazari_ve_Turkiye.pdf
Bakhshandeh, E. (2006, September 12). Persian carpets. Iran Daily. Retrieved from http://www.iran-daily.com/1385/ 2658/html/focus.htm
Banwal, O.A.B. (2005). Status and prospects for Afghani-stan’s industries: Sectoral study on handy-crafts with emphasis on carpet weaving. Kabul: KAS Office. Bazargani, B. (1997). The status of carpet in Iran’s economy.
The Institute for Commercial Studies & Research Magazine, 120 (August). Retrieved June 28, 2010, from http://www.iraniantrade.org/carpets.htm
Bergstrand, J.H. (1985). The gravity equation in international trade: Some microeconomic foundations and empirical evidence. Review of Economics and Statistics, 67(3), 474–481.
Bergstrand, J.H. (1989). The generalized gravity equation, monopolistic competition, and the factor-proportions theory in international trade. Review of Economics and Statistics, 71(1), 143–153.
Bilgin, M.H., & Demir, E. (2008). Turkiye el haliciligi sektor
arastirmasi [Turkish handmade carpet industry
research]. Istanbul: Istanbul Chamber of Commerce. Cameron, S., & Khair-uz-zaman. (2006). Export supply
function estimates for the Pakistan carpet industry. The Pakistan Development Review, 45(4), Part II (Winter), 1287–1297.
Carrillo, C., & Li, C.A. (2002). Trade blocks and the gravity model: Evidence from Latin American countries. Economics Discussion Papers 542. Department of Economics, University of Essex. Retrieved June 29, 2010, from http://www.essex.ac.uk/economics/research/ discussion-papers/papers-text/dp542.pdf
Chakrabarty, S. (2006). Does social labeling displace child labor and increase child schooling? Evidence from Nepal. ZEF, University of Bonn. Retrieved June 28, 2010, from http://www.zef.de/module/register/media/ c6ec_Child%20Labor_ILO%20Presentation.pdf
Christie, E. (2002). Potential trade in southeast Europe: A gravity model approach. WIIW Working Paper 21. Vienna: WIIW.
Egger, P., & Pfaffermayr, M. (2003). The proper panel econo-metric specification of the gravity equation: A three-way model with bilateral interaction effects. Empirical Economics, 28(3), 571–580.
Econometrica, 46, 1251–1271.
Iran Commerce. (2000). Production and export of hand-woven carpets. Iran Commerce, 2–3. Retrieved, from http:// www.iccim.org/English/Magazine/iran_commerce/ no23_ 2000/18.htm
ITKIB. (2008). Hali sektorunun yillik ihracat performans degerlendirmesi 2007 [An evaluation of annual export performance of handmade carpet industry 2007]. Retrieved June 28, 2010, from http://www.itkib.org.tr/ ihracat/DisTicaretBilgileri/raporlar/dosyalar/2007/2007_ ocak_aralik_hali_performans.pdf
Keshavarzian, A. (2006). Bazaar and state in Iran. New York: Cambridge University Press.
Kurata, P. (2007, October 31). Afghanistan carpet industry prepares for global market. The Financial Express. Retrieved June 28, 2010, from http://www.thefinancialex-press-bd.com/search_index.php?news_id=15733&page= detail_news
Mathur, S.K. (1999). Pattern of international trade, new trade theories and evidence from gravity equation analyses. Paper presented at the Third International Conference on “Enterprise in Transition”, Split, Croatia.
Mátyás, L., Konya, L., & Harris, M. (2000). Modelling export activity of eleven APEC countries. Melbourne Institute Working Paper 5/00. Melbourne Institute of Applied Economic and Social Research, The University of Melbourne.
McCord, M.T. (2007). An analysis of business opportunities within Afghanistan’s carpet sector. Retrieved June 28, 2010, from http://trade.gov/static/ afghanistan_investorcarpets.pdf
Nasir, Z.M. (2004). A rapid assessment of bonded labour in the carpet industry of Pakistan. Special Action Programme to Combat Forced Labour. Working Paper 23. Geneva: International Labour Office.
Pant, B., & Panta, R.K. (2009). Export diversification and competitiveness: Nepal’s experiences. Economic Review, Occasional Paper 21 (pp. 52–79). Retrieved June 27, 2010, from http://red.nrb.org.np/publications/economic_review/ Economic_Review_%28Occasional_Paper%29--No_21_ %28April %202009%29-pdf
Sharma, S.C., & Chua, S.Y. (2000). ASEAN: Economic integration and intra-regional trade. Applied Economics Letters, 7(3), 165–169.
Sobhe, K. (2008). Persian rugs and coalition of Iranian entrepreneurs AHAM Los Angeles. Retrieved June 30, 2010, from http://rugmaster.blogspot.com/2008/05/ persian-rugs-and-coalition-of-iranian.html
Srivastava, S., & Goswami, K.K. (2007). Handmade carpets: The potential for socio-economic growth. The Innovation Journal: The Public Sector Innovation Journal, 12(2), Arti-cle 5. Retrieved June 30, 2010, from http://www.innova-tion.cc/scholarly-style/srivastava_handmade _carpet5.pdf Surek, S. (2008, May 15). Halicilik sektorunun kurtulusu markalasma ve desen devriminde [The survival of the carpet industry is in the branding and design revolu-tion]. Referans Daily. Retrieved June 27, 2010, from http://www.referansgazetesi.com/haber.aspx?HBR_ KOD=96978.
Trade Development Authority of Pakistan (n.d.). http:// www.tdap.gov.pk/v1/statistics/
526 M.H. Bilgin et al.
Undersecretariat of the Prime Ministry for Foreign Trade. (2007). Dunyada ve Turkiye’de El Haliciligi Sektoru [The handmade carpet industry in the world and Turkey]. Report of the Third Workshop Meeting.
USAID. (2005). Constraints and opportunities in market-ing carpets. Afghanistan Carpet Committee. OTF
Group, Kabul. Retrieved June 29, 2010, from http:// www.afghanpastoralists.com/presentations/Kuchi%20 conf%20OTF%2011%2015.ppt
USAID. (2006). Growth strategy and action plan for the carpet cluster of Afghanistan. Afghanistan Carpet Committee, OTF Group, Kabul. Retrieved June 29, 2010, from http:// trade.gov/static/afghanistan_carpetstrategy.pdf