U. Ü. ZİRAAT FAKÜLTESİ DERGİSİ, 2013, Cilt 27, Sayı 2, 55-69 (Journal of Agricultural Faculty of Uludag University)
The Effects of Lecithin and Polyglycerol Polyricinoleate
(PGPR) on Quality of Milk, Bitter and White Chocolates
Burak Barkın PEKER
1, Senem SUNA
1,
Canan Ece TAMER
1, Ömer Utku ÇOPUR
1*1
Uludağ Üniversitesi Ziraat Fakültesi Gıda Mühendisliği Bölümü
*e-posta: [email protected]; Tel: 0 224 2941490 Fax: 0224 2941402
Geliş Tarihi: 08.11.2013; Kabul Tarihi: 13.12.2013
Abstract: In this research, the effects of different concentrations of lecithin and polyglycerol polyricinoleate (PGPR) combinations in terms of physical, chemical and sensory quality parameters of the milk, bitter and white chocolate samples were studied. With this aim, different concentrations of lecithin (0.1%, 0.25%, 0.5%) and PGPR (0.02%, 0.05%, 0.1%) were added as combination into chocolate samples. It was determined that 0.5% lecithin + 0.1% PGPR was the most appropriate combination for affecting the viscosity and yield point. However, different lecithin and PGPR combinations did not have statistically significant effect on particle size, chemical and sensory properties of the samples.
Key Words: Chocolate, Lecithin, Polyglycerol Polyricinoleate (PGPR), Viscosity, Yield Point, Quality.
Lesitin ve Polyglycerol Polyricinoleate (PGPR)’ın Sütlü, Bitter ve
Beyaz Çikolataların Kalitesi Üzerine Etkileri
Özet: Bu araştırmada, farklı konsantrasyonlardaki lesitin ve polyglycerol polyricinoleate (PGPR) kombinasyonlarının sütlü, bitter ve beyaz çikolataların fiziksel, kimyasal ve duyusal kalite parametreleri üzerindeki etkileri incelenmiştir. Bu amaçla, farklı konsantrasyonlardaki lesitin (%0.1, %0.25, %0.5) ve PGPR (%0.02, %0.05, %0.1) çikolata örneklerine kombine olarak ilave edilmiştir. Vizkozite ve akma noktası bakımından, %0.5 lesitin + %0.1 PGPR uygulamasının en uygun kombinasyon olduğu belirlenmiştir. Bununla birlikte farklı lesitin ve PGPR kombinasyonlarının örneklerin partikül büyüklüğü ile kimyasal ve duyusal özellikleri üzerinde istatistiksel olarak önemli bir etkisi yoktur.
Anahtar Sözcükler: Çikolata, Lesitin, Polyglycerol Polyricinoleate (PGPR), Viskozite, Akma Noktası, Kalite.
Introduction
Chocolate is a semi-solid suspension of fine non-fat solid particles (sugar, cocoa solids and milk solids), about 70% total, in a continuous fat phase (cocoa butter). Conventional chocolate contains 30-40% fat, from both milk fat and cocoa butter (Beckett, 2008). Chocolate is almost unique as a food in that it is solid at normal room temperatures yet melts easily in the mouth. This is because cocoa butter is mainly solid at temperatures below 25°C when it holds all the sugar and cocoa particles together. The fat is, however, almost entirely liquid at body temperature enabling the particles to flow past one another, so the chocolate becomes a smooth liquid when it is heated in the mouth. In chocolate, the fat gives desirable physical characteristics, such as snap, gloss, creamy texture, rich taste and melt-in-the-mouth quality (Afoakwa et al., 2007; Beckett, 2008; Norton et al., 2009).
Primary chocolate categories are bitter, milk and white those differ in content of cocoa solid, milk fat and cocoa butter. Chocolate manufacturing processes consist of mixing, refining and conching of chocolate paste (Afoakwa et al., 2007). The quality of chocolate is determined by the processing steps, inherent size distribution of solid particles from sugar, milk and cocoa, composition of fat phase and emulsifiers used in the production of the chocolate (Prawira and Barringer, 2008; Afoakwa et al., 2008).
Chocolate has a continuous fat phase in which sugar, being hydrophilic will not dissolve, so surfaces have to be coated with fat. This does not occur readily and an emulsifier is beneficial and allows the fat content of the chocolate to be reduced while maintaining desirable rheological properties which are important in manufacturing process for obtaining high-quality products with well-defined texture. Viscosity relates to composition, processing strategy and particle size distribution. Apparent viscosity in aqueous solutions influences flavour ‘by-mouth’ and taste intensity during consumption, thus rheological measurements often give information related to sensory character of chocolate (Beckett, 2008; Afoakwa et al., 2007).
Cocoa butter is an expensive constituent of chocolate. Its role in modulating the rheological properties of chocolate may be accomplished by incorporating relatively small amounts of certain emulsifiers (Ghorbel et al., 2011). Lecithin and polyglycerol polyricinoleate (PGPR) are used to modify the flow properties of chocolate masses in commercial chocolate production. They lower the interfacial tension between the dispersed and the continuous phase and affect the sensitivity to moisture and temperature, the tempering behaviour, susceptibility to fat bloom, stability to fat migration from fillings and oxidation (Schantz and Rohm, 2005). Lecithin, a complex mixture of mainly phosphatidylcholine, phosphatidylethanolamine, phosphatidylinositol and phosphatidic acid, is usually added in conching in concentrations of 3-6 g/kg chocolate mass. According to Chevalley (1999), the addition of 1-3 g/kg soy lecithin causes the same viscosity-reducing effect as approximately 10 times this amount of added cocoa butter, thus allowing to reduce production costs by saving cocoa butter (Schantz and Rohm, 2005; Knoth et al., 2005; Millqvist-Fureby and Smith, 2007; Hasenhuettl and Hartel, 2008). PGPR, which is prepared by partial esterification of condensed castor oil fatty acids with polyglycerol, is a powerful emulsifier, which can be used for the obtaining of stable water-in-oil emulsions. Its high emulsifying properties are attributed to the excellent water-binding capacity of the long hydrophilic polyglycerol chain. PGPR is commonly used along with lecithin to diminish the viscosity of chocolate covertures (Schantz and Rohm, 2005; Márquez et al.,
2010). PGPR mainly reduces the yield value of chocolate, while lecithin alters the plastic viscosity. PGPR also increases the lipophilicity of the sucrose. This induces a decrease in the sucrose-sucrose interactions and thus explains the increased fluidity of the fat-based suspension (Rousset et al., 2002). The addition of PGPR to melted chocolate leads to a significant decrease of the yield stress, far beyond the values of lecithinated chocolate, whereas viscosity is only slightly lowered. These effects allow processing at lower temperatures and simplify the handling of chocolate masses especially in case of low shear rates during moulding and facilitate the removal of air bubbles. Moreover, it becomes possible to create innovative products with very thin coatings or layers, and filigree surface designs. The advantages of PGPR may be increased by combining it with lecithin. Depending on the application, the optimum lecithin/PGPR blends are given with 2:1, 2.5:1 and 3:1 (Schantz and Rohm, 2005). PGPR was considered GRAS (Substance Generally Recognized as Safe) by the FDA (Márquez et al., 2010).
Control of chocolate viscosity is vital to its quality and production cost, and directly influenced by solids particle size distribution (PSD) and composition. Rheologically, molten chocolates behave as non-Newtonian liquids with yield stress and plastic viscosity, dependent on processing. PSD, central to rheological properties, has a direct influence on sensory character. The largest particles are important for mouth-feel notably grittiness, but smaller particles influence flow properties. Generally, chocolate viscosity is controlled by addition of cocoa butter, lecithin and PGPR (Afoakwa et al., 2008).
The emulsifiers used in the production of the chocolate has great importance on the product quality like processing steps, size distribution of solid particles and composition of fat phase. The aim of this research was to determine the most proper combinations of lecithin and PGPR and the effects of using different concentrations of these emulgators in terms of physical, chemical and sensory quality parameters of the milk, bitter and white chocolate samples.
Materials and Methods
Materials
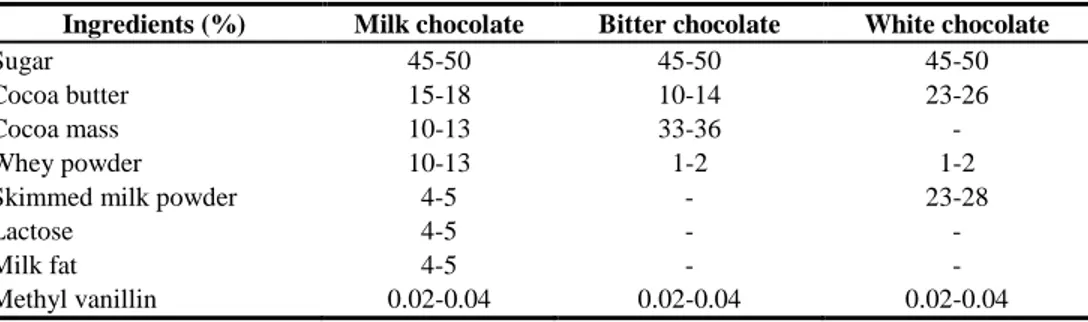
Milk, bitter and white chocolates were produced in a private company (Bursa, Turkey). Ingredients of chocolate samples were given in Table 1. While the difference between the milk and bitter chocolate is the use of milk powder, the difference between the milk and white chocolate is the use of milk cocoa mass. The lecithin used was non-genetically modified soy lecithin and the origin of the PGPR was castor oil.
Table 1. Ingredients of chocolate samples
Ingredients (%) Milk chocolate Bitter chocolate White chocolate
Sugar 45-50 45-50 45-50
Cocoa butter 15-18 10-14 23-26
Cocoa mass 10-13 33-36 -
Whey powder 10-13 1-2 1-2
Skimmed milk powder 4-5 - 23-28
Lactose 4-5 - -
Milk fat 4-5 - -
Methods
Chocolate production
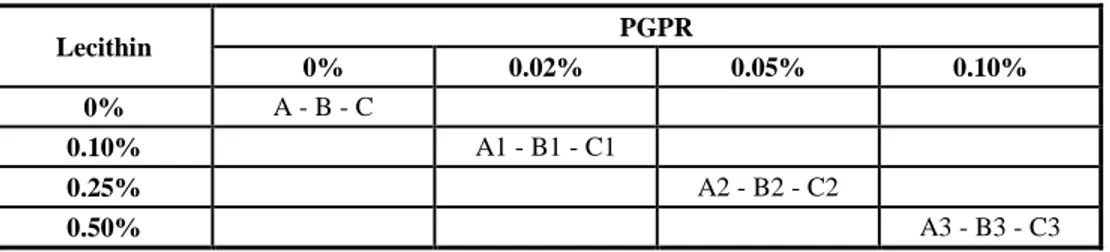
After mixing of the ingredients at 45⁰C for 5-10 min, they agglomerated in thick paste. A five roll refiner reduced the particle size up to 19-20 µm. Moisture was removed, flavour developed and final viscosity of the chocolate adjusted with conching (6-9 h). At the end of the conching, products were transferred into containers (10 kg) and stored at 45-50⁰C. Lecithin and PGPR was added into the samples according to predetermined ratio (Table 2). The most stable form of cocoa butter crystals were obtained via tempering. Then the products moulded, cooled and packaged.
Table 2. Lecithin and PGPR concentrations of chocolate samples
Lecithin PGPR 0% 0.02% 0.05% 0.10% 0% A - B - C 0.10% A1 - B1 - C1 0.25% A2 - B2 - C2 0.50% A3 - B3 - C3
A: milk chocolate, B: Bitter chocolate, C: white chocolate
Physico-chemical analysis
Viscosity and yield point of the chocolate samples were measured at 40⁰C by viscosimeter (Haake VT-550, Thermo Scientific) according to International Office of Cocoa, Chocolate and Sugar Confectionery (IOCCC), “Viscosity of Cocoa and Chocolate Products”, Analytical Method 46 (2000) (Anonymous, 2000). Particle size analysis was measured at room temperature by hand micrometer (Mitutoyo, USA). Moisture of the samples was determined by oven dry method at 102⁰C for 5 h. Fat content of the chocolates was determined by soxhlet extraction, ash content was determined by ashing of the samples for 16 h, protein content of the samples were determined by Kjeldahl method (Anonymous 1990).
Sensory analysis
Comparative profile test was applied for sensory analysis with six trained panelists from the production company. ANOVA test was applied (p<0.05). Data from ANOVA were used for Sensory Comparative Profile Test Tool and graphics were obtained. While the samples A and B were evaluated for cocoa taste, milk taste, sweetness and bitter taste; the sample C was evaluated for milk taste and sweetness.
Statistical analysis
SPSS for Windows (Version 16) was used for statistical analysis. Least Significant Difference (LSD) test was applied. Results were given as the mean of five replicates ± standard deviation.
Results and Discussion
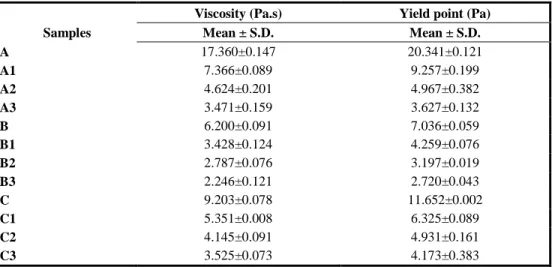
Use of lecithin and PGPR changes rheological properties of chocolate and give opportunity to manufacture standard product. After addition of lecithin and PGPR to the chocolates physico-chemical analysis were applied. The results of viscosity and yield point analysis of the milk, bitter and white chocolate samples were given in Table 3.
Table 3. The results of viscosity and yield point analysis of chocolate samples Viscosity (Pa.s) Yield point (Pa)
Samples Mean ± S.D. Mean ± S.D.
A 17.360±0.147 20.341±0.121 A1 7.366±0.089 9.257±0.199 A2 4.624±0.201 4.967±0.382 A3 3.471±0.159 3.627±0.132 B 6.200±0.091 7.036±0.059 B1 3.428±0.124 4.259±0.076 B2 2.787±0.076 3.197±0.019 B3 2.246±0.121 2.720±0.043 C 9.203±0.078 11.652±0.002 C1 5.351±0.008 6.325±0.089 C2 4.145±0.091 4.931±0.161 C3 3.525±0.073 4.173±0.383 S.D: standard deviation
Schantz and Rohm (2005) reported that when the concentration of lecithin and PGPR increased in milk and bitter chocolates, viscosity and yield point of the samples decreased. Karnjanolarn and McCarthy (2006) stated that both addition of little amount lecithin and PGPR affects viscosity of the chocolate directly. Afoakwa et al. (2007) reported that, addition of PGPR to chocolate including 0.5% lecithin caused decreasing of yield point to the highest degree. Especially the sample C3 showed a significant decrease of yield point.
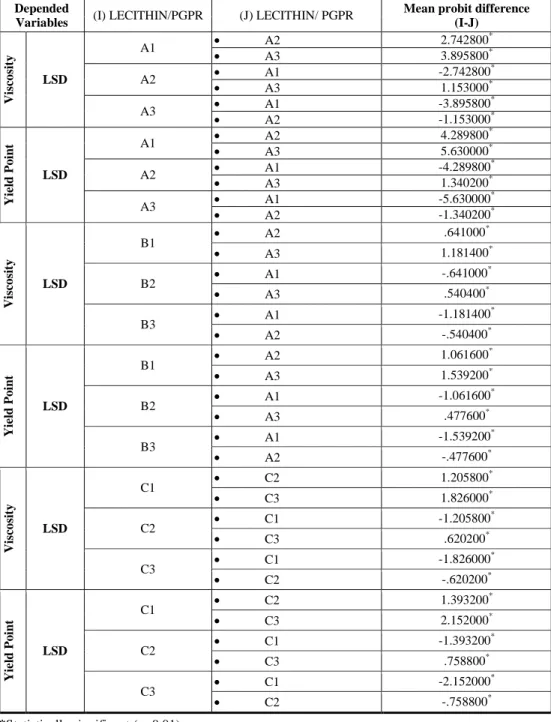
The differences between the viscosity and yield point of the milk, bitter and white chocolate samples were statistically significant (p<0.01) (Table 4).
Table 4. The Results of the LSD test of viscosity and yield point of chocolates
Depended
Variables (I) LECITHIN/PGPR (J) LECITHIN/ PGPR
Mean probit difference (I-J) V is co si ty LSD A1 • A2 2.742800 * • A3 3.895800* A2 • A1 -2.742800 * • A3 1.153000* A3 • A1 -3.895800 * • A2 -1.153000* Y ie ld P o in t LSD A1 • A2 4.289800 * • A3 5.630000* A2 • A1 -4.289800 * • A3 1.340200* A3 • A1 -5.630000 * • A2 -1.340200* V is co si ty LSD B1 • A2 .641000 * • A3 1.181400* B2 • A1 -.641000 * • A3 .540400* B3 • A1 -1.181400 * • A2 -.540400* Y ie ld P o in t LSD B1 • A2 1.061600 * • A3 1.539200* B2 • A1 -1.061600 * • A3 .477600* B3 • A1 -1.539200 * • A2 -.477600* V is co si ty LSD C1 • C2 1.205800 * • C3 1.826000* C2 • C1 -1.205800 * • C3 .620200* C3 • C1 -1.826000 * • C2 -.620200* Y ie ld P o in t LSD C1 • C2 1.393200 * • C3 2.152000* C2 • C1 -1.393200 * • C3 .758800* C3 • C1 -2.152000 * • C2 -.758800* *Statistically significant (p<0.01).
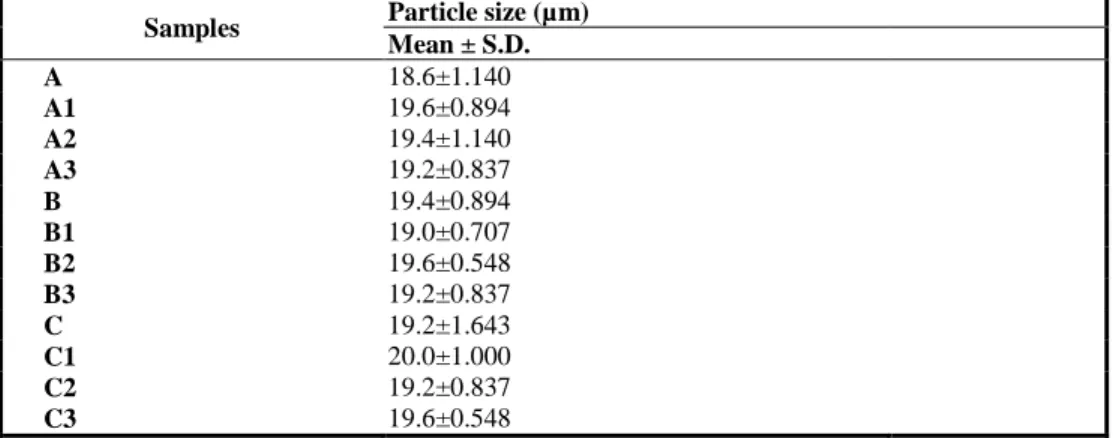
Particle sizes of the samples were shown in Table 5. Lecithin and PGPR addition did not affect the particle size of the milk chocolate samples.
Table 5. Particle size of chocolate samples Samples Particle size (µm)
Mean ± S.D. A 18.6±1.140 A1 19.6±0.894 A2 19.4±1.140 A3 19.2±0.837 B 19.4±0.894 B1 19.0±0.707 B2 19.6±0.548 B3 19.2±0.837 C 19.2±1.643 C1 20.0±1.000 C2 19.2±0.837 C3 19.6±0.548
As it was shown in Figure 1, Figure 2 and Figure 3, there was no difference between the appearance and color of the chocolate samples.
Figure 1. The Photographs of Milk Chocolate Samples
Figure 3. The Photographs of White Chocolate Samples
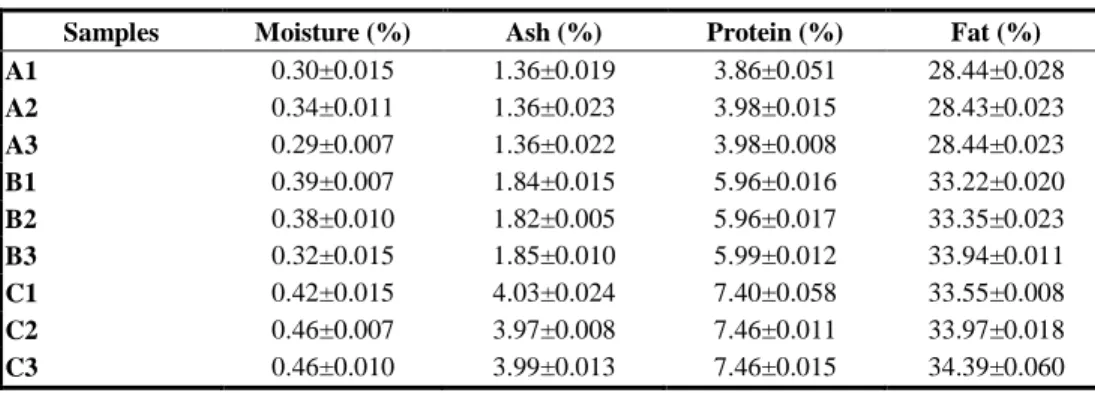
There were no statistically significant differences between the ash and fat contents of the milk chocolate samples, the differences between the moisture and protein content of the samples were statistically significant (p<0.05). However, the differences between the moisture, ash, protein and fat content of some bitter and white chocolate samples were statistically significant (p<0.05). These differences were not important for technological and organoleptic aspects (Table 7). The higher fat content was determined in the white chocolate samples, because white chocolates did not contain cocoa mass and had higher fat in their recipe (Table 6 and Table 7).
Table 6. The results of the analysis of chocolate samples (Mean ± S.D.)
Samples Moisture (%) Ash (%) Protein (%) Fat (%) A1 0.30±0.015 1.36±0.019 3.86±0.051 28.44±0.028 A2 0.34±0.011 1.36±0.023 3.98±0.015 28.43±0.023 A3 0.29±0.007 1.36±0.022 3.98±0.008 28.44±0.023 B1 0.39±0.007 1.84±0.015 5.96±0.016 33.22±0.020 B2 0.38±0.010 1.82±0.005 5.96±0.017 33.35±0.023 B3 0.32±0.015 1.85±0.010 5.99±0.012 33.94±0.011 C1 0.42±0.015 4.03±0.024 7.40±0.058 33.55±0.008 C2 0.46±0.007 3.97±0.008 7.46±0.011 33.97±0.018 C3 0.46±0.010 3.99±0.013 7.46±0.015 34.39±0.060
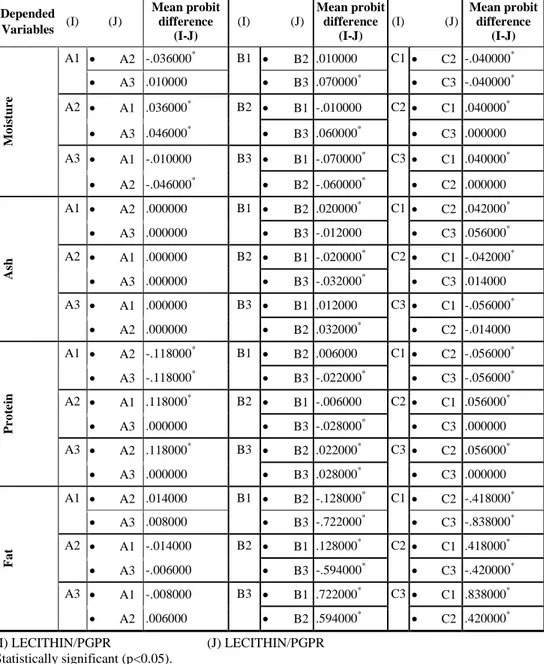
Table 7. The results of the LSD test of moisture, ash, protein and fat content of chocolate samples Depended Variables (I) (J) Mean probit difference (I-J) (I) (J) Mean probit difference (I-J) (I) (J) Mean probit difference (I-J) M o is tu re A1 • A2 -.036000* B1 • B2 .010000 C1 • C2 -.040000* • A3 .010000 • B3 .070000* • C3 -.040000* A2 • A1 .036000* B2 • B1 -.010000 C2 • C1 .040000* • A3 .046000* • B3 .060000* • C3 .000000 A3 • A1 -.010000 B3 • B1 -.070000* C3 • C1 .040000* • A2 -.046000* • B2 -.060000* • C2 .000000 A sh A1 • A2 .000000 B1 • B2 .020000* C1 • C2 .042000* • A3 .000000 • B3 -.012000 • C3 .056000* A2 • A1 .000000 B2 • B1 -.020000* C2 • C1 -.042000* • A3 .000000 • B3 -.032000* • C3 .014000 A3 • A1 .000000 B3 • B1 .012000 C3 • C1 -.056000* • A2 .000000 • B2 .032000* • C2 -.014000 P r o te in A1 • A2 -.118000* B1 • B2 .006000 C1 • C2 -.056000* • A3 -.118000* • B3 -.022000* • C3 -.056000* A2 • A1 .118000* B2 • B1 -.006000 C2 • C1 .056000* • A3 .000000 • B3 -.028000* • C3 .000000 A3 • A2 .118000* B3 • B2 .022000* C3 • C2 .056000* • A3 .000000 • B3 .028000* • C3 .000000 F a t A1 • A2 .014000 B1 • B2 -.128000* C1 • C2 -.418000* • A3 .008000 • B3 -.722000* • C3 -.838000* A2 • A1 -.014000 B2 • B1 .128000* C2 • C1 .418000* • A3 -.006000 • B3 -.594000* • C3 -.420000* A3 • A1 -.008000 B3 • B1 .722000* C3 • C1 .838000* • A2 .006000 • B2 .594000* • C2 .420000*
(I) LECITHIN/PGPR (J) LECITHIN/PGPR Statistically significant (p<0.05).
The results of the sensory analysis of the milk chocolate samples were given in Figure 4, Figure 5 and Figure 6. Firstly, the sample A2 accepted as reference then A1 and A3 evaluated; after that, A3 accepted as reference then A1 evaluated. Panelists did not determine the difference between cocoa taste, milk taste, sweetness and bitter taste (p<0.05).
-5 -4 -3 -2 -1 0 1 2 3 4 5 Kakao Tadı
Süt Tadı
Tatlılık
Bitter Tat
Comparative Profile Test A1 and A2 (Ref)
Figure 4. The results of the sensory analysis of milk chocolate samples (A1 and A2)
-5 -4 -3 -2 -1 0 1 2 3 4 5
Kakao Tadı
Süt Tadı
Tatlılık
Bitter Tat
Comparative Profile Test A3 and A2 (Ref)
-5 -4 -3 -2 -1 0 1 2 3 4 5 Kakao Tadı
Süt Tadı
Tatlılık
Bitter Tat
Comparative Profile Test A1 and A3 (Ref)
Figure 6. The results of the sensory analysis of milk chocolate samples (A1 and A3)
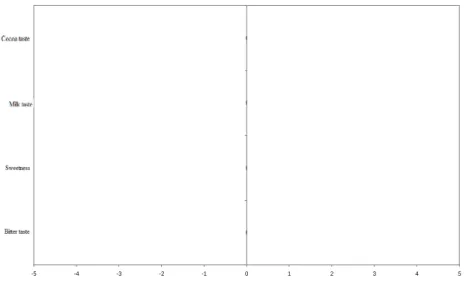
The results of the sensory analysis of the bitter chocolate samples were given in Figure 7, Figure 8 and Figure 9. Firstly, the sample B2 accepted as reference then B1 and B3 evaluated; after that, B3 accepted as reference then B1 evaluated. Panelists did not determine the difference between cocoa taste, milk taste, sweetness and bitter taste (p<0.05). -5 -4 -3 -2 -1 0 1 2 3 4 5 Kakao Tadı Süt Tadı Tatlılık Bitter Tat
Comparative Profile Test B1 and B2 (Ref)
-5 -4 -3 -2 -1 0 1 2 3 4 5 Kakao Tadı
Süt Tadı
Tatlılık
Bitter Tat
Comparative Profile Test B3 and B2 (Ref)
Figure 8. The results of the sensory analysis of the bitter chocolate samples (B3 and B2)
-5 -4 -3 -2 -1 0 1 2 3 4 5
Kakao Tadı
Süt Tadı
Tatlılık
Bitter Tat
Comparative Profile Test B1 and B3 (Ref)
Figure 9. The results of the sensory analysis of the bitter chocolate samples (B1 and B3)
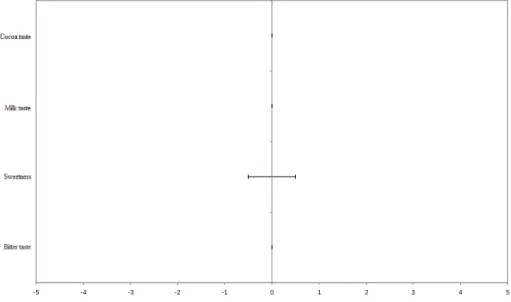
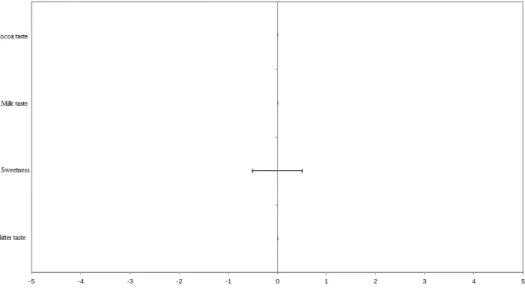
The results of the sensory analysis of the white chocolate samples were given in Figure 10, Figure 11 and Figure 12. Firstly, the sample C2 accepted as reference then C1 and C3 evaluated; after that, C3 accepted as reference then C1 evaluated. Panelists did not determine the difference between milk taste and sweetness (p<0.05).
-5 -4 -3 -2 -1 0 1 2 3 4 5 Süt Tadı
Tatlılık
Comparative Profile Test C1 and C2 (Ref)
Figure 10. The results of the sensory analysis of the white chocolate samples (C1 and C2)
-5 -4 -3 -2 -1 0 1 2 3 4 5
Süt Tadı
Tatlılık
Comparative Profile Test C3 and C2 (Ref)
-5 -4 -3 -2 -1 0 1 2 3 4 5 Süt Tadı
Tatlılık
Comparative Profile Test C1 and C3 (Ref)
Figure 12. The results of the sensory analysis of the white chocolate samples (C1 and C3)
Conclusion
Use of very low amount of lecithin and PGPR in chocolate production directly affected the viscosity and yield point of the samples. Addition of these two emulgators together has synergistic effect and in this way desired rheological properties could be obtained. However, particle size of the samples was not affected from the addition of these emulgators. Also there was no significant difference between the sensory characteristics of the chocolates.
Although there were no statistically significant differences between the moisture, ash, protein and fat contents of some chocolate samples, the differences between the same properties of some samples were statistically significant. These differences were not important for technological and organoleptic aspects.
The best results were obtained from the samples were A3 (0.5% lecithin + 0.1% PGPR) in milk chocolates, B3 (0.5% lecithin + 0.1% PGPR) in bitter chocolates and C3 (0.5% lecithin + 0.1% PGPR) in white chocolates.
For preparation of the recipe of chocolate, preliminary tests should be done to determine suitable lecithin: PGPR ratio. Moreover, operating conditions, ambient temperature, relative humidity and product moisture have also importance. Especially viscosity and yield point are important at moulding process in tablet chocolate manufacturing. Adjusting the amount and thickness of chocolate covered products is possible with maintaining appropriate rheological properties. It is also important for optimization of the production quality and cost.
References
Afoakwa, E.O., A. Paterson, and M. Fowler. 2007. Factors influencing rheological and textural qualities in chocolate a review. Trends Food Sci. Technol. 18, 290-298.
Afoakwa, E .O., A. Paterson, and M. Fowler. 2008. Effects of particle size distribution and composition on rheological properties of dark chocolate. Eur. Food Res. Technol. 226, 1259-1268.
Anonymous. 1990. Turkish Chocolate Standard. TS 7800. Turkish Standard Institute, Ankara. Anonymous. 2000. International Office of Cocoa, Chocolate and Sugar Confectionery (IOCCC).
Viscosity of Cocoa and Chocolate Products. Analytical Method 46 (2000)
- Available from CAOBISCO, Rue Defacqz 1, 1000 Bruxelles, Belgium (ht tp: / /www. caobisco.be) . Beckett, S.T. 2008. The Science of Chocolate. Nestle Product Technology Center, York, UK, 240 pp. Chevalley, J. 1999. Chocolate flow properties. In: Industrial Chocolate Manufacture and Use (3rd
ed.). S.T. Beckett (Ed.), Oxford: Blackwell Science. pp. 182-200.
Ghorbel, D., I. Saidi, M.B. Slema and M. Gharsallah. 2011. Adjusting flow properties of molten milk chocolate by means of emulsifiers and fat. J. Food Process Eng. 34(2), 317-331.
Hasenhuettl, L.G. and W.R. Hartel. 2008. Food Emulsifiers and their Applications. Springer-Verlag New York Inc., USA, 433 pp.
Karnjanolarn, R. and K.L. McCarthy. 2006. Rheology of different formulations of milk chocolate and the effect on coating thickness. J. Texture Stud. 37, 668-680.
Knoth, A., I. Scherze and G. Muschiolik. 2005. Effect of lipid type on water-in-oil-emulsions stabilized by phosphatidylcholine-depleted lecithin and polyglycerol polyricinoleate. Eur. J. Lipid Sci. Technol. 107, 857-863.
Márquez, A.L., A. Medrano, L.A. Panizzolo and J.R. Wagner. 2010. Effect of calcium salts and surfactant concentration on the stability of water-in-oil (w/o) emulsions prepared with polyglycerol polyricinoleate. J. Colloid Interface Sci. 341, 101-108.
Millqvist-Fureby, A. and P. Smith. 2007. In-situ lecithination of dairy powders in spray-drying for confectionery applications. Food Hydrocolloids 21, 920-927.
Norton, J.E., P.J. Fryer, J. Parkinson and P.W. Cox. 2009. Development and characterisation of tempered cocoa butter emulsions containing up to 60% water. J. Food Eng. 95, 172-178. Prawira, M. and S.A. Barringer. 2008. Effects of processing and ingredients on milk chocolate
quality. Foods Food Ingredients J. Jpn. 213(8), 737-749.
Rousset, P.H. P. Sellappan and P. Daoud. 2002. Effect of emulsifiers on surface properties of sucrose by inverse gas chromatography. J. Chromatogr., A 969, 97-101.
Schantz, B. and H. Rohm. 2005. Influence of lecithin–PGPR blends on the rheological properties of chocolate. LWT-Food Sci. Technol. 38(1), 41-45.