Hydrogen-induced sp2-sp3 rehybridization in epitaxial silicene
Tam metin
Şekil
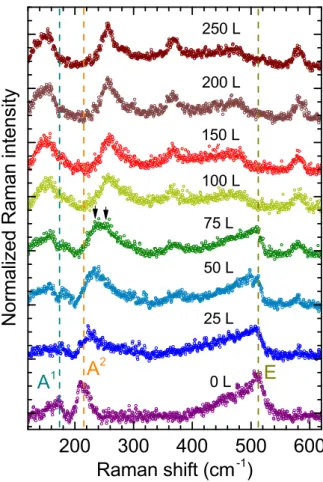
![FIG. 2. Polarization-dependent Raman spectra of hydrogenated silicene (250-L dose) in parallel [-z(xx)z] and crossed [-z(yx)z]](https://thumb-eu.123doks.com/thumbv2/9libnet/5787448.117645/3.911.97.421.101.493/polarization-dependent-raman-spectra-hydrogenated-silicene-parallel-crossed.webp)
Benzer Belgeler
In order to reveal the ontological categories regarding magma, earthquakes and tectonic plates according to learners' mental models, we investigated some students whose
Bu bildirinin amacı, çocukların sağlıklı kişilik geliştirmelerinde onlara verilen ahlaki ve insani değerlerin ve eğitim uygulamalarının onlann tutum ve davranışlarına
This paper proposes a general-purpose mathematical framework to find the expected distance value
Ces mesures (certaines d’entre elles sont infinies) sont caractérisées à l’aide des transformées de Berezin et de boules dans la métrique de Bergman, ce qui nous permet
The risk metric introduced below estimates the size of the expected population that resides within a given radius of the location of a train accident involving a release of
If one can initially identify bushes, trees, and clouds in a video, then such regions can be excluded from the search space or proper care can be taken in such regions, and this
Abstract: We investigate, for the first time and by blinking optical tweezers, the effects of critical Casimir forces (CCFs) on the free dynamics of a pair of spherical
The aim of this study was to report a rare case of a patient who arrived at the emergency department with autosomal dominant polycystic kidney disease presenting with acute
