http://journals.tubitak.gov.tr/biology/ © TÜBİTAK
doi:10.3906/biy-1608-30
k-Shell decomposition reveals structural properties of the gene coexpression network for
neurodevelopment
A. Ercüment ÇİÇEK1,2,*
1Department of Computer Engineering, Faculty of Engineering, Bilkent University, Ankara, Turkey
2Department of Computational Biology, School of Computer Science, Carnegie Mellon University, Pittsburgh, PA, USA
1. Introduction
Neurodevelopmental and mental disorders affect the lives of many people all around the world. For instance, autism spectrum disorder is estimated to affect ~1% of the population of the United States (Christensen, 2016) and schizophrenia affects more than 21 million people worldwide (http://www.who.int/mental_health/ management/schizophrenia/en/). The BrainSpan Atlas of the Developing Human Brain (Miller et al., 2014) has been deemed an important resource to study neurodevelopment and related disorders (Tebbenkamp et al., 2014). The resource contains exon-level expression data from 16 brain regions for 11 brain development stages, from postconceptional weeks 5–7 to 82 years (Kang et al., 2011). This spatiotemporal dataset enables researchers to generate coexpression networks of genes, which are hypothesized to be functionally related. BrainSpan coexpression networks have been frequently used to model neurodevelopment and discover disease genes, to detect affected pathways/subnetworks, and to understand the genetic architecture of complex diseases. Researchers
have used BrainSpan coexpression networks in the study of autism (Willsey et al., 2013; De Rubeis et al., 2014; Liu et al., 2014; Hormozdiari et al., 2015), schizophrenia (Gulsuner et al., 2013; Gulsuner and McClellan, 2014; Maschietto et al., 2015), intellectual disability (Gudenas et al., 2015; Riazuddin et al., 2016), and Parkinson disease (Liscovitch and French, 2014).
Despite its central role in neurodevelopmental disorder research, which uses the connectivity patterns and topological properties of the BrainSpan coexpression network, to the best of our knowledge, there is no detailed work on analyzing the structural properties of the BrainSpan network itself. This is in contrast to other important complex networks, for which numerous studies have been done, such as the Internet (Calvert et al., 1997; Albert et al., 1999; Cohen et al., 2000), and, from the biology domain, yeast protein interaction/coexpression networks (Jeong et al., 2001; Bu et al., 2003; Van Noort et al., 2004). In this work, we analyze the structural properties of the BrainSpan coexpression network using the k-shell decomposition method, which is a widely used method for
Abstract: Neurodevelopment is a dynamic and complex process, which involves interactions of thousands of genes. Understanding the mechanisms of brain development is important for uncovering the genetic architectures of neurodevelopmental disorders such as autism spectrum disorder and intellectual disability. The BrainSpan dataset is an important resource for studying the transcriptional mechanisms governing neurodevelopment. It contains RNA-seq and microarray data for 13 developmental periods in 8–16 brain regions. Various important studies used this dataset, in particular to generate gene coexpression networks. The topology of the BrainSpan gene coexpression network yielded various important gene clusters, which are found to play key roles in diseases. In this work, we analyze the topology of the BrainSpan gene coexpression network using the k-shell decomposition method. k-Shell decomposition is an unsupervised method to decompose a network into layers (shells) using the connectivity information and to detect a nucleus that is central to overall connectivity. Our results show that there are 267 layers in the BrainSpan gene coexpression network. The nucleus contains 2584 genes, which are related to chromatin modification function. We compared and contrasted the structure with the autonomous system level Internet. We found that despite similarities in percolation transition and crust size distribution, there are also differences: the BrainSpan coexpression network has a significantly large nucleus and only a very small number of genes need to access the nucleus first, to be able to connect to other genes in the crust above the nucleus.
Key words: k-Shell decomposition, neurodevelopment, BrainSpan, coexpression network, computational biology, bioinformatics Received: 10.08.2016 Accepted/Published Online: 18.12.2016 Final Version: 20.04.2017
finding structurally important nodes in complex networks (Seidman, 1983; Bader and Hogue, 2003; Dorogovtsev et al., 2003; Wuchty and Almaas, 2005; Alvarez-Hamelin et al., 2008; Shao et al., 2009; Kitsak et al., 2010). k-Shell decomposition peels back the layers of a network, starting from the least connected (shell) until a dense core (nucleus) with no nodes with less than k edges remains. This way, nodes are classified into groups with different functional roles. This method is preferred over degree-based analyses as it is possible to obtain similar degree distributions with very different network topologies with the latter (Carmi et al., 2003; Doyle et al., 2005). k-Shell decomposition can be computed in polynomial time unlike finding cliques of size k, which is another way of detecting densely connected subgraphs. In the context of biology, k-shell decomposition has been used to predict protein function (Altaf-Ul-Amine et al., 2003), to analyze cancer mutation rates for cancer in protein domain cooccurrence networks (Emerson et al., 2015), and to analyze yeast protein interaction networks (Wuchty and Almaas, 2005). Using k-shell decomposition, we found that there are 266 layers with a total of 5423 genes, on top of a 267th layer (nucleus) of 2584 genes. Comparing the BrainSpan coexpression network to the autonomous system level Internet shows that despite similarities in percolation transition and crust size increase distributions, the BrainSpan coexpression network has a significantly large nucleus. We found that the genes in the nucleus play an important role in chromatin modification. The connected layer above the nucleus is found to be involved in “housekeeping” functions. An isolated component that needs to connect to the nucleus to reach the rest of the layers.
Is found to be relevant to growth and survival functions. The rest of the manuscript is organized as follows: in Section 2, we describe the methods used, and in Section 3, we present our results. Finally, in Section 4 we conclude with the discussion of the results.
2. Materials and methods 2.1. Data
BrainSpan contains microarray and exon-level RNA sequencing data for neurodevelopmental and adulthood stages (from postconceptional weeks 5–7 to 82 years), sampled from 57 postmortem brains (26 females and 31 males from many ethnicities) (Kang et al., 2011). Neurodevelopment is divided into 15 stages (Kang et al., 2011; Willsey et al., 2013): embryonic (4–8 postconceptional weeks (PCW)), early fetal (8–10 PCW), early fetal (10–13 PCW), early midfetal (13–16 PCW), early midfetal (16– 19 PCW), late midfetal (19–24 PCW), late fetal (24–38 PCW), neonatal and early infancy (0–6 postnatal months (PM)), late infancy (6–12 PM), early childhood (1–6 postnatal years (PY)), middle and late childhood (6–12 PY), adolescence (12–20 PY), young adulthood (20–40
PY), middle adulthood (40–60 PY), and late adulthood (60 PY and more). A total of 16 cortical and subcortical brain regions are considered. During 4–10 PCW, the dataset contains samples from the occipital cerebral wall, frontal cerebral wall, parietal cerebral wall, temporal cerebral wall, upper rhombic lip, hippocampal anlage, medial ganglionic eminence, lateral ganglionic eminence, diencephalon, dorsal thalamus, ventral forebrain, and caudal ganglionic eminence. From 10 PCW to 82 PY, the dataset contains samples from the hippocampus, mediodorsal nucleus of the thalamus, amygdala, striatum, orbital prefrontal cortex, dorsal prefrontal cortex, ventral prefrontal cortex, medial prefrontal cortex, posterior inferior parietal cortex, primary auditory cortex, superior temporal cortex, inferior temporal cortex, primary motor cortex, primary somatosensory cortex, primary visual cortex, and cerebellar cortex (Kang et al., 2011; Willsey et al., 2013).
In this study, we used the microarray data and removed the genes that are not brain-expressed. For each gene, expression values were obtained and ordered by brain region and the age at which the brain sample was obtained. We included all available brain regions and developmental stages. Note that the latter corresponds to the temporal dimension (corresponding to the age of the donor). 2.2. Coexpression network construction
Gene pairs are considered coexpressed if the absolute Pearson correlation coefficient between their expression patterns is larger than 0.7. This threshold was also used by Willsey et al. (2013) and Liu et al. (2014). The resulting network is binary and bidirectional.
2.3. k-Shell decomposition
k-Shell decomposition is an unsupervised method for discovering structurally different layers of a network. The method starts with k = 1. It then removes all the nodes with a single edge and assigns them to the 1-shell. In the second iteration, k is incremented to 2 and all nodes with a degree of less than or equal to 2 is assigned to the 2-shell. This operation lasts until no node can be assigned to any further shells. That is, no nodes remain with degree k or less. The network is divided into layers and each node is assigned to only one shell. Deeper shells (e.g., larger k) indicate that the node is located towards the center (core) of the network. The union of shells with index of less than or equal to k constitutes the k-crust. For instance, union of the 1-shell and 2-shell constitutes the 2-crust. Similarly, the k-core is the union of shells with index of larger than or equal to k. The deepest shell is called the nucleus (Carmi et al., 2003).
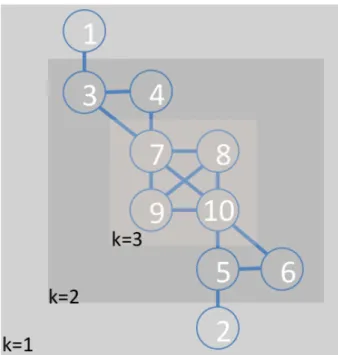
Figure 1 shows an illustration of the layers identified by the method on a toy example. In this example, we start with k = 1, and nodes 1 and 2 are the only nodes that have a single edge. Hence, they are assigned to the 1-shell and then they are removed from the network. We increment
k to 2. Note that as we have removed nodes 1 and 2 in
the previous iteration, edges 1-3 and 2-5 are already removed as well. In the remaining network, nodes 3, 4, 5, and 6 are the nodes that have degree of less than or equal to 2. They are assigned to the 2-shell and then consequently removed from the network. When k = 3, all remaining nodes (7, 8, 9, and 10) have 3 edges. They are assigned to the 3-shell and as this is the deepest shell (no more remaining nodes), it forms the nucleus. The algorithm halts, as there are no more nodes to be processed.
2.4. Gene ontology enrichment analyses
Nodes found in various levels (e.g., the nucleus) are analyzed for enriched gene ontology (GO) terms. We used the Enrichr tool (Chen et al., 2013; Kuleshov et al., 2016) for this analysis. For a given gene list, Enrichr calculates the enriched GO terms for the Biological Function, Molecular Function, and the Cellular Component categories. Enriched terms are found using the Fisher exact test. A modified version of the Fisher exact test that also considers a background distribution based on many random runs also provides an adjusted P-value and a corresponding z-score. Finally, a combined score is provided, which combines the two P-values found. For each enrichment analysis that we perform, we report the top 5 GO terms, ordered with respect to the standard Fisher exact test results.
3. Results
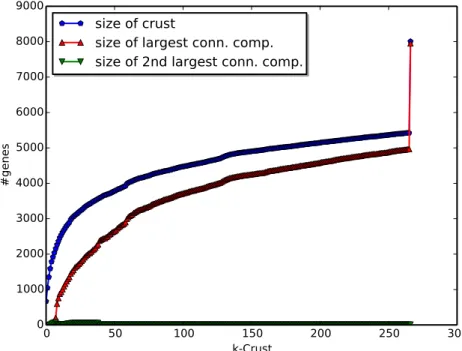
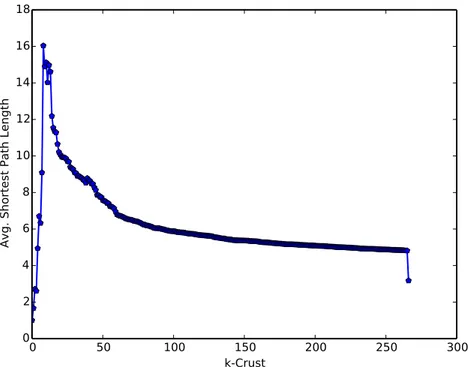
The BrainSpan gene coexpression network contains 8007 nodes (genes) and 1,562,725 edges (coexpressed pairs of genes, self-loops removed, threshold = 0.7). Applying k-shell decomposition to this network yielded 267 shells (layers). The network is visualized in Figure 2, where the shade of each node denotes its shell, darker shading denoting a deeper shell. Following Carmi et al. (2003), we analyzed both crust sizes and the sizes of the largest connected component and the second largest connected component in each crust; results are depicted in Figure 3. The number of nodes increases when k is increased, but the rate slows down as k gets closer to the level of the nucleus. The size of the largest connected component also follows a similar pattern. When the nucleus is added, we see a peak in the size of the deepest crust and the largest connected component in this crust. We observe the percolation transition at k = 8. Percolation transition is the point after which a large connected component is formed and the network is “mostly” connected over long ranges. The transition is similar to that of the autonomous system level Internet (AS) found in the work of Carmi et al. (2003). After k = 8, the largest connected component size doubles and the average distance between nodes peaks as shown in Figure 4. At k = 8 the size of the second largest connected component is also the largest (see Figure 3). Again, similar to the AS, the crust size converges as it gets deeper. Just before adding the nucleus, the 266-crust contains ~67% of the nodes, which is similar compared to 70% reported for the AS. Only 58 genes are disconnected from the remaining 7949 genes. Note that we have only included the genes with at least one coexpressed peer, so these genes form small clusters among themselves. The connectivity in the crust above the nucleus (k = 266) is important for p2p connectivity among many genes without the need for going through the nucleus. Of the 5423 genes in this crust, 4966 form a connected cluster and only 457 genes (~6% of the network) need the nucleus to connect to other genes in the 266-crust. This is in contrast to the AS, in which ~30% of the nodes need to access the cluster for connecting to the other genes outside the nucleus. The BrainSpan coexpression network also has a large nucleus of 2584 genes (~32% of all network), whereas the AS nucleus constitutes ~0.5% of the network. In conclusion, the BrainSpan coexpression network follows the Medusa model introduced by Carmi et al. (2003), which classifies nodes into three categories: (1) the nucleus, (2) the connected crust above the nucleus, and (3) the isolated component (which needs the nucleus to connect to the nodes in (2)). However, the percentages of nodes in categories (1) and (3) are different in the BrainSpan coexpression network compared to the AS network: (1) ~32% vs. ~0.5%, (2) ~67% vs. ~70%, and (3) ~6% vs. ~30%.
Figure 1. An illustration of the k-shell decomposition method. The method peels out the nodes starting from the 1-shell (k = 1) until it cannot find any nodes with a degree of less than k = 3. Shaded regions show each shell.
Figure 2. Visualization of the BrainSpan coexpression network. Genes (nodes) are colored with respect to their shell. Darker colors denote nodes from deeper shells (more connected), whereas nodes with lighter shades of gray are nodes from shallower shells (less connected). Cytoscape is used for visualization (Shannon et al., 2003).
Figure 3. Crust size analyses. For each crust, the figure shows the number of the nodes in that crust (blue), the size of the largest connected component in that crust (red), and the size of the second largest connected component in that crust (green).
The node degree distribution for the network is shown in Figure 5. We checked whether the network was scale-free as the shape resembled a power law. The absolute correlation between the log of the frequencies and log of degrees is 0.89, but fitting a power law yields γ = 1.69,
which is outside of the typical (2,3) bound (optimum x is chosen as 8 by the software). We also used a Monte Carlo test to check the consistency of the fit (Clauset et al., 2009). The method randomly generates sets of the same sizes and computes a Kolmogorov–Smirnov (KS) statistic.
Figure 4. Crust distance analysis. For each crust, the figure shows the average distance (shortest path) between every pair of nodes in the network. The average distance slowly decreases after the percolation transition at k = 8.
Comparing the random distribution of KS statistics with the KS statistic of the actual data, a P-value is obtained. If P < 0.1, the test concludes that the data are inconsistent with the power law. We obtained a P-value of 0.0.
We have investigated the functional meaning of the cluster of genes that form the nucleus. GO enrichment analysis shows that the top enriched biological process term is the chromatin modification, followed by covalent chromatin modification and histone modification (Table 1). Disruption of chromatin modification has been implicated as an important player in autism etiology. Nine out of 107 predicted autism risk genes are chromatin modifiers and autism risk genes are found to tightly interact with chromatin modifier genes in a transcription factor regulation network (De Rubeis et al., 2014). We also see the “regulation of neuron projection development” term at the 6th ranking. Neuron projection development was also recently implicated as a possible risk source for autism spectrum disorder (Liu et al., 2014).
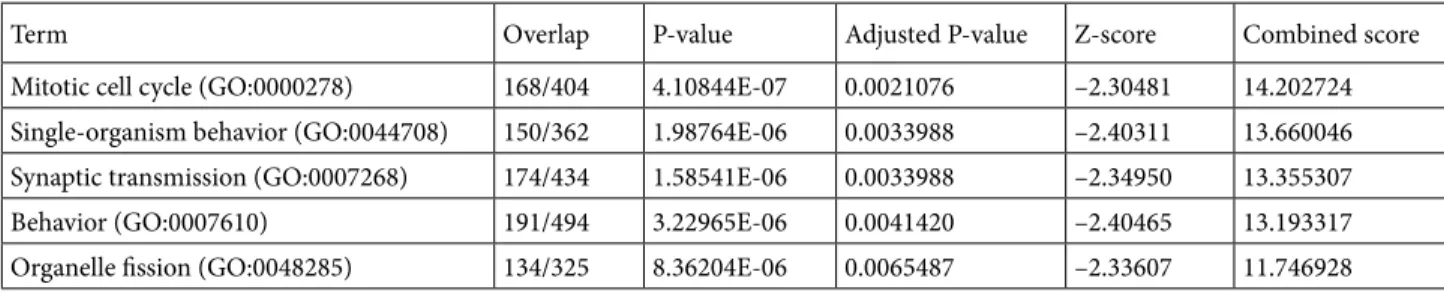
We also analyzed the connected crust above the nucleus in the same manner, as shown in Table 2. In this region, enriched terms are less specialized than the ones obtained for the nucleus. For instance, we obtained the “behavior” GO term as one of the top terms. “Behavior” is right below the root of the GO biological process term, so it includes many genes and it is very general. The only relevant term
obtained in this category is the “synaptic transmission” term.
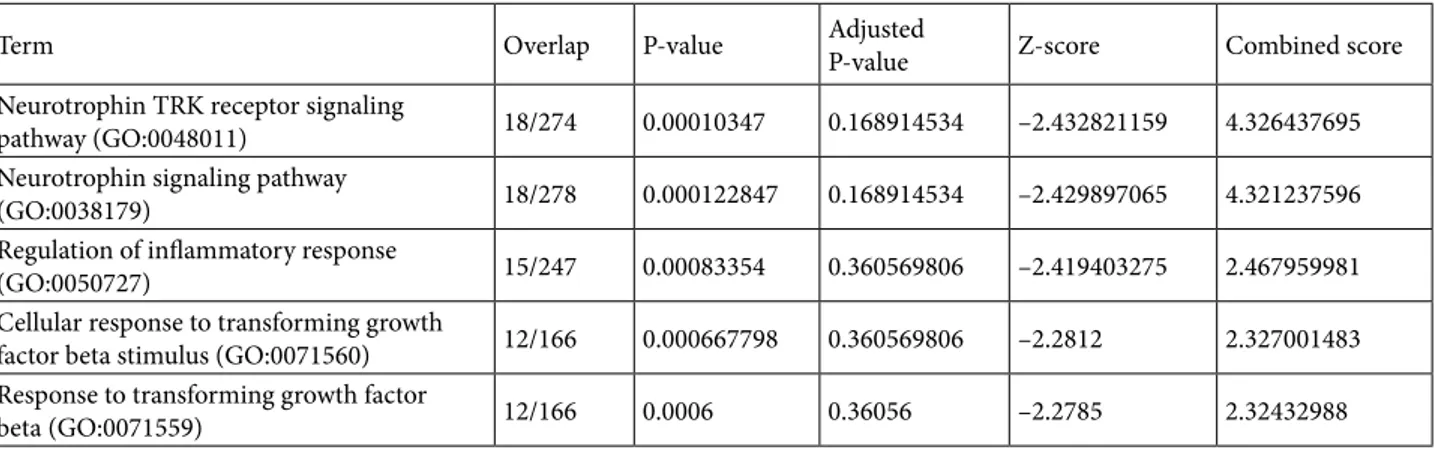
Finally, analyzing the isolated component, which needs to connect to the rest of the crust via the nucleus, yields an interesting result Table 3. The top terms obtained are related to “neurotrophin signaling pathway”, which plays an important role in the growth and survival of the neurons (Reichardt, 2006). We also observe many immune system-related terms like “regulation of inflammatory response” and “neutrophil mitigation”. Separation of these functions suggests that the “survival system” of the cell has a different agenda than the rest of the crust and only interacts with the cluster. Figure 6 shows the Medusa model figure of the BrainSpan coexpression network, where the components are annotated with their primary functions. In conclusion, at the core we see the chromatin modification function, whose disruption has been shown to lead to autism; on the largest component of the crust above the nucleus we see a more general pattern of functions like mitotic cell cycle and behavior; and, finally, at the isolated component we see the defense mechanism of the neurodevelopment. 4. Discussion
The BrainSpan coexpression network is a frequently used resource to understand neurodevelopment. Unlike its counterpart complex networks like the Internet, the
Table 1. GO Biological Process enrichment results for the nucleus of the BrainSpan gene coexpression network. Only the top 5 enriched terms are shown, ordered with respect to the P-value. A modified version of the Fisher exact test is used to calculate adjusted P-values based on a background distribution. The combined score combines two scores. Enrichr software is used to obtain this table.
Term Overlap P-value Adjusted P-value Z-score Combined score Chromatin modification (GO:0016568) 121/475 1.87109E-09 8.83341E-06 –2.40429 27.9787 Covalent chromatin modification (GO:0016569) 75/296 2.71568E-06 0.006410 –2.40007 12.1199 Histone modification (GO:0016570) 73/293 6.06652E-06 0.009546 –2.39598 11.1450 mRNA processing (GO:0006397) 89/397 2.17802E-05 0.025706 –2.38007 8.71353 Gene expression (GO:0010467) 134/672 3.42654E-05 0.032353 –2.32956 7.99283 Table 2. GO Biological Process enrichment results for the crust above the nucleus of the BrainSpan gene coexpression network. The rest of the description is the same as for Table 1.
Term Overlap P-value Adjusted P-value Z-score Combined score Mitotic cell cycle (GO:0000278) 168/404 4.10844E-07 0.0021076 –2.30481 14.202724 Single-organism behavior (GO:0044708) 150/362 1.98764E-06 0.0033988 –2.40311 13.660046 Synaptic transmission (GO:0007268) 174/434 1.58541E-06 0.0033988 –2.34950 13.355307 Behavior (GO:0007610) 191/494 3.22965E-06 0.0041420 –2.40465 13.193317 Organelle fission (GO:0048285) 134/325 8.36204E-06 0.0065487 –2.33607 11.746928
topological structure has not been examined in detail to date. In this paper, we analyzed the network using the k-shell decomposition method. Peeling back the layers of the network showed that it has a similar structure to that of the AS: a nucleus, a connected crust above the nucleus, and an isolated component that needs to connect to the nucleus first to connect to the rest of the network. However, the nucleus is much larger compared to the AS. As also argued by Carmi et al. (2003), this 3-layered structure is important for the
organization and traffic over the networks. That is, the peer-to-peer connected nodes do not need to load the nucleus for interaction. We found that the genes in this layer are responsible for the “housekeeping” tasks of the cell like mitotic cell cycle and behavior. This is inline with the previously stated theory that the nucleus will not be contacted for these more general tasks. On the other hand, the nucleus is enriched for chromatin modifier genes. Chromatin modification function is implicated as one of the most important functions in the etiology of autism and the nucleus being responsible for the epigenetic mechanisms of the neurodevelopment is feasible. Genes in the nucleus have very tight connections to each other each with at least 1089 connections on average. This is another indication that chromatin modification is a complex task and plays an important role in healthy brain development. Finally, the isolated component, which needs the nucleus to connect to the other genes in the crust, is responsible for the survival of the neurons. This is an interesting finding, which indicates that the growth and defense mechanisms of the neurons have a different agenda compared to the rest of the crust, and they only interact with the nucleus.
In conclusion, neurodevelopment is a complex task that involves ~8000 genes interacting in a complex network. k-Shell decomposition has helped uncover the structural components of this complex process in an unsupervised way. We foresee that this initial analysis is going to pave the way towards more detailed analyses. One future direction is going to be focusing on specific time periods and brain regions, which are implied as important for specific diseases. For instance, the prefrontal cortex and primary motor-somatosensory cortex during midfetal development has been marked as an important window for autism, as autism genes are clustered there (Willsey et al., 2013; Liu et al., 2014). Understanding the network topology in that region and comparing/contrasting it with other regions has the potential to reveal the functions affecting autism.
Table 3. GO Biological Process enrichment results for the nucleus of the BrainSpan gene coexpression network. The rest of the description is the same as for Table 1.
Term Overlap P-value Adjusted P-value Z-score Combined score Neurotrophin TRK receptor signaling
pathway (GO:0048011) 18/274 0.00010347 0.168914534 –2.432821159 4.326437695 Neurotrophin signaling pathway
(GO:0038179) 18/278 0.000122847 0.168914534 –2.429897065 4.321237596 Regulation of inflammatory response
(GO:0050727) 15/247 0.00083354 0.360569806 –2.419403275 2.467959981 Cellular response to transforming growth
factor beta stimulus (GO:0071560) 12/166 0.000667798 0.360569806 –2.2812 2.327001483 Response to transforming growth factor
beta (GO:0071559) 12/166 0.0006 0.36056 –2.2785 2.32432988
Figure 6. Medusa model components of the decomposed BrainSpan coexpression network and the enriched GO Biological Process terms. The nucleus: chromatin modification; the connected component on the crust above the nucleus: mitotic cell cycle and behavior; isolated component: neurotrophin signaling pathway.
References
Albert R, Jeong H, Barabási AL (1999). Internet: Diameter of the world-wide web. Nature 401: 130-131.
Altaf-Ul-Amine M, Nishikata K, Korna T, Miyasato T, Shinbo Y, Arifuzzaman M, Wada C, Maeda M, Oshima T, Mori H et al. (2003). Prediction of protein functions based on k-cores of protein-protein interaction networks and amino acid sequences. Genome Informatics 14: 498-499.
Alvarez-Hamelin J, Dall’Asta L, Barrat A, Vespignani A (2008). K-core decomposition of Internet graphs: hierarchies, self-similarity and measurement biases. Netw Heterog Media 3: 371-393.
Bader GD, Hogue CWV (2003). An automated method for finding molecular complexes in large protein interaction networks. BMC Bioinformatics 4: 2.
Bu D, Zhao Y, Cai L, Xue H, Zhu X, Lu H, Zhang J, Sun S, Ling L, Zhang N et al. (2003). Topological structure analysis of the protein–protein interaction network in budding yeast. Nucleic Acids Res 31: 2443-2450.
Calvert KL, Doar MB, Zegura EW (1997). Modeling internet topology. IEEE Commun Mag 35: 160-163.
Carmi S, Havlin S, Kirkpatrick S, Shavitt Y, Shir E (2003). A model of internet topology using k-shell decomposition. P Natl Acad Sci USA 104: 11150-11154.
Chen EY, Tan CM, Kou Y, Duan Q, Wang Z, Meirelles GV, Clark NR, Ma’ayan A (2013). Enrichr: interactive and collaborative HTML5 gene list enrichment analysis tool. BMC Bioinformatics 14: 1.
Christensen DL (2016). Prevalence and Characteristics of Autism Spectrum Disorder among Children Aged 8 Years—Autism and Developmental Disabilities Monitoring Network, 11 Sites, United States, 2012. MMWR. Surveillance Summaries 65. Atlanta, GA, USA: CDC.
Clauset A, Shalizi CR, Newman ME (2009). Power-law distributions in empirical data. SIAM Rev 51: 661-703.
Cohen R, Erez K, Ben-Avraham D, Havlin S (2000). Resilience of the Internet to random breakdowns. Phys Rev Lett 85: 4626. De Rubeis S, He X, Goldberg AP, Poultney CS, Samocha K, Cicek
AE, Kou Y, Liu L, Fromer M, Walker S et al. (2014). Synaptic, transcriptional and chromatin genes disrupted in autism. Nature 515: 209-215.
Dorogovtsev SN, Goltsev AV, Mendes JFF (2003). k-Core organization of complex networks. Phys Rev Lett 96: 040601. Doyle JC, Alderson DL, Lun L, Low S, Roughan M, Shalunov S,
Tanaka R, Willinger W (2005). The “robust yet fragile” nature of the Internet. P Natl Acad Sci USA 102: 14497-14502. Emerson AI, Andrews S, Ahmed I, Azis TK, Malek JA (2015). K-core
decomposition of a protein domain co-occurrence network reveals lower cancer mutation rates for interior cores. J Clin Bioinforma 5: 1.
Gudenas BL, Wang L (2015). Gene coexpression networks in human brain developmental transcriptomes implicate the association of long noncoding RNAs with intellectual disability. Bioinform Biol Insights 9(Suppl. 1): 21-27.
Gulsuner S, McClellan JM (2014). De novo mutations in schizophrenia disrupt genes co-expressed in fetal prefrontal cortex. Neuropsychopharmacology 39: 238-239.
Gulsuner S, Walsh T, Watts AC, Lee MK, Thornton AM, Casadei S, Rippey C, Shahin H, Nimgaonkar VL, Go RC et al. (2013). Spatial and temporal mapping of de novo mutations in schizophrenia to a fetal prefrontal cortical network. Cell 154: 518-529.
Hormozdiari F, Penn O, Borenstein E, Eichler EE (2015). The discovery of integrated gene networks for autism and related disorders. Genome Res 25: 142-154.
Jeong H, Mason SP, Barabási AL, Oltvai ZN (2001). Lethality and centrality in protein networks. Nature 411: 41-42.
Kang HJ, Kawasawa YI, Cheng F, Zhu Y, Xu X, Li M, Sousa AMM, Pletikos M, Meyer KA, Sedmak G et al. (2011). Spatio-temporal transcriptome of the human brain. Nature 478: 483-489. Kitsak M, Gallos LK, Havlin S, Liljeros F, Muchnik L, Stanley HE,
Makse HA (2010). Identification of influential spreaders in complex networks. Nature Phys 6: 888-893.
Kuleshov MV, Jones MR, Rouillard AD, Fernandez NF, Duan Q, Wang Z, Koplev S, Jenkins SL, Jagodnik KM, Lachmann A et al. (2016). Enrichr: a comprehensive gene set enrichment analysis web server 2016 update. Nucleic Acids Res 44: W90-W97. Liscovitch N, French L (2014). Differential co-expression between
α-synuclein and IFN-γ signaling genes across development and in Parkinson’s disease. PLoS One 9: e115029.
Liu L, Lei J, Sanders SJ, Willsey AJ, Kou Y, Cicek AE, Klei L, Lu C, He X, Li M et al. (2014). DAWN: A framework to identify autism genes and subnetworks using gene expression and genetics. Molecular Autism 5: 1.
Maschietto M, Tahira AC, Puga R, Lima L, Mariani D, da Silveira Paulsen B, Belmonte-de-Abreu P, Vieira H, Krepischi AC, Carraro DM et al. (2015). Co-expression network of neural-differentiation genes shows specific pattern in schizophrenia. BMC Med Genomics 8: 23.
Miller JA, Ding SL, Sunkin SM, Smith KA, Ng L, Szafer A, Ebbert A, Riley ZL, Royall JJ, Aiona K et al. (2014). Transcriptional landscape of the prenatal human brain. Nature 508: 199-206. Reichardt LF (2006). Neurotrophin-regulated signalling pathways.
Philos T Roy Soc B 361: 1545-1564.
Riazuddin S, Hussain M, Razzaq A, Iqbal Z, Shahzad M, Polla DL, Song Y, van Beusekom E, Khan AA, Tomas-Roca L et al. (2016). Exome sequencing of Pakistani consanguineous families identifies 30 novel candidate genes for recessive intellectual disability. Mol Psychiatr (in press).
Seidman SB (1983). Network structure and minimum degree. Soc Networks 5: 269-287.
Shannon P, Markiel A, Ozier O, Baliga NS, Wang JT, Ramage D, Amin N, Schwikowski B, Ideker T (2003). Cytoscape: a software environment for integrated models of biomolecular interaction networks. Genome Res 13: 2498-2504
Shao J, Buldyrev S, Braunstein L, Havlin S, Stanley HE (2009). Structure of shells in complex networks. Phys Rev E 80: 036105. Tebbenkamp AT, Willsey AJ, State MW, Šestan N (2014). The
developmental transcriptome of the human brain: implications for neurodevelopmental disorders. Curr Opin Neurol 27: 149.
Van Noort V, Snel B, Huynen MA (2004). The yeast coexpression network has a small‐world, scale‐free architecture and can be explained by a simple model. EMBO Rep 5: 280-284.
Willsey AJ, Sanders SJ, Li M, Dong S, Tebbenkamp AT, Muhle RA, Reilly SK, Lin L, Fertuzinhos S, Miller JA et al. (2013). Coexpression networks implicate human midfetal deep cortical projection neurons in the pathogenesis of autism. Cell 155: 997-1007.
Wuchty S, Almaas E (2005). Peeling the yeast protein network. Proteomics 5: 444-449.