Technical paper
The Effect of Modified Atmosphere and Vacuum Packaging on the Physicochemical,
Microbiological, Sensory and Textural Properties of Crottin de Chavignol Cheese
Ozlem kiziLirmak eSmer1*, Pinar BaLkir2, A. Kemal SeCkin3 and Reyhan Irkin41 Ege University, Food Engineering Department Bornova Izmir, Turkey
2 Ege University, Ege Technical and Business College, 35100, Bornova, Izmir, Turkey 3 Celal Bayar University, Food Engineering Department, Muradiye, Manisa, Turkey 4 Balıkesir University, Susurluk College, Susurluk, Balıkesir, Turkey
Received May 13, 2008; Accepted March 10, 2009
In this work, it was aimed to determine the effect of packaging technique on some quality proper-ties of “Crottin de Chavignol” type goat cheese packaged under vacuum (VP) and modified atmosphere
(MAP) (%20 CO2 + %80 N2) during storage at + 4℃ and also to compare these two packaging techniques
to be able determine the more suitable packaging technique for “Crottin de Chavignol” type goat cheese.
Sampling was carried out for physicochemical, microbiological, sensory and textural analyses at 1st day,
3rd, 6th, 9th,12th and 15th weeks. Control cheeses which were packaged under atmospheric air were
unac-ceptable sensorially at 3rd week due to their visible mould growth. Both modified atmosphere and vacuum
packaging had favourable effects on physicochemical properties, microbiological properties, color, sen-sory attributes of Crottin de Chavignol type goat cheese to longer the shelf life of cheese. According to
the results of our study, at 15th weeks mould growth increased to 2.3 log cfu/g and 3.8 log cfu/g at MAP
and VP cheese samples respectively whereas the mould growth was > 1 log cfu/g at 1.day of storage. And
the taste scores of VP cheese samples were below acceptability limit at 15th weeks because of formation of
oxidized flavour. The packaging type whether MAP or VP didn't significantly affected the pH, dry matter, color and textural properties except hardness, chewiness and gumminess. Hardness, chewiness and gum-miness values of VP cheeses were higher than MAP cheese samples.
Keywords: goat cheese, modified atmosphere packaging, vacuum packaging
*To whom correspondence should be addressed. E-mail: [email protected]
Introduction
The production of goat milk is increasing in the world especially in developed countries. Goat milk can be more easily digested than other milks owing to its smaller fat glob-ules and more homogeneous distribution of fats and proteins (Ozturk and Metin 1996; Haenlein 1995). Goat milk is also important for nutrition physiology, because of lower choles-terol content and higher essential fatty acids content, espe-cially linoleic and linolenic acid (Haenlein 2004; Tamagnini
et al. 2006). But goat milk cannot be evaluated as drinking
milk because of its distinctive “goaty flavour”, which arises from the greater amounts of lipid fractions and free fatty
ac-ids having low perception limits, like 4-methyl-octanoic acid and 4-ethyl-octanoic acid (Gaborit et al. 2001; Jaubert 1997; Skjevdal 1979) and caproic acid (Alichanidis and Polychro-niadou 1995). However, processing of this milk into a goat cheese makes it possible to mask the characteristic goat flavour. Due to its specific technology, goat cheeses have a good reputation for being “exclusive” cheeses because of its special flavour. In addition, many authors stated that special goat milk cheese production was also economically profitable (Gomez et al. 1989; Requena et al. 1992; Martin-Hernandez et al. 1992; Carballo et al. 1994).
One of the most important type goat cheeses is “Crottin de Chavignol”. It is a type of lactic goat cheese especially produced in the province of Berry in the central region of France and it is one of the most important goat cheeses in
France (Hosono and Shirota 1994). Although the shelf-life of unpackaged fresh cheeses changes according to the type of cheese, storage temperature and application of heat process, generally they are not more than 10-12 days at refrigerator temperature because of the effect of O2 on microbial growth
and sensory characteristics. This result is also valid for goat cheese and it was stated by various authors (Dermiki et al., 2008; Balkir and Ozturk 2003; Gonzales-Fandos et al. 2000). Crottin de Chavignol is a type of soft cheese and can be consumed fresh. Since it is a special type of goat cheese and has a high economic value, it is important to determine its properties under different packaging conditions to be able to increase the shelf life of cheese.
In this work, it was aimed to determine some important properties of fresh “Crottin de Chavignol” type goat cheese under vacuum packaging (VP) and modified atmosphere packaging (MAP) and also to compare these two packaging techniques to be able determine the more suitable packag-ing technique for “Crottin de Chavignol” type goat cheese. The potential of MAP and VP for extending the shelf-life of cheese has been demonstrated by various authours. The effect of VP and MAP on the shelf life of Quesillo cheese (Oliszewski et al. 2007), Provolone cheese (Favati et al. 2007), Greek whey cheese (Papaioannou et al. 2007), Par-migiano Reggiano cheese (Romani et al. 2002), Cameros cheese (a fresh goat cheese) (Gonzales-Fandos et al. 2000), Cottage cheese (Mannheim and Soffer 1996) was studied. To our knowledge no data are available in the scientific litera-ture concerning the effect of MAP and VP on the properties of “Crottin de Chavignol” type goat cheese.
Materials and Methods
Cheese-making procedure Cheese production was
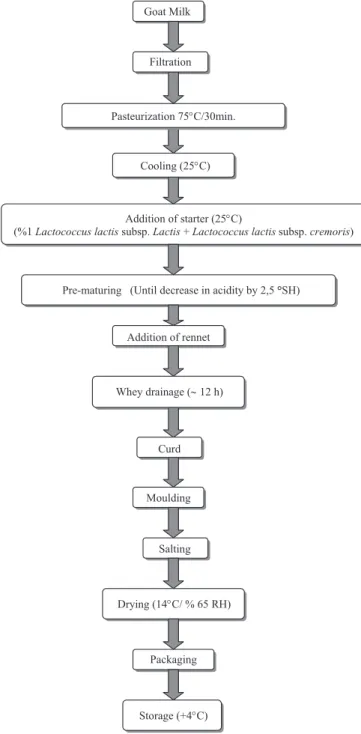
car-ried out at the pilot plant of a Dairy Products Incompany in İzmir, Türkiye. The manufacturing procedure of Crottin de Chavignol type lactic goat cheese is seen from Fig. 1 and as follows. The filtered milk was pasteurized at 65℃ for 30 minutes and cooled rapidly to 25℃. Then the milk was in-oculated with 1% of Lactococcus lactis subsp. lactis +
Lac-tococcus lactis subsp. cremoris. The inoculated milk was left
to prematuration until the titratable acidity reached 8.5°SH and 6.2 pH and then 5 mL/100 l liquid rennet was added. The coagulation was completed when mean titratable acidity of the whey reached 25°SH and curd pH decreased to 4.25-4.30. The coagulum was drained at 25℃ until 28% dry matter content was attained. The processing parameters were as follows: the curd was conditioned at 25℃ for 2 h in moulds with a diameter of 7 cm and a height of 5 cm. The cheese surfaces were dry salted with 2% of halite after demoulding. The salted cheeses were desiccated at 14℃ and 65-70%
rela-tive humidity for 2 days.
Packaging of goat cheese Goat cheese samples were
packaged by VP and MAP. It is used in VP a Polyamide/Low density polyethylene (PA/LDPE) film in 100 μm thickness. In MAP, Polypropylene/Ethylene vinly alcohol/Low density poly ethylene (PP/EVOH/LDPE) film combination was used for sealing top and Polyethylene terephtalate/ Ethylene vinly alcohol/Low density poly ethylene (PET/EVOH/LDPE) film combination was used as a bottom tray.
It was used for MAP application %20 CO2 + %80 N2 as it
is the combination of soft cheese. And as a control, ambient air packaging (AP) is also applied by using the same packag-ing materials in MAP application.
Goat Milk
Filtration
Cooling (25°C)
Addition of starter (25°C)
(%1 Lactococcus lactis subsp. Lactis + Lactococcus lactis subsp. cremoris)
Pre-maturing (Until decrease in acidity by 2,5 °SH)
Addition of rennet Pasteurization 75°C/30min. Curd Moulding Salting Storage (+4°C) Packaging Drying (14°C/ % 65 RH) Whey drainage (∼ 12 h)
Experimental design After production of two batches
of experimental cheeses, chemical compositions of cheeses were determined and the batch was divided in to three groups for VP, MAP and AP. These groups were stored at +4℃ for 15 weeks. Chemical, microbiological, rheological and sen-sory analyses, head space analyses and color measurement were done in 1st day, 3rd, 6th, 9th, 12th and 15th weeks
periodi-cally.
Measurement of oxygen and water vapor transmission rates of packages Oxygen transmission rates of packaging
materials were determined with Mocon Ox-Tran 2/21(Min-neapolis, Minnesota USA) equipment according to the ASTM D – 3985 method at 23℃ and % 0 RH (ASTM D 3985, 1995).
Water vapor transmission rates of packaging materials were determined with Mocon Permatran-W 3/33 (Minneapo-lis, Minnesota USA) equipment according to the ASTM F – 1249 method at 38℃ and % 90 RH (ASTM F 1249, 1990).
Headspace analysis The analyses were carried out
with PBI Dansensor TGC-2 (Barcelona, Spain) head space analyzer by immersing the needle in to the head space of the packages.
Chemical analysis The dry matter content of cheese
was determined gravimetrically (FIL-IDF, 1982). The pH of cheese was evaluated with WTW pH320 model microproces-sor pH meter (Weilheim-Germany) by immersing the elec-trode in to the cheese. Fat content was determined according to Van Gulik method by using Funke-Gerber butyrometer (TSE, 1978). Salt content of cheese samples was also deter-mined by Mohr method (TSE, 1989). Fat and salt contents were expressed in dry matter basis. Total nitrogen was deter-mined by Kjeldahl method (AOAC 1990) and protein con-tent was calculated by multiplying the total nitrogen concon-tent by 6.38. Ash content was determined gravimetrically (AOAC, 1995).
Microbiological analyses 10 g of cheese samples were
homogenized with 90 mL of a sterile %0.1 (w/v) peptone water and % 0.1 (w/v) Tween 80 solution in a Stomacher 400, Lab-Blender (Seward, London, UK) for 2 min. Decimal dilutions were prepared in 0.1% sterile peptone water (Francis and Keith, 2001).
Total aerobic mesophilic bacteria (TAMB); were deter-mined in Plate Count Agar (PCA, Oxoid) with incubation at 37℃ for 48 h. (Anon., 2000).
Yeasts and moulds; were enumerated on Potato Dextrose Agar acidified with 10% lactic acid (PDA, Oxoid) at pH 3.5, 22℃ for 3 and 5 days respectively (TSE, 1996).
Color measurement Color analyses were carried out
using Hunter Lab CFLX-45-2 (Reston, Virginia- USA) by assessing L*, a*, b* values . The instrument was calibrated
with black and white standard plates before analysis. The re-ported data are the mean of four determinations.
Texture profile analyses (TPA) Textural properties of
cheeses were measured with TA-XT plus Texture Analyzer (Vienna count, surrey GU7 1 YL, UK). Cylindrical cheese samples were obtained from the middle of the whole cheese block (2 cm in diameter and 2.5 cm in height). Cheese samples were wrapped with plastic stretch film to prevent dehydration and tempered to 21℃ ± 1. A two bite penetra-tion test was performed using the Texture Analyzer with P/35 probe (35 cm diameter) and operated at a crosshead speed of 1 mm/s and penetration distance of 10 mm in both upward and downward directions with 10 sec. between two cycles. Six textural parameters (hardness, adhesiveness, springiness, chewiness, gumminess and cohesiveness) were obtained from the analysis of these force-distance curves. All mea-surements were done in triplicate according to Awad et al., (2002).
Sensory analyses Sensory evaluation was carried out
with a scoring test on each day of sampling. A panel of seven experienced assessors from Ege University Food Engineer-ing Department evaluated cheese quality on the basis of appearance, texture and taste attributes with a point scale from 1 to 5. Acceptability limit were determined as 3.0 after development of first oxidized off-flavour or formation of first marked yellowish color or first stickiness in mouth. Cheese samples were coded with randomly choosen 3-digit numbers and served at room temperature with water for rinsing be-tween samples.
Statistical analyses Data were processed with the two
way analysis of variance (the factors being the packaging technique and the storage period) to determine the signifi-cance of individual differences on the level of p < 0.05. Sig-nificant means were compared with the Duncan test. All the statistical analyses were conducted using the SPSS (Version 8) commercial statistical package.
Results and Discussion
AP (control) cheese samples were not analyzed after 3rd
week since they were not acceptable sensorially and due to their high mould and yeast count.
Chemical composition of cheese Chemical
composi-tion analyses gave average dry matter 38.80 ± 0.95%, fat in TS 43.72 ± 1.40%, protein 15.56 ± 0.34%, salt in TS 12.6 ± 0.5% and ash 1.026 ± 0.18% for two cheese batches respec-tively. Tamagnini et al. (2005) found the dry matter contents of Crottin cheeses between 40-57% according to the seasons. Balkir and Ozturk (2003), found chemical composition of Crottin de Chavignol chesses as 29.54% dry matter, 72.10% fat in dry matter, 4.13% salt in dry matter, 13.53% protein.
Hosono and Shirota (1994) found the dry matter content of Crottin de Chavignol cheeses as 40.85%.
Permeability characteristics of packaging materials
The films used in MAP and VP applications must have good barier properties against gases and water vapor to be able to maintain the atmosphere surrounding the product and to prevent moisture loss. According to the results of our perme-ability analyses, PA/PE film which was used in VP had an oxygen transmission rate of 30 cc/m2 d bar and water vapor
transmission rate of 3.875 g/m2-day. PP/EVOH/LDPE and
PET/EVOH/LDPE films which were used in MAP had oxy-gen transmission rates of 3.73 and 8.54 cc/m2 d bar and water
vapor transmission rates of 2.09 and 2.45 g/m2-day
respec-tively. Nevertheless the same packaging materials were used both for MAP and VP applications in most of the studies, our permeability results are in agreement with the results of Gonzales-Fandos et al. (2000) for MAP, Dermiki et al. (2008) for VP, Favati et al.(2007) for VP, Papaioannou et al. (2007) for VP, Romani et al. (2002) for MAP.
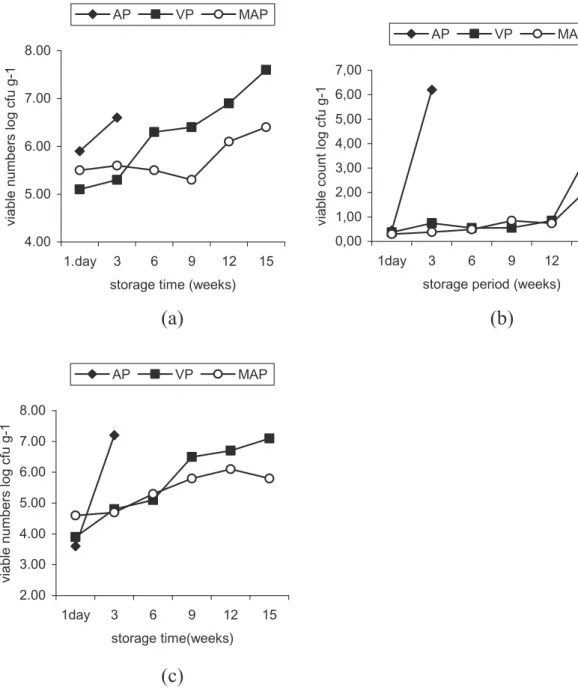
Headspace ratio of packages As it is shown from
Table 1, the CO2 concentration in the head space of MAP
samples which was filled with %20 CO2 + %80 N2 changed
between %19.8-17.2 and the O2 content was between 0.6-2.0
for whole storage period. The slight increase in O2 and the
slight decrease in CO2 may be the result of the gas
permea-bility characteristic of packaging material as it was stated by Ucuncu (2007) and also the result of microbial growth espe-cially yeast growth. For AP samples the O2 content decreased
and the CO2 content increased slightly. This situation may be
the result of the consumption of O2 by aerobic
microorgan-isms.
Chemical analyses Changes in physichochemical
attri-butes (pH and dry matter) were monitored during storage of cheese samples at 4℃ under AP, VP and MAP.
pH values of all groups increased up to 3rd week and then
decreased slightly during the storage period for MAP and VP samples as it is seen from Figure 2(a). This decrease may be related to the growth of lactic acid bacteria used as a starter culture. It is the expected result of cheeses produced with lactic culture stated by Dermiki et al. (2008). The decrease in pH after 9th week was more evident in MAP samples as it
was stated by Papaioannou et al. (2007); Gonzales-Fandos
et al. (2000). It may the result of the mechanism of
decom-position of CO2 in to carbonic acid (Robertson, 2006; Stiles,
1991). But the decrease in pH was not very high because of the low CO2 concentration in MAP combination and the
packaging method had no significant effect on pH (p > 0.05). On the 3rd week, the pH value of AP group increased from 4.2
3.0 3.5 4.0 4.5 5.0 5.5 1day 3 6 9 12 15
Storage period (weeks)
pH AP VP MAP 20 25 30 35 40 45 1day 3 6 9 12 15
Storage period (weeks)
Dry matter (%)
AP VP MAP
(a) (b)
Fig. 2. Changes in (a) pH and (b) dry matter values of AP, VP and MAP cheese samples stored at 4℃.
Headspace
gas amounts1 Storage(week) AP MAP
O2(%) 1.day 20.3±0.1 0.6±0.1 3 18.9±0.5 0.8±0.1 6 NA 0.5±0.1 9 NA 1.1±0.3 12 NA 1.3±0.2 15 NA NA NA NA NA 2.0±0.1 CO2(%) 1.day 0.6±0.1 19.8±0.4 3 0.9±0.1 20.1±0.3 6 19.5±0.2 9 18.7±0.5 12 18.9±0.5 15 17.2±0.6
1: The remaining gas is nitrogen.
to 5.0 and were higher than MAP and VP groups. This may be due to the increase in yeast and mould counts as it is seen from Figure 3 (b) and (c). The increase in pH for Crottin cheese was also stated by Tamagnini et al. (2005) and it was related to the activity of yeasts.
With respect to dry matter content as shown from Figure 2(b), AP group had the lowest values during storage. There was no significant changes in dry matter content with storage period and packaging technique since the water vapor trans-mission rates of packaging materials are very low and very close to each other. Our results are in agreement with Papaio-annou et al. (2007) and Romani et al. (2002) that they found neither VP nor MAP had any significant effect on dry matter content. Gonzales-Fandos et al. also found no significant
differences in dry matter contents of cheeses packaged in air and under vacuum, but they found significant differences in that of MAP cheeses. This difference may be due to the high water vapor transmission rate of packaging material used in MAP.
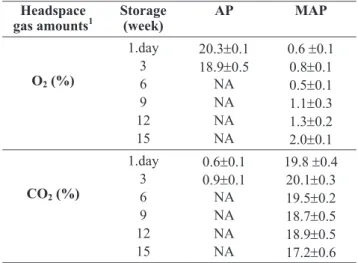
Microbiological analyses The microbiological results
are shown in Figure 3. The storage period (p < 0.01) and the packaging technique (p < 0.05) had significant effect on TAMB count. The highest counts for all microbiologi-cal analyses were detected in AP samples. There was an increase about 1 log cfu g–1 at TAMB and it reached to 6.6
log unit g–1 at 3rd week for AP cheese. Gonzales-Fandos et al. (2000) determined that total viable counts of air packaged
Cameros cheese which was produced from pasteurized goat
4.00 5.00 6.00 7.00 8.00 1.day 3 6 9 12 15
storage time (weeks)
viable numbers log cfu g-1
AP VP MAP 2.00 3.00 4.00 5.00 6.00 7.00 8.00 1day 3 6 9 12 15 storage time(weeks)
viable numbers log cfu g-1
AP VP MAP
(a)
(b)
(c)
0,00 1,00 2,00 3,00 4,00 5,00 6,00 7,00 1day 3 6 9 12 15storage period (weeks)
vi ab le coun t log cf u g-1 AP VP MAP
milk increased during storage and reached to 7.0 log unit g–1
after 14 days. For VP and MAP samples there was a 0.5 log unit and 0.1 log unit increase respectively after 3 weeks for TAMB and it steadily increased for whole storage period and reached to 7.6 log unit g–1 for VP samples and 6.4 log unit g–1
for MAP samples at the end of the 15 weeks.
Moulds ( > 1 log cfu/g) were detected in all samples at 1st
day of storage. The number of moulds increased at 3.week for AP samples but there was no any increase in VP and MAP cheese samples until 15 weeks because of elimination of O2
in vacuum and inhibitory effect of CO2 in MAP as it is stated
by Gonzales-Fandos et al. (2000); Stiles, (1991). The mould growth in MAP may be the result of high O2 content
rela-tively to the previous storages period as it is seen from Table 1. It was about 2% in 15th weeks and this amount is enough
for growth of moulds. At 15th weeks, mould count was 3.83
log cfu g–1 for VP and 2.3 log cfu g–1 for MAP cheese. But
in AP cheese samples, mould count was 6.2 log cfu g–1 at 3rd
week. Yeast count increased steadily through storage period for all samples. There was a 4.6 log unit increase for AP cheese samples at the end of the 3 weeks. It reached to 7.1 log cfu g–1 VP and 5.8 log cfu g–1 MAP samples at the end of
15 weeks. The storage period (p < 0.01) had significant effect on mould and yeast count whereas the packaging technique didn’t.
As a result, it is possible to express that the micro-bial counts of MAP samples were slightly lower than VP samples. This may be due to the protective effect of CO2 for
TAMB, yeast and mould count and this result was also con-firmed previously by various authors for myzithra kalathaki cheese (Dermiki, 2008), cameros goat cheese (Gonzales-Fandos et al. 2000), anthotryros cheese (Papaioannou et al. 2007), shredded mozarella (Eliot et al. 1998), cottage cheese (Mannheim and Soffer, 1996).
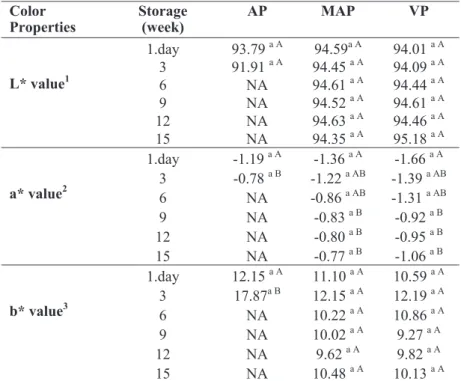
Color measurement The results for color measurement
are presented in Table 2. The packaging type and the stor-age period didn't significantly influenced the color of cheese samples as it was pointed out in other researches by Favati et
al. (2007), Romani et al. (2002). But in AP cheese samples
there was a sharp change in a* value and especially in b* value at 3rd week of storage period which gives the cheese a
distinct yellowness. It was thought to be the result of oxygen as it was stated by Karel (1992). We can say that vacuum and modified atmosphere may stabilize the color during storage as it was expressed by Favati et al. (2007). The L* value and b* value of MAP and VP cheese samples didn’t changed sig-nificantly within storage period, whereas it was observed a consistent decrease in a* values of MAP and VP cheeses for 15 weeks, but after 9th week, this drop was not significant.
Texture profile analyses The changes in texture profile
Color
Properties Storage(week) AP MAP VP
L* value1 1.day 93.79a A 94.59a A 94.01a A 3 91.91a A 94.45a A 94.09a A 6 NA 94.61a A 94.44a A 9 NA 94.52a A 94.61a A 12 NA 94.63a A 94.46a A 15 NA 94.35a A 95.18a A a* value2 1.day -1.19a A -1.36a A -1.66a A 3 -0.78a B -1.22a AB -1.39a AB 6 NA -0.86a AB -1.31a AB 9 NA -0.83a B -0.92a B 12 NA -0.80a B -0.95a B 15 NA -0.77a B -1.06a B b* value3 1.day 12.15a A 11.10a A 10.59a A 3 17.87a B 12.15a A 12.19a A 6 NA 10.22a A 10.86a A 9 NA 10.02a A 9.27a A 12 NA 9.62a A 9.82a A 15 NA 10.48a A 10.13a A
NA: Not analyzed.1SD: ±1.345,2SD: ±0.706,3SD: ±0.943
a: each value is the mean of two batch production with two samples analyzed per batch (n=4). Means with different lowercase letters in the same row are significantly different (p< 0.05); means with different capital letters in the same column are significantly different (p<0.05).
Table 2. Changes in L*, a*, b* valuesa of cheese samples according to the packaging type and storage period.
analysis parameters (hardness, cohesiveness, chewiness, ad-hesiveness, springiness and gumminess) during the storage period of experimental cheeses are shown in Table 3.
The packaging type significantly affected the hardness values of cheese samples (p < 0.05) whereas MAP and AP cheese samples were in the same group statistically, VP cheese samples were harder than the others (p < 0.05). This may be due to the vacuum applied on to the cheese sample
during packaging. Generally the hardness of all samples de-creased during the storage period as it was stated by Romani
et al. (2002). This could be mainly due to proteolysis as it
was stated by Fedrick (1987) and Hort and Grys (2001). Cohesiveness values showed some fluctuations during the storage period but whereas these changes were insignificant for AP and MAP samples (p > 0.05), they were significant for VP sample (p < 0.05). But Romani et al. (2002) found
TPA
Properties Storage(week) AP MAP VP
Hardness1 1.day 0.681a A 0.649a A 1.230b A 3 0.610ab A 0.472a A 0.987b A 6 0.394a A 0.395a A 0.410a B 9 0.502a A 0.484a A 0.490a B 12 0.471a A 0.512a A 0.567a A 15 0.534a A 0.527a A 0.788b A Cohesiveness2 1.day 1.002a A 1.377a A 2.290b A 3 1.024a A 1.025a A 1.016a B 6 1.436a bA 1.105a A 1.810b A 9 1.423a A 1.465a A 1.407a A 12 1.675b A 1.221a A 1.295a B 15 1.413b A 1.172a A 1.987c A Adhesiveness3 1.day 215.73a A 188.07a B 278.21b A 3 209.55ab A 114.76a A 269.41b A 6 136.00a B 137.04a A 135.00b B 9 155.38a B 152.50a A 176.42a AB 12 174.86a A 123.77a A 270.23b A 15 164.41a A 141.11a A 139.75b B Gumminess4 1.day 0.702a A 0.651a A 1.550b B 3 0.562a A 0.588a A 0.904b AB 6 0.494a A 0.393a A 0.743a A 9 0.644a A 0.475a A 0.619a A 12 0.688a A 0.576a A 0.702a A 15 0.654a A 0.557a A 0.650a A Chewiness5 1.day 7.23a A 5.87a A 15.48b A 3 5.92a A 5.18a A 8.98b B 6 4.92a A 3.89a A 7.76b B 9 6.41a A 5.83a A 6.16a B 12 6.84a A 5.74a A 6.98a B 15 6.51a A 5.56a A 7.50b B Springiness6 1.day 9.95a A 9.98a A 9.97a A 3 9.95a A 9.97a A 9.92a A 6 9.95a A 9.91a A 9.95a A 9 9.94a A 9.04a A 9.93a A 12 9.94a A 9.97a A 9.94a A 15 9.96a A 9.97a A 9.98a A
NA: Not analyzed.1SD: ±0.690,2SD: ±0.650,3SD: ±41.844SD: ±0.180,5SD: ±2.016,6SD: ±0.12 a: each value is the mean of two batch production with two samples analyzed per batch (n=4). Means with different lowercase letters in the same row are significantly different (p< 0.05); means with different capital letters in the same column are significantly different (p<0.05).
Table 3. Changes in TPA parametersa of cheese samples according to the packaging type and storage period.
that modified atmosphere packaging of 30% CO2 + 70% N2
decreased cohesiveness values of cheese samples during storage period. Ozer et al.(2003) and Tamime et al.(1999) claimed that cohesiveness values of samples increased dur-ing storage. In contrast to this, Awad et al.(2002) found that cohesiveness of cheese samples decreased during the ripen-ing. This difference may be due to the type of cheese and the production technique and the packaging method.
Adhesiveness values of the samples decreased during the storage. Whereas the effect of packaging type on adhesive-ness values of cheese samples was found significant (p < 0.05) the effect of storage period was insignificant (p > 0.05) for adhesiveness values. And also, the adhesiveness values of AP and MAP samples were statistically in the same group except 3rd week as it is seen from Table 3 and the adhesiveness
val-ues of VP samples were higher than the other two samples. Gumminess values didn’t change significantly during the storage period for AP and MAP samples, whereas they changed at 3rd week and didn’t changed after 3rd week for VP
samples. The AP and MAP samples were in the same group statistically in the whole storage period, whereas the adhe-siveness values of VP samples at 1st day and 3rd week were
statistically higher than the other samples and were at the same group with AP and MAP for other storage periods.
Chewiness values didn’t changed significantly both for
AP and MAP for whole storage period and VP samples de-creased significantly (p < 0.05) for whole storage period. The highest chewiness values were found at 1st day for all
sam-ples. The chewiness values of VP samples were three times higher than MAP and two times higher than AP samples at the beginning of storage. This showed that vacuum packag-ing affected the chewiness value significantly as it affected the hardness value. It is known that there is a direct relation between hardness and chewiness properties and the factors that affect the hardness of cheese also affect the chewiness of cheese.
The springiness values of cheese samples almost re-mained constant for whole storage period and didn’t changed significantly (p > 0.05) for packaging technique.
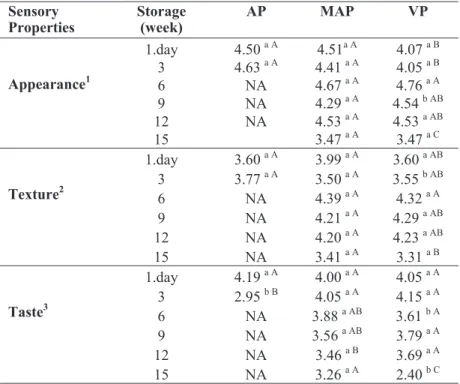
Sensory analyses The results of sensory evaluation
(ap-pearance, texture and taste attributes) of cheese samples are shown in Table 4. Sensory results showed similar pattern for MAP and VP with decreasing acceptability for taste scores in whole storage period and increasing acceptability for texture scores until 12th weeks and fluctuating acceptability at the
same weeks for appearance scores. The taste results were conformable with the results of Papaioannou et al. (2007). AP cheeses were acceptable for appearance and texture at-tributes but they were unacceptable as they had taste score under acceptable level of 3.0 at 3rd week. Evolution of
sen-Sensory
Properties Storage(week) AP MAP VP
Appearance1 1.day 4.50a A 4.51a A 4.07a B 3 4.63a A 4.41a A 4.05a B 6 NA 4.67a A 4.76a A 9 NA 4.29a A 4.54b AB 12 NA 4.53a A 4.53a AB 15 3.47a A 3.47a C Texture2 1.day 3.60a A 3.99a A 3.60a AB 3 3.77a A 3.50a A 3.55b AB 6 NA 4.39a A 4.32a A 9 NA 4.21a A 4.29a AB 12 NA 4.20a A 4.23a AB 15 NA 3.41a A 3.31a B Taste3 1.day 4.19a A 4.00a A 4.05a A 3 2.95b B 4.05a A 4.15a A 6 NA 3.88a AB 3.61b A 9 NA 3.56a AB 3.79a A 12 NA 3.46a B 3.69a A 15 NA 3.26a A 2.40b C
NA: Not analyzed. 1SD: ±0.433,2SD: ±0.506,3SD: ±0.530
a: each value is the mean of two batch production with two samples analyzed per batch (n=4). Means with different lowercase letters in the same row are significantly different (p< 0.05); means with different capital letters in the same column are significantly different (p<0.05).
Table 4. Changes in appereance, texture and taste scoresa of cheese samples according to the packaging type and storage period.
sory characteristics in the present study was very similar in cheeses stored under vacuum and 20% CO2 / 80 N2 as stated
by Gonzales-Fandos (2000) for Cameros goat cheese. Ap-pearance and texture scores for MAP and VP didn't changed significantly for 12 weeks but at 15th weeks they decreased
under 4.0 whereas taste scores decreased throughout the whole storage period. The taste scores of VP cheese samples were below acceptability limit of 3 because of formation of oxidized flavour at 15th week as MAP cheese samples were
still above 3. Therefore VP cheese samples were unaccept-able by panelists at 15th week whereas MAP cheese samples
were still acceptable at 15th week. There was significant
dif-ference for appearance and taste scores with storage period but no for texture scores. It means that the difference deter-mined enstrumentally between MAP and VP cheese samples weren’t fixed for sensorial texture results. And we didn’t obtain any result by panelists that MAP application affected the taste attributes of cheese as it was pointed out by some authors that CO2 had an adverse effect on taste and aroma
(Olarte et al. 2001). It may be due to the low CO2
concentra-tion used.
Conclusions
Based on the results of microbial and sensorial analyses of AP, MAP and VP cheese samples for 15 weeks, it is pos-sible to express that the shelf-life of Crottin de Chavignol cheese can be extended until 15 weeks for MAP cheese sam-ples and until 12 weeks for VP cheese samsam-ples whereas the shelf-life of AP (control) cheese was only limited below 3 weeks. Because of the protective effect of CO2, the microbial
loads were lower and the taste scores of MAP cheese sam-ples were higher than VP cheese samsam-ples and the taste scores of VP cheese samples were below acceptability limit at 15th
weeks because of formation of oxidized flavour. And also as a result, the packaging type whether MAP or VP didn’t significantly affected the pH, dry matter, color and textural properties except hardness, chewiness and gumminess. Hard-ness, chewiness and gumminess values of VP cheeses were higher than MAP cheese samples. This situation may be the result of vacuum applied during packaging process. But the increase in hardness, chewiness and gumminess values didn't influence the taste scores of panelists.
References
Alichanidis, A. and Polychroniadou, A. (1995). Special features of dairy products from ewe and goat milk from the physicochemical and organoleptic point of view, Production and Utilization of Ewe and Goat Milk. Present. Proceedings of the IDF/Greek National Committee of IDF/Sirval Seminer, 19-21 October (1995), 346 pp. Anonymous, (2000). Total (Aerobic Mesophilic) Bacteria count.
Food Microbiology Practises, 323- 328, Ankara.
AOAC, (1990). Official Methods of Analysis, 15th Edition, Vol.2, Association of Official Analytical Chemists, Food Composition; Additives, Natural Contaminants, USA.
AOAC, (1995). Official Methods of Analysis, 16th Edition, Vol.2, Association of Official Analytical Chemists, Food Composition; Additives, Natural Contaminants, USA.
ASTM D 3985, (1995). Standard Test Method for Oxygen Gas Transmission Rate Through Plastic Film and Sheeting Using a Colourimetric Sensor. In “Annual Book of ASTM Standards”, Philadelphia, PA, USA: American Society for Testing Materials, pp 491-496.
ASTM F 1249, (1990). Standard Test Method for Water Vapour Transmission Rate Through Plastic Film and Sheeting Using a Modulated Infrared Sensor. In “Annual Book of ASTM Stan-dards”, Philadelphia, PA, USA: American Society for Testing Materials, pp. 1131-1135.
Awad, R. A., Abdel-Hamid, L. B., El-Shabrawy, S. A. and Sing, R. K. (2002). Texture and microstructure of block type proceed cheese with formulated emulsifiying salt mixture. Zeitschrift für Lebensmittel-Wissenschaft und Technologic (LWT), 35, 54-61. Balkir, P. and Ozturk, G. F. (2003). Effect of curd freezing on the
physicochemical and microbiological characteristics of Crottin de Chavignol type lactic goat cheese. Milchwissenschaft, 58, 615-619.
Carballo, J., Fresno, J. M., Tuero, J. R., Prieto, J. G. and Martin-Sarmiento, R. (1994). Characterization and biochemical changes during the ripening of a Spanish hard goat cheese. Food Chemis-try, 49, 77-82.
Dermiki, M., Ntzimani, A., Badeka, A., Savvaidis, I.N. and Kon-tominas, M.G. (2008). Shelf-life extension and quality attributes of the whey cheese “Myzithra Kalathaki” using modified atmo-sphere packaging. Lebensmittel Wissenschaft und Technologie, 41, 284-294.
Eliot, S.C., Vuillemard, J.C. and Emond, J.P. (1998). Stability of shredded mozzarella cheese under modified atmospheres. Journal of Food Science, 63, 1075-1080.
Favati, F., Galgano, F. and Paca, A.M. (2007). Shelf-life evaluation of portioned Provolone cheese packaged in protective atmo-sphere. Lebensmittel-Wissenschaft und Techologie (LWT), 40, 480-488.
Favier, J.C., Dorsainvil, E., (1987), Compositions des fromages de chèvre, Cahier Nutrition et Diètetique, 22 (2), 117-123.
Francis, P.D. and Keith, I. (2001). “Compendium of Methods for the Microbiological Examination of Foods.” APHA, Washing-ton, DC.
Fedrick, I. (1987). Technology and economics of the accelerated ripening of cheddar cheese. Australian Journal of Dairy Technol-ogy, 42, 33-36.
of the total solids content-Reference Method.
Gaborit, P., Menard, A. and Morgan, F. (2001). Impact of ripening starins on the typical flavour of goat cheeses. International Dairy Journal, 11, 315-325.
Gomez, R., Pelaez, M. and Torre, De E. (1989). Microbiological study of semi-hard goat’s milk cheese (Majorero). International Journal of Food Science and Technology, 24, 147-151.
Gonzales-Fandos, E., Sans, S. and Olarte, C. (2000). Microbiologi-cal, physicochemical and sensory characteristics of Cameros cheese packaged under modified atmospheres. Food Microbiol-ogy, 17, 407-414.
Haenlein, G. F. W. (1995). Nutritional value of dairy products of ewe and goat milk. Production and Utilization of Ewe and Goat Milk, Proceedings of the IDF/Greek National Committee of IDF/ Sirval Seminer, 19-21 October (1995), 346 pp.
Haenlein, G. F. W. (2004). Goat milk in human nutrition. Small Ruminant Research, 51, 155-163.
Hort, J. and Grys, G. L. (2001). Developments in the textural and rheological properties of UK Cheddar cheese during ripening. International Dairy Journal, 11, 475-481.
Hosono, A. and Shirota, A. (1994). Chemical and microbiological studies on Crottin de Chavignol, a soft goat’s milk cheese. Ani-mal Science and Technology, 65, 551-555.
Jaubert, G. (1997). Biochemical characteristics and quality of goat milk. In “Recent Advances in Goat Research”, ed.by P. Morand-Fehr. Zaragoza : CIHEAM-IAMZ, pp. 71-74.
Karel, M. (1992). Kinetics of lipid oxidation. In “Physical Chemis-try of Foods” ed.by R.W. Hartel. New York: Schwarzberg HG, Dekker, pp. 651-668.
Mannheim, C. H. and Soffer, T. (1996). Shelf-life extension of Cot-tage cheese by modified atmosphere packaging. Lebensmittel-Wissenschaft und Techologie, 29, 767-771.
Martin-Hernandez, M. C., Juarez, M. and Ramos, M. (1992). Biochemical characteristics of three types of cheese. Journal of Dairy Science, 75, 1747-1752.
Olarte, C., Gonzales-Fandos, E. and Sanz, S. (2001). A proposed methodology to determine the sensory quality of goat’s cheese Cameros cheese: application of cheeses packaged under modified atmospheres. Food Quality and Preferences, 12, 163-170. Oliszewski, R., Cisint, J. C. and Nunez, de Kairuz M. (2007).
Man-ufacturing characteristics and shelf life of Quesillo, an Argentin-ean traditional cheese. Food Control, 18, 736-741.
Ozer, B. H., Robinson, R. K. and Gradison, S. A. (2003). Textural and microstructural properties of Urfa cheese (a white brined Turkish cheese). International Journal of Dairy Technology, 56, 171-176.
Ozturk, G. F. and Metin, M. (1996). Yarı-sert tipte keçi peyniri imalatı üzerine bir araştırma. Ege Üniversitesi Mühendislik Fakültesi Dergisi, 14, 119-135.
Papaioannou, G., Chouliara, I., Karatapanis, A. E., Kontominas, M. G. and Savvaidis, I. N. (2007). Shelf life of a Greek whey cheese under modified atmosphere packaging, International Dairy Jour-nal, 17, 358-364.
Requena, T., De La Fuente, M. A., De Palencia, P. F., Juarez, M. and Pelaez, C. (1992). Evaluation of a specific starter for the pro-duction of semi-hard goat's milk cheese. Lait, 72, 437-448. Robertson, G. L. (2006). Modified Atmosphere Packaging. In “Food
Packaging: Principles and Practice”, ed. by G.L. Robertson. Boca Raton, FL: Taylor and Francis, pp. 313-329.
Romani, S., Sachetti, G., Pittia, P., Pinnavaia, G. G. and Dalla Rosa, M. (2002). Physical, chemical, textural and sensorial changes of portioned Parmigiano Reggiano cheese packed under differ-ent conditions. Food Science and Technology International, 8, 203-211.
Skjevdal, T. (1979). Flavour of goat’s milk: a review of studies on the sources of its variations. Livestock Production Science, 6, 397-405.
SPSS, (2001). SPSS Statistical package for windows, ver. 11.0, Chicago: SPSS, Inc.
Stiles, M. E. (1991). Scientific principles of controlled/ modified atmosphere packaging. “Modified Atmosphere Packaging of Food”, ed.by B. Ooraikul ( M.E.Stiles. England: Ellis Horwood Ltd. pp 18-25.
Tamagnini, L. M., De Sousa, G. B., Gonzales, R. D. and Budde, C. E. (2006). Microbiological characteristics of Crottin goat cheese made in different seasons. Small Ruminant Research, 66, 181-186.
Tamime, A. Y., Muir, D. D., Shenana, M. E., Kalab, M. and Da-wood, A. H. (1999). Processed cheese analogues incooperating fat substitutes rheology, sensory perception of texure and micro-structure. Zeitschrift für Lebensmittel-Wissenschaft und Techo-logic (LWT), 32, 50-59.
TSE, (1978). TS 3046 Peynirde Yağ Miktarı Tayini Standardı (Van-Gulik Yöntemi), Türk Standartları Enstitüsü, Bakanlıklar, Ankara. TSE, (1989). TS 591 Beyaz Peynir Standardı, Türk Standartları
Enstitüsü, Bakanlıklar, Ankara.
TSE, (1996). TSE 6580 Microbiology. Standards of General Count Techniques of Mould and Yeast. Türk Standartları Enstitüsü, Bakanlıklar, Ankara.
Ucuncu, M. (2007). Gıdaların Modifiye Atmosferde Ambalajlanma-sı. In “Gıda Ambalajlama Teknolojisi”, ed. by M. Ucuncu. İzmir: Meta Basım Matbaacılık Hizmetleri pp. 733-788.