MODEL-DRIVEN ARCHITECTURE VIEW
CONSISTENCY CHECKING
a thesis submitted to
the graduate school of engineering and science
of bilkent university
in partial fulfillment of the requirements for
the degree of
master of science
in
computer engineering
By
G¨
uls¨
um Ece Ek¸si
December 2015
MODEL-DRIVEN ARCHITECTURE VIEW CONSISTENCY CHECKING
By G¨uls¨um Ece Ek¸si December 2015
We certify that we have read this thesis and that in our opinion it is fully adequate, in scope and in quality, as a thesis for the degree of Master of Science.
Bedir Tekinerdo˘gan(Advisor)
Ali Hikmet Do˘gru
Can Alkan
Approved for the Graduate School of Engineering and Science:
Levent Onural
ABSTRACT
MODEL-DRIVEN ARCHITECTURE VIEW
CONSISTENCY CHECKING
G¨uls¨um Ece Ek¸si
M.S. in Computer Engineering Advisor: Bedir Tekinerdo˘gan
December 2015
Software architecture is one of the key artefacts in the software development pro-cess since it provides the gross-level structure of the system and supports the stakeholder concerns. To benefit from the architecture it is important that the code is consistent with the architecture and the corresponding design decisions. Unfortunately, changing requirements and/or the adaptations to the code can lead to undesired inconsistencies among the architecture and the code. This so-called architectural drift problem is the discrepancy between the architecture description and the resulting implementation. Several approaches have been pro-posed to detect the inconsistencies between the software architecture and the code to ensure that the original design goals are maintained. In practice, soft-ware architecture is documented using a coherent set of architecture views, each of view addresses particular stakeholder concerns. Similar to the consistency with the code it is important that an architecture view is consistent within itself and with other related architecture views. Unfortunately, the existing architecture conformance analysis approaches have primarily focused on checking the incon-sistencies between the architecture and code, and did not explicitly consider the consistency among views. In this thesis, we provide a systematic architecture conformance analysis approach that explicitly focuses on conformance analysis among architecture views. The approach is used for detecting the inconsistencies within and across architectural views. To this end, we define the meta-models of architecture viewpoints, present the conformance analysis approach, and provide the tool ArchViewChecker. We illustrate our approach for detecting inconsisten-cies using the Views and Beyond approach. We adopt a fault injection approach to evaluate the effectiveness of the approach. The results show that the approach is effective in detecting inconsistencies within views and across views.
iv
Keywords: Software Architecture, Software Architecture Views, Software Archi-tecture Conformance Analysis, Model-Driven Engineering, Tool Support.
¨
OZET
MODEL G ¨
UD ¨
UML ¨
U YAZILIM M˙IMAR˙IS˙I BAKIS
¸
AC
¸ ILARINDA UYGUNLUK KONTROL ¨
U
G¨uls¨um Ece Ek¸si
Bilgisayar M¨uhendisli˘gi, Y¨uksek Lisans Tez Danı¸smanı: Bedir Tekinerdo˘gan
Aralık 2015
Yazılım mimarisi, bir sistemin ana yapısını g¨osterdi˘gi ve her bir payda¸sın ihtiyacını dikkate aldı˘gı i¸cin yazılım geli¸stirme s¨urecinin temel ta¸slarından biridir. Yazılım geli¸stirme s¨urecinde mimariden yararlanabilmek i¸cin, hazırlanan mi-marinin ve ¨ong¨or¨ulen tasarım kararlarının kodla uyumlu olması gerekmekte-dir. Ancak, projelerde koda dair de˘gi¸sen gereksinimler ve/veya uyarlamalar mi-mari ve kod arasında istenmeyen uyumsuzlukların olu¸smasına yol a¸cabilmektedir. Bu mimari ayrı¸sma problemi, mimarinin tanımı ve ortaya ¸cıkan kod arasındaki tutarsızlı˘gı belirtmektedir. Projelerin ba¸sında tanımlanan tasarım ama¸clarına ula¸smayı sa˘glayan ve kodla yazılım mimarisi arasındaki uyumsuzlukları bulmaya yarayan, literat¨urde bir takım ¸calı¸smalar ¨one s¨ur¨ulm¨u¸st¨ur. Pratikte yazılım mimarisi, payda¸sların ihtiyacını ¨one s¨urd¨u˘g¨u mimari bakı¸s a¸cılarıyla belgelen-mektedir. Mimari bakı¸s a¸cıları ve kod arasındaki uyum nasıl olmalıysa, aynı ¸sekilde her bir bakı¸s a¸cısı kendi i¸cinde ve di˘ger bakı¸s a¸cılarıyla uyumlu olmalıdır. Ancak, varolan mimari uygunlu˘gu y¨ontemleri ¨oncelik olarak kod ile mimari arasındaki uyuma odaklanmı¸s ve bakı¸s a¸cılarının kendi aralarındaki uyumsuzluk-ları dikkate almamı¸stır. Bu tezde, mimari bakı¸s a¸cıuyumsuzluk-larının kendi arauyumsuzluk-larındaki uyumsuzlu˘gu ele alan sistematik bir y¨ontem sunmaktayız. Bu y¨ontem ile mimari bakı¸s a¸cılarının kendi i¸cinde ve di˘ger bakı¸s a¸cılarıyla olan uyumsuzlukları sis-tematik bir ¸sekilde tespit edilebilmektedir. Bu ama¸c do˘grultusunda, meta mod-elleri tanımlanan mimari bakı¸s a¸cılarını uygulamaya sokan bir ara¸c geli¸stirdik. Bakı¸s a¸cıları arasındaki uyumsuzlukları bulan y¨ontemimizi G¨or¨un¨umler ve ¨Otesi yakla¸sımı ile ¨orneklendirdik. Sunulan y¨ontemi de˘gerlendirmek i¸cin hata enjekte metodunu kullandık. De˘gerlendirmemizin sonu¸cları, bakı¸s a¸cılarının kendi i¸cinde ve di˘ger bakı¸s a¸cılarıyla olan uyumsuzluk bulma durumunu, sunulan y¨ontem ile etkili bir ¸sekilde tespit edilebildi˘gini g¨ostermektedir.
vi
Anahtar s¨ozc¨ukler : Yazılım Mimarisi, Yazılım Mimarisi Bakı¸s A¸cıları, Yazılım Mimarisi Bakı¸s A¸cılarında Uygunluk Analizi, Model G¨ud¨uml¨u M¨uhendislik, Ara¸c Deste˘gi.
Acknowledgement
I would like to express my gratitude to my supervisor professor Bedir Tekin-erdo˘gan for his support and understanding during my research and thesis. Even though he is abroad, he encouraged and motivated me during my whole work.
I am thankful to Prof. Dr. Ali Hikmet Do˘gru and Asst. Prof. Dr. Can Alkan for accepting to be in the thesis jury and also giving their precious time to read and review this thesis.
I would like to thank my family; my husband ¨Ozkan, my parents Melike and Bilal, my sister Eda and my grandparents Sahure and Niyazi for their big support and interest. Privately, I want to thank my grandmother who has supported my academic life, my mom who always believed in me since I entered Bilkent University and my husband ¨Ozkan who has always supported and helped me during my research and thesis. I dedicate this thesis to them.
Contents
1 Introduction 1
1.1 Problem Statement . . . 2
1.2 Approach . . . 2
1.3 Contribution . . . 3
1.4 Outline of the Thesis . . . 4
2 Background 5 2.1 Architecture Viewpoints . . . 5
2.1.1 Module Styles . . . 6
2.1.2 Component and Connector Styles . . . 6
2.1.3 Allocation Styles . . . 7
2.2 Model Driven Development . . . 7
2.3 Consistency Checking of Architectural Views . . . 8
CONTENTS ix 3.1 Systematic Reviews . . . 10 3.2 Research Method . . . 11 3.2.1 Review Protocol . . . 11 3.2.2 Research Questions . . . 13 3.2.3 Search Strategy . . . 13
3.2.4 Study Selection Criteria . . . 16
3.2.5 Study Quality Assessment . . . 16
3.2.6 Data Extraction . . . 18
3.2.7 Data Synthesis . . . 18
3.3 Results . . . 19
3.3.1 Overview of the Reviewed Studies . . . 19
3.3.2 Research Methods . . . 28 3.3.3 Methodological Quality . . . 28 3.3.4 Systems Investigated . . . 31 3.3.5 Threats to Validity . . . 36 4 Case Study 38 4.1 Module Styles . . . 39 4.1.1 Decomposition View . . . 39 4.1.2 Uses View . . . 40
CONTENTS x
4.1.3 Generalization View . . . 41
4.1.4 Layered View . . . 42
4.1.5 Aspects View . . . 43
4.1.6 Data-Model View . . . 44
4.2 Component and Connector Styles . . . 45
4.2.1 Pipe and Filter View . . . 45
4.2.2 Client-Server View . . . 46
4.2.3 Peer to Peer View . . . 47
4.2.4 Publish-Subscribe View . . . 48 4.2.5 Shared-Data View . . . 49 4.3 Allocation Styles . . . 50 4.3.1 Deployment View . . . 50 4.3.2 Install View . . . 51 4.3.3 Work-Assignment View . . . 52
5 Architecture View Conformance Analysis Approach 54 5.1 Creating Architecture Views . . . 57
5.2 Automated Consistency Checking Within Views . . . 57
5.2.1 Module Styles . . . 57
CONTENTS xi
5.2.3 Allocation Styles . . . 110
5.3 Automated Consistency Checking Among Views . . . 122
5.3.1 Decomposition and Uses Views . . . 122
5.3.2 Decomposition and Generalization Views . . . 124
5.3.3 Decomposition and Layered Views . . . 125
5.3.4 Decomposition and Aspects Views . . . 128
5.3.5 Decomposition and Data-Model Views . . . 129
5.3.6 Decomposition and Publish-Subscribe Views . . . 130
5.3.7 Decomposition and Work-Assignment Views . . . 132
5.3.8 Uses and Layered Views . . . 134
5.4 Tool . . . 136
5.4.1 System Requirements . . . 136
5.4.2 Tool Overview . . . 137
5.4.3 Tool Usage . . . 138
6 Evaluation 144 6.1 Evaluation of Consistency Checking Within Views . . . 145
6.1.1 Module Styles . . . 145
6.1.2 Component and Connector Styles . . . 158
CONTENTS xii
6.2 Evaluation of Consistency Checking Among Views . . . 169
6.2.1 Decomposition and Uses Views . . . 169
6.2.2 Decomposition and Generalization Views . . . 170
6.2.3 Decomposition and Layered Views . . . 172
6.2.4 Decomposition and Aspects Views . . . 174
6.2.5 Decomposition and Data-Model Views . . . 176
6.2.6 Decomposition and Publish-Subscribe Views . . . 177
6.2.7 Decomposition and Work-Assignment Views . . . 179
6.2.8 Uses and Layered Views . . . 181
7 Related Work 183
8 Conclusion 185
A Search Strings 190
B List of Primary Studies 192
C Study Quality Assessment 195
D Data Extraction Form 197
List of Figures
2.1 Activity Diagram Showing the Consistency Checking Process . . . 9
3.1 Activity Diagram for Reviewing Protocol of SLR . . . 12
3.2 Distribution of the Studies by Year . . . 25
3.3 Publication Type of the Studies . . . 25
3.4 Quality of Reporting of the Primary Studies . . . 29
3.5 Rigor Quality of the Primary Studies . . . 29
3.6 Credibility Quality of the Primary Studies . . . 30
3.7 Relevance Quality of the Primary Studies . . . 30
3.8 Relevance Quality of the Primary Studies . . . 31
3.9 Input Model/Type of the Studies . . . 32
3.10 Model Checking Type of the Studies . . . 33
3.11 Generated Model Type of the Studies . . . 33
LIST OF FIGURES xiv
3.13 Evidence Type of the Studies . . . 35
3.14 Assessment Approach of the Studies . . . 36
4.1 Decomposition View of E-school System . . . 40
4.2 Uses View of E-school System . . . 41
4.3 Generalization View of E-school System . . . 42
4.4 Layered View of E-school System . . . 43
4.5 Aspects View of E-school System . . . 44
4.6 Data-Model View of E-school System . . . 45
4.7 Pipe and Filter View of E-school System . . . 46
4.8 Client-Server View of E-school System . . . 47
4.9 Peer to Peer View of E-school System . . . 48
4.10 Publish-Subscribe View of E-school System . . . 49
4.11 Shared-Data View of E-school System . . . 50
4.12 Deployment View of E-school System . . . 51
4.13 Install View of E-school System . . . 52
4.14 Work-Assignment View of E-school System . . . 53
5.1 Activity Diagram Showing Overview of the Consistency Checking Process . . . 55
LIST OF FIGURES xv
5.3 Textual Decomposition View Example . . . 59
5.4 Abstract Syntax of Uses View . . . 63
5.5 Textual Uses View Example . . . 64
5.6 Abstract Syntax of Generalization View . . . 67
5.7 Textual Generalization View Example . . . 67
5.8 Abstract Syntax of Layered View . . . 71
5.9 Textual Layered View Example . . . 72
5.10 Abstract Syntax of Aspects View . . . 77
5.11 Textual Aspects View Example . . . 77
5.12 Abstract Syntax of Data-Model View . . . 80
5.13 Textual Data-Model View Example . . . 80
5.14 Abstract Syntax of Pipe and Filter View . . . 85
5.15 Textual Pipe and Filter View Example . . . 86
5.16 Abstract Syntax of Client-Server View . . . 91
5.17 Textual Client-Server View Example . . . 91
5.18 Abstract Syntax of Peer to Peer View . . . 95
5.19 Textual Peer to Peer View Example . . . 95
5.20 Abstract Syntax of SOA View . . . 98
LIST OF FIGURES xvi
5.22 Abstract Syntax of Publish-Subscribe View . . . 102
5.23 Textual Publish-Subscribe View Example . . . 103
5.24 Abstract Syntax of Shared-Data View . . . 106
5.25 Textual Shared-Data View Example . . . 107
5.26 Abstract Syntax of Deployment View . . . 111
5.27 Textual Deployment View Example . . . 111
5.28 Abstract Syntax of Install View . . . 115
5.29 Textual Install View Example . . . 115
5.30 Abstract Syntax of Work-Assignment View . . . 119
5.31 Textual Work-Assignment View Example . . . 119
5.32 Overview of ArchViewChecker . . . 138
5.33 General View of ArchViewChecker . . . 139
5.34 Usage of Add Button . . . 139
5.35 Usage of Select All Button . . . 140
5.36 Usage of Delete Button . . . 141
5.37 Usage of Check for Consistency Errors Button . . . 141
5.38 Usage of Clear All Button . . . 142
5.39 Showing the Views in the Tool . . . 143
LIST OF FIGURES xvii
6.2 Wrong Decomposition Model 2 . . . 147
6.3 Showing Consistency Errors of Figure 6.1. . . 148
6.4 Showing Consistency Errors of Figure 6.2. . . 148
6.5 Wrong Uses Model 1 . . . 149
6.6 Wrong Uses Model 2 . . . 150
6.7 Showing Consistency Error of Figure 6.5. . . 151
6.8 Showing Consistency Error of Figure 6.6. . . 151
6.9 Wrong Generalization Model . . . 152
6.10 Wrong Layered Model 1 . . . 153
6.11 Wrong Layered Model 2 . . . 154
6.12 Wrong Layered Model 3 . . . 155
6.13 Wrong Aspects Model . . . 156
6.14 Wrong Data-Model Model . . . 157
6.15 Wrong Pipe and Filter Model 1 . . . 158
6.16 Wrong Pipe and Filter Model 2 . . . 159
6.17 Wrong Client-Server Model . . . 160
6.18 Wrong Peer to Peer Model . . . 161
6.19 Wrong SOA Model 1 . . . 162
LIST OF FIGURES xviii
6.21 Wrong Publish-Subscribe Model . . . 164
6.22 Wrong Shared-Data Model . . . 165
6.23 Wrong Deployment Model . . . 166
6.24 Wrong Install Model . . . 167
6.25 Wrong Work-Assignment Model . . . 168
6.26 Wrong Decomposition Model . . . 169
6.27 Wrong Uses Model . . . 170
6.28 Wrong Decomposition Model . . . 171
6.29 Wrong Generalization Model . . . 171
6.30 Wrong Decomposition Model . . . 173
6.31 Wrong Layered Model . . . 174
6.32 Wrong Decomposition Model . . . 175
6.33 Wrong Aspects Model . . . 175
6.34 Wrong Decomposition Model . . . 176
6.35 Wrong Data-Model Model . . . 177
6.36 Wrong Decomposition Model . . . 178
6.37 Wrong Publish-Subscribe Model . . . 178
6.38 Wrong Decomposition Model . . . 179
LIST OF FIGURES xix
6.40 Wrong Uses Model . . . 181 6.41 Wrong Layered Model . . . 182
List of Tables
3.1 Search Results According to Search Strings and Study Selection . 15
3.2 Quality Assessment Checklist . . . 17
3.3 Data Extraction . . . 18
3.4 Publication Channel Distribution of the Primary Studies . . . 26
3.5 Research Methods of the Primary Studies . . . 28
Chapter 1
Introduction
Software architecture is one of the key artefacts in the software development process since it provides the gross-level structure of the system and supports the stakeholder concerns. Software architecture is important for several reasons including presenting different perspectives of different stakeholders, presenting design decisions and a key element for reuse [1, 2].
To benefit from the architecture it is important that the code is consistent with the architecture and the corresponding design decisions. Unfortunately, changing requirements and/or the adaptations to the code can lead to undesired incon-sistencies among the architecture and the code. This so-called architectural drift problem is the discrepancy between the architecture description and the resulting implementation. Several approaches have been proposed to detect the inconsis-tencies between the software architecture and the code to ensure that the original design goals are maintained. However, according to our research in the literature detecting inconsistencies between architectural views and the view itself is weak. Also, view consistency checking process is often done manually. The problems that we encountered in our research led us to create a tool, ArchViewChecker , that detects the inconsistencies within and across architectural views.
1.1
Problem Statement
In practice, software architecture is documented using a coherent set of architec-ture views, each of view addresses particular stakeholder concerns [2, 3]. Similar to the consistency with the code it is important that an architecture view is con-sistent within itself and with other related architecture views. Unfortunately, the existing architecture conformance analysis approaches have primarily focused on checking the inconsistencies among the architecture and code, and did not explic-itly consider the consistency among views. In order to define the different needs of stakeholders in the projects, different types of architecture views are used. Therefore, we need different types of views for a project and keep these views consistent in themselves is very important. Very often, the view consistency is checked manually. For small systems this could be effective to a large extent. However, for larger systems which require multiple views that tend to evolve reg-ularly, manual checking is not feasible anymore. At this point, there is a need for automated tools to detect these inconsistencies without human interference. Also, we encountered that many tools have been created for the diagrams (use case, sequence, state, activity and class diagrams) that are used mostly in the analysis part of a system. Obviously, the architectural design phase is weak for the tool support and automated consistency checking within and across views.
1.2
Approach
We provide a systematic architecture conformance analysis approach that explic-itly focuses on conformance analysis among architecture views. The approach is used for detecting the inconsistencies within and across architectural views. To this end, we used the pre-defined meta-models of architecture viewpoints and provide the tool ArchViewChecker. We give the architectural views with a spe-cial format to the tool and check the format of the views. If the format is proper for the tool, inconsistencies within and across views are taken into consideration. Then, if the tool detects inconsistencies within or across views, it shows them to
the user.
In order to illustrate our approach for detecting inconsistencies, we used the views included in Views and Beyond approach. We evaluate the tool with a case study using these views. We adopt a fault injection approach to evaluate the approach by showing how many inconsistencies are studied and how many of them are found by the tool. The results show that the approach is effective in detecting inconsistencies within and across views.
1.3
Contribution
The contribution of this thesis is as follows:
1) Systematic approach for detecting inconsistencies within and across views For defining a view, we used a generic format and a software engineer can create views with this format. Thanks to model-driven engineering principles, these models are executable and we check the inconsistencies within and across views.
With our methodology, we divide the inconsistencies into two main parts:
• Within View Checking • Across View Checking
Within view checking includes the methodology that detecting the inconsis-tencies within the view itself. With across view checking, a software engineer can see the inconsistencies among architectural views.
2) Tool support for assisting software architect in the conformance analysis process
ArchViewChecker is a tool that automatically detects the inconsistencies within and across views. It takes the views from the user and process them. At the end of the process, it shows the inconsistencies and warnings related to these views. We use Java programming language while creating this tool. Tool requirements, overview and usage are included in Chapter 5 in detail.
3) Evaluation of the approach and the tool for the Views and Beyond Approach We use the views of V&B approach in the evaluation part. Firstly, we define a case study and create the views according to it, and we break some rules that will cause some problems within and across views. At the end of this evaluation, we adopt a fault injection approach to evaluate our systematic approach by showing how many inconsistencies are studied and how many of them are found by the tool.
1.4
Outline of the Thesis
This thesis is organized as follows: Chapter 2 gives the background information for architectural views, viewpoint approaches, model-driven development and consis-tency checking of architectural views. Chapter 3 presents the Systematic Litera-ture Review of architecLitera-ture consistency checking. It covers the evaluation of the literature works that we examined. In Chapter 4, a case study is described that is used for describing the V&B Approach, then Chapter 5 presents our approach to automated architecture view consistency checking. Primarily, consistency check-ing system and the algorithms are explained. Then, the tool structure and usage are presented. In Chapter 6, the evaluation part for each view in V&B framework is provided. Chapter 7 gives the related work. Finally, Chapter 8 presents the conclusions, discussions and future work.
Chapter 2
Background
2.1
Architecture Viewpoints
Software architecture plays an important role in the software development process since it provides the gross-level structure of the system and supports the stake-holder concerns. Therefore, when an architect defines the system needs, s/he needs some artefacts in order to define the different perspectives of the system. These artefacts are called views which are a representation of a whole system from the perspective of a related set of concerns [3]. Another important concept is called viewpoint which is a specification of the conventions for constructing and using a view [3]. An engineer can document a system architecture with the archi-tectural views. There are some approaches for documenting these views such as Kruchten's 4+1 Viewpoint [4], UML 4+1 Viewpoint [5], Siemens Viewpoint and Views and Beyond approach. The V&B approach, apart from other approaches, has a deeper information about different views in a system. It documents the architecture in three ways:
• How it is structured as a set of implementation units
• How it is structured as a set of elements that have runtime behavior and interactions
• How it relates to non-software structures in its environment [1]
The creators of V&B approach call these categories with special names:
• Module Styles
• Component and Connector (C&C) Styles • Allocation Styles [1]
2.1.1
Module Styles
Module Styles are used for showing the implementation structure of a system. Module views show communication between stakeholders, how implementation units have relations with each other, how these units affect each other and how a change in those units affects the system or other units. In these views, the keyword “module” is used for the implementation units. If a software engineer is new in a project, these module views can help him/her to understand the system structure, working process and the code mechanism. Module styles include Decomposition, Uses, Generalization, Layered, Aspects and Data-Model Views. We will go over each view in Chapter 5.
2.1.2
Component and Connector Styles
C&C styles are used for showing the runtime behavior of the system. The views in C&C styles provide an understanding of the relations between system elements such as objects, clients, servers and data stores. These elements are called “com-ponents” and the interactions among these components are called “connectors”. C&C styles include Data-Flow, Call-Return, Event-Based and Repository styles. These styles include specific views in themselves. We will go over each view in Chapter 5.
2.1.3
Allocation Styles
Allocation styles are used for showing the relations between the software and non-software elements of the system. Allocation styles include Deployment, Install and Work-Assignment Views. These styles provide a mapping between software architecture and hardware with deployment view; a mapping between software architecture and file structure with install view and a mapping between software architecture and the teams in the project with work-assignment view. We will go over each view in Chapter 5.
2.2
Model Driven Development
Model-driven engineering (MDE) is a software development methodology that focuses on creating models which are more close to some particular domain con-cepts rather than computing [6]. With this approach, models are regarded as executable parts of a system. As the code structure, models can be complied and executed. With the help of this executability, an automated technique can be applied in order to process the views.
Today, we have systems including millions lines of code and as time passes the complexity of the systems are increasing. In their work, Atkinson et al [7], they mention the same issue that model-driven development provides us for dealing with these very complex systems by considering the system persistence, interop-erability, distribution, etc.
The meta-model concept is the primary element when dealing with model-driven development. Basically, meta-model is a model of a modeling language. Namely, with a model, we can show how can we define a model. A meta-model can be defined with Abstract Syntax and Concrete Syntax [8]. Abstract syntax is for defining the concepts and specifications of a language. Concrete syntax is a further step of Abstract syntax that includes the textual or visual rep-resentation of the concepts defined in Abstract syntax. Domain-specific language
(DSL) term is the another key fact in model-driven engineering. For a particular domain and its problems, we can create domain-specific languages that meet the requirements for that domain. DSLs can apply in many areas such as telecommu-nications, investment banking, public transport, space exploration, etc [9]. With meta-modeling, we can do model transformations [8]. In model transformation with model-driven engineering, we have source and target meta-models. By using source meta-model, we can have our source model and create our target model conforms to its target meta-model. There are two types of model transforma-tions which are model-to-model and model-to-text transformatransforma-tions. When doing model transformations, we can use special languages such as ATL [10] (for model to model transformation), QVT [11] (for model-to-model transformation) and Acceleo [12] (for model-to-text transformation).
2.3
Consistency Checking of Architectural Views
Conformance analysis between architectural views is discussed widely for the last decade. In most of the studies, firstly researchers define consistency rules and apply them to UML (Unified Modeling Language) diagrams. Most of the studies cover the diagrams (use case, sequence, state, activity and class diagrams) that are used in the analysis part of a system. However, the architectural design phase is weak for automated consistency checking within and across views.
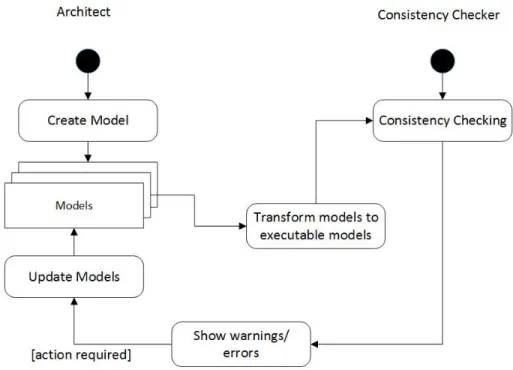
Figure 2.1 provides an overview of the consistency checking process. In the ap-proaches in the literature, thanks to model-driven engineering, executable mod-els can be transformed into more processable languages/types and consistency checking can be applied easily. Then, a report and/or a warning is shown to the engineer/architect. At the end of the process, the architect can have a chance to change and fix the problem. The main goal is creating executable models and handling them within the MDE approach.
Chapter 3
Systematic Literature Review
In the literature, checking the inconsistencies between architectural views are studied with MDE approach and other techniques. The objective of this system-atic review is to specify and analyze the approaches related to detecting and fixing the inconsistencies between architectural views. This SLR (Systematic Literature Review) is carried out with the multiphase study selection process among jour-nals and conferences related to software engineering. We reviewed 1088 papers according to our search criteria and 26 of them were selected as primary studies that satisfy our research questions. We analyze these studies according to our evaluation criteria by showing their positive sides and inadequacies of them. This SLR can be regarded as a lead study for researchers in order to have information about consistency checking between architectural views.
3.1
Systematic Reviews
“A systematic literature review is a means of identifying, evaluating and inter-preting all available research relevant to a particular research question, or topic area, or phenomenon of interest [13].” The research studies we selected before SLR is called primary studies and the work doing with these studies is called SLR
as a secondary study.
In order to start a systematic review, firstly research methodology must be determined. According to our research methodology, the SLR is conducted in order to summarise the existing works related to our research area and informing other researchers/practitioners in terms of shortcomings and inadequacies of the current work for their further research. In our study, we analyze and interpret the primary studies according to our evaluation criteria by showing their positive sides and inadequacies of them.
3.2
Research Method
This SLR is conducted with the research questions and the studies relevant to these questions. In the light of [13, 14], we define our search methodology and completed our SLR.
3.2.1
Review Protocol
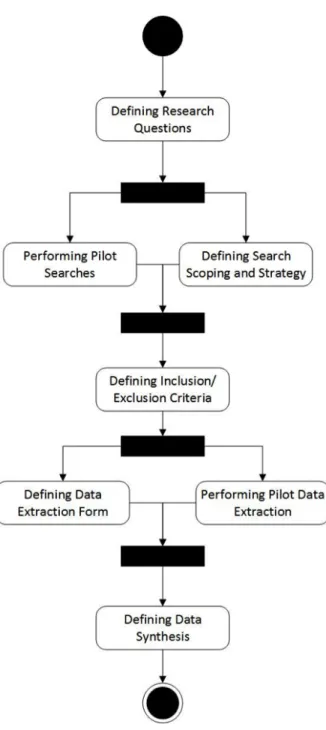
Defining a review protocol is the first step of our systematic literature review. Stating a review protocol is very beneficial in terms of clearing the steps of a study. Figure 3.1 states our road map of this systematic review.
Figure 3.1: Activity Diagram for Reviewing Protocol of SLR
We define our research questions (section 3.2.2) based on our aim in this SLR. According to these questions, we define our search strategy (section 3.2.3). After that, in order to decide which studies will be used, we define study selection criteria (section 3.2.4). This study selection criteria enables us to specify our primary studies. We analyze and interpret these primary studies according to
a quality assessment (section 3.2.5). With data extraction process, we show the process of gathering information from our primary studies (section 3.2.6). Finally, in data synthesis (section 3.2.7), we show our extracted data and related results.
3.2.2
Research Questions
Specifying the research questions is the base part of systematic review. The qual-ity of the questions determines the qualqual-ity of the research. In this systematic re-view, we focus on architecture consistency checking with model-driven approach. Following research questions are stated in order to get relevant studies:
RQ.1: What are the proposed solutions of architecture-view consistency check-ing with model driven development?
RQ.2: What are the challenges and research directions related to architecture-view consistency checking with model driven development?
RQ.3: What is the evidence performance of the studies?
3.2.3
Search Strategy
In search strategy section, we explain our scope, search methodology and search strings that are created for electronic databases.
3.2.3.1 Scope
The scope of our research includes the publication areas and publication dates. We conduct our search on the following well-known databases; ACM Digital Li-brary, IEEE Xplore, ISI Web of Knowledge, Science Direct, Springer, Wiley In-terscience and Scopus. In IEEE Xplore, Springer, Wiley InIn-terscience and Scopus we search the sources between 2004-2014 time period. In Science Direct database,
we reduced the selected scope into “computer science” and “engineering”. Our search focuses on journal, conference and workshop papers.
3.2.3.2 Search Strategy
In order to have a high quality of systematic literature review, to define and monitor a search strategy is essential. For our search strategy we conduct the following steps based on the work [13]:
1. Searching related SLRs to our topic.
2. Creating search strings with using AND and OR operators in order to get sophisticated search terms for electronic databases.
3. Checking conference and journal papers.
4. Tracing the gathered results and eliminate the unrelated papers manually. In the phases 2 and 4, we encounter some difficulties that electronic databases may give very big amount of unrelated papers, their command search method-ology can be upgraded after some time. The created search string should be changed according to electronic database methodology. Some related studies can be overlooked because of the electronic databases. To overcome these problems, we manually did a lot of work to identify the related studies and updated our research strings during the research process.
3.2.3.3 Search String
In the phase of database search, we create a search string related to our search area. In order to get meaningful results, for each database search we create differ-ent search strings with the same contdiffer-ent. Using AND/OR operations, reducing time scope and area are some paper limitation techniques. Below string is the ex-ample for IEEE Xplore search string. Others can be found in Appendix-A/Search
Strings.
((“Document Title”: software architecture AND (p Title: views OR “Docu-ment Title”: models)) OR (p Title: consistency checking OR “Docu“Docu-ment Title”: conformance analysis OR “Document Title”: conformance checking OR “Docu-ment Title”: inconsistency)) (Between years 2004-2014)
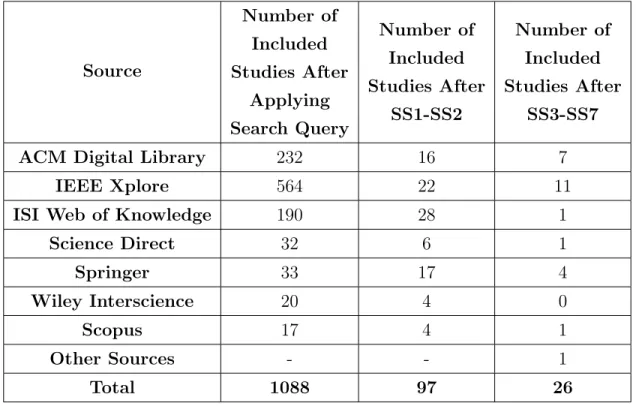
Table 3.1 shows our search results according to our search strings for each database and our study selection criteria. 1088 sources are gathered from databases automatically. Most of them are unrelated to our objective and we reviewed these sources manually. As a first step, we eliminate the papers whose full texts are not available and not related to software engineering. Secondly, we eliminate the papers which they have duplicates, not related to software archi-tecture, not satisfy the content and not being a conference or journal papers.
Table 3.1: Search Results According to Search Strings and Study Selection
Source Number of Included Studies After Applying Search Query Number of Included Studies After SS1-SS2 Number of Included Studies After SS3-SS7 ACM Digital Library 232 16 7
IEEE Xplore 564 22 11
ISI Web of Knowledge 190 28 1
Science Direct 32 6 1 Springer 33 17 4 Wiley Interscience 20 4 0 Scopus 17 4 1 Other Sources - - 1 Total 1088 97 26
3.2.4
Study Selection Criteria
While searching on databases with the specified search queries, the obtained results have a large range of documents. Most of them can be unrelated to our objectives in this SLR. In order to get accurate results in the source elimination stage, we define our selection criteria as the following:
• SSC 1: Papers where the full text is not available. • SSC 2: Papers do not relate to software engineering. • SSC 3: Papers do not relate to software architecture.
• SSC 4: Papers do not relate to architecture-view consistency checking. • SSC 5: Papers do not satisfy the content.
• SSC 6: Duplicate publications found in different search sources.
• SSC 7: Papers which are experience, proposal, critical review and survey papers.
After the automatic search, we apply manual search in order to eliminate the unrelated papers with two exclusion criteria that former includes SS1-SS2, latter includes SS3-SS7. At the end of the process, 26 papers are selected as primary studies.
3.2.5
Study Quality Assessment
In this stage, we take both the quality and the quantity of the primary studies into consideration. In order to evaluate each primary study in terms of these aspects, we define a quality assessment criteria [13]. With this review of the papers, we could facilitate the analyzing and interpreting process for the feature research.
In order to increase the bias within the studies, we develop a study quality assessment. Table 3.2 presents our quality checklist questions. We consider both the quality and quantity of the studies and the preparation of these questions depends on [13]. To rank the studies according to a quality score, we present a scoring technique that if the answer to the question is “yes”, the score is: 2, if the answer is “indifferent”, the score is: 1, finally if the answer is “no”, the score is: 0. The results of the quality assessment can be seen in Appendix-C/Study Quality Assessment.
Table 3.2: Quality Assessment Checklist
No Question
Q1 Are the main theme and motivation of the study clearly stated? Q2 Do the researchers clearly define the scope and context of the study? Q3 Do the researchers clearly define methods/approaches/technologies
given in the study?
Q4 Do the researchers clearly explain the proposed solutions and vali-date them by an empirical study?
Q5 Does the study reporting is clear and coherent? Q6 Do the researchers answer the all study questions?
Q7 Do the researchers present negative findings in the study?
Q8 Do the researchers explain the consequences of any problems with the validity/reliability of their measures?
Q9 Do the conclusions satisfy purpose of the study?
Q10 Does the study have implications in practice and results in research area for architecture-view consistency checking with MDE?
3.2.6
Data Extraction
In this data extraction process, we read the 26 selected primary studies and an-alyze them with answering the research questions. We created a data extraction form that includes the information such as ID, title of the study, date of extrac-tion, authors, years, source, etc. In addition to these fields, some other fields such as main theme of the study, motivation for the study, targeted domain and methodology are added to this form. In Table 3.3, we show the extracted data according to our research questions. The detailed data extraction form is given in Appendix-D/Data Extraction Form.
Table 3.3: Data Extraction Research
Questions Data Extracted
RQ1
Targeted domain, Main theme of study, motivation for study, input model/type, model checking language/technology/type, generated models after model checking, contribution type, method for generated model
RQ2 Constraints, limitations and challenges of proposed solution, findings
RQ3 Assessment approach, evidence type
3.2.7
Data Synthesis
In this phase, the process is arranging and summarizing the extracted data from the previous phase. In order to answer the study questions effectively, this stage has an important role. The other importance of this phase is the synthesis of both quantitative and qualitative analysis of the studies. However, the studies
we reviewed are more comparable within the qualitative aspects. In a few pa-pers there is an information about quantitative analysis. Therefore, we interpret the qualitative aspects of the papers and reach quantitative results in order to compare them with each other.
To present the data with qualitative and quantitative manner, we use tabular representation. With this representation, it is easy to interpret and compare the data.
3.3
Results
3.3.1
Overview of the Reviewed Studies
In this section, the summary of the 26 studies is given.
• Study 1: In this study, the authors apply their XML (Extensible Markup Language) semantics approach in order to detect the inconsistencies and in-completeness among UML diagrams. Firstly, they translate UML diagrams into XMI (XML Metadata Interchange) documents and then, with XML semantics checker model, they analyze these XMI documents. Finally, they get a report about inconsistencies and incompleteness about the diagrams. They correct them manually or automatically.
• Study 2: In this work, the author states that with the light of software ar-chitecture viewpoints, inconsistencies can be detected and facilitated. With correspondence rules, the concept of view correspondence, inconsistencies and dependencies can be captured between architectural views. The author gives two examples that the former is about inconsistencies due to archi-tecture descriptions, the latter is about dependencies due to archiarchi-tecture viewpoints.
generated with the use case driven approach and CPN (Colored Petri Net) formalism. Because of the fact that UML models are more complicated, they prefer CPN models. The authors analyze four dynamic models of UML which are use case, state machine, sequence and activity diagrams. Firstly, they translate UML models into CPN models and apply their criteria to evaluate the consistency among models. At the end, these CPN models transform into equivalent consistent UML models.
• Study 4: In this study, a tool (Model Consistency Checker, MCC) is cre-ated in order to check the inconsistencies between UML models. They use Description Logics (DL) mechanism. For the authors, UML meta-model can be described with DLs because of that UML meta-model consists of class diagrams. In this work, each consistency is evaluated independently with MCC.
• Study 5: In this study, the authors create TReMer+ (Tool for Relationship Driven Model Merging) consistency checking tool for distributed models. With model merging technique, they apply global consistency checking be-tween the diagrams which are ER, UML and state machine. They work on homogeneous models.
• Study 6: In this study, heterogeneous models are studied in order to check the global consistency with model merging approach. They take metamod-els as input modmetamod-els. With model merging approach, they merge relevant parts of the metamodels and create a common metamodel. Then, they apply consistency checking to these newly created homogeneous models. • Study 7: In this work, the authors present two metamodel based approaches
for model conformance and multiview consistency checking. These two different approaches PVS [15] and Eiffel [16] are languages that have tool supporting. PVS is a specification language and Eiffel is an object-oriented programming language. In order to compare these two approaches, the authors use the metamodel and models of BON language. According to their results, for multi-view consistency checking PVS approach gives the most complete solution according to Eiffel solution. For model conformance,
PVS provides partially automatic solution, on the other hand, Eiffel has a fully automatic result for it.
• Study 8: In this work, the authors create a tool in order to detect and fix the inconsistencies between ADDs (Architectural Design Decision) and architectural views (C&C views). Their tool ADvISE [17] is for modeling the reusable ADDs and the tool VbMF [18] is for modeling the model driven based architectural views. With AK (Architectural Knowledge) language, they transform the decisions into design, namely the instances of C&C views are created by ADDs. Then, they can apply consistency checking between ADDs and views with constraint validator. The constraints are implemented by EVL (Epsilon Validation Language) [19]. Fixing the C&C views is done by automatically, but revising ADDs is done by the architects. • Study 9: In this study, a fully automated consistency checker tool is created. This tool is integrated with IBM Rational Rose [20]. The big advantage of this tool is that it gives instant design feedback to users with detecting and tracking the inconsistencies in the design.
• Study 10: In this study, providing security in the design stage of a system is the main point. The authors deal with Class and Sequence diagrams, and their interactions. With their algorithms, they analyze the class diagrams of a system and detect the inconsistencies, related to security problems, between the sequence diagrams. They show a message to the developer in order to fix the errors.
• Study 11: In this study, the authors check the inconsistencies between UML sequence and statechart diagrams with ECPN (Extended Colored Petri Net) technique. Firstly, with flattening technique, called EHA (Extended Hier-archical Automata), UML dynamic models can be modeled by it. Then, EHA states transform into ECPN forms. After getting ECPN forms of the models, the coverability graph is gained and consistency checking is applied on this graph.
• Study 12: In this study, the authors transforms UML models into OWL instances. With this transformation, UML metamodel can be represented
as OWL ontologies and this gives a rise to detect additional inconsistencies at the semantic level. After the transformation, they use logical reasoning and query techniques in order to check the consistencies semantically. • Study 13: In this work, the authors use BON language instead of UML.
According to them, with B method, it is easy to describe BON metamodel and its specifications. In this paper, they create a metamodel that provides a framework in order to check the inconsistencies among BON models. They separate the consistency checking into two types which are single view and multi view consistency checking. With B toolkit, they apply the consistency checking totally automatic.
• Study 14: In this study, the authors check the inconsistencies between UML models with the approach of transforming models into formal Z specifica-tions. In order to do check the inconsistencies, they firstly transform UML models into Z specification with Fujaba [21] tool. They extend this tool according to our approach. Then, with Z/EVES [22] tool, they detect the inconsistencies among UML models.
• Study 15: In this work, the author analyzes the 6 types of UML diagrams which are use case, class, activity, state machine, sequence and communi-cation diagrams in order to identify and check the inconsistencies between them. For this work, he uses manual check, compulsory restriction, auto-matic maintenance and dynamic check techniques. To check the inconsis-tencies among UML diagrams, UML modeling tools are used. However, for the author this automatic checking is not enough, so manual checking is inevitable.
• Study 16: In this work, the authors take only statechart and sequence diagrams into consideration. With SPIN tool, they check inconsistencies between these two diagrams. Firstly, they convert statechart diagram into XYZ/E (a formal programming language based on linear temporal logic) and with their algorithm, XYZ/E is converted into Promela. In order to express sequence diagrams, they use LTL (Linear Temporal Logic) formulas. These Promela and LTL formulas are the input models for SPIN language,
then they check the inconsistencies between diagrams.
• Study 17: In this work, the authors check the inconsistencies between se-quence and state diagrams. Firstly, they describe state diagrams with FSP (Finite State Processes) and sequence diagrams with messages trace. Then, they use LTSA which is a model checker tool in order to check the incon-sistencies between these two diagrams.
• Study 18: In this study, the authors present a method that provides model-ing and verification of architectural designs with usmodel-ing PAT (Process Anal-ysis Toolkit.) They also state an architecture description language called Wright# which is an extended version of Wright [23] language which adopts C&C views.
• Study 19: In this study, the authors use BON language and its metamodel instead of UML. According to them, light weighted of BON language is more provided than UML. In this paper, they create a metamodel that provides a framework in order to check the inconsistencies among BON models. They separate the consistency checking into two types which are single view and multi view consistency checking. As a difference from Study 14, the authors generate Dynamic-B method which is a combination of B method and CCS system.
• Study 20: In this study, the main aim of the authors is that providing MDA refinement. In order to do this, within the MDA approach, they generate consistent models by a tool support, OCL engine.
• Study 21: In this study, the authors generate an algorithm in order to check the inconsistencies among multiple architectural views. They define the diagrams with graphical notations and apply their algorithm on them. As an additional work, they create a language in order to define constraints. • Study 22: In this work, the authors create a tool called WAVE for open sys-tems, that detects inconsistencies of architecture description also providing collaborative working, incremental development and component reuse. Ac-cording to models and metamodels they get as an input from the user/archi-tect, they work on their XML file structures and apply consistency checking
rules on them. Finally, they can show a report to the user.
• Study 23: In this study, the authors create a tool called Consistency Work-bench in order to manage consistencies between object-oriented models, i.e., UML models. They transform UML models into XMI form with UML CASE tools. With the input model, consistency checking is done manually by the software engineer, then the results is shown in the workbench. • Study 24: In this work, in order to check consistency the authors define
a model state space differs from the other methods. They use automata theory for detecting inconsistencies and do this action automatically. With their automata approach, they can detect inconsistency among models on-the-fly and enable user to edit models with showing a report.
• Study 25: In this study, the authors firstly specify the inconsistencies among views, then cope with these inconsistencies with AD (Architecture Descrip-tion) notion. For consistency checking, they firstly take the viewpoints that will be used in the AD from the architecture, create its metamodel and corresponding XMI documents. Applying consistency rules on XMI files, they can generate a report to the architecture and then architecture can have a chance to change or edit the structure.
• Study 26: In this study, the authors create a metamodel CTM (Concern Traceability Metamodel) in order to trace the aspects of architectural views. They firstly implemented the CTM with XML DTDs (Document Type Definition), then model the architecture with XML. Finally, traceability links within and across the architectural views are created with using DTDs and Xquery. The results can be seen in an XML file.
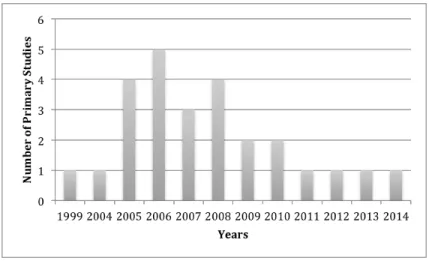
In Figure 3.2, we represent the distribution of the selected primary studies in terms of publication year. According to our findings, most of the papers are published between the years 2005-2008.
Figure 3.2: Distribution of the Studies by Year
We show the publication details of the primary studies in Table 3.4 and Figure 3.3. For our results, among 26 studies, 18 of them are conference papers, 4 of them are symposium, 2 of them are journal and 2 of them are workshop papers. In terms of publication source, 13 of the studies are published by IEEE, 7 of them by ACM, 4 of them by Springer, one of them is published by Science Direct. Apart from 2 studies which have a publication channel “International Conference on Software Engineering”, the other studies have different publication channels from each other. Most of the publication channels (11 of them) are directly related to software engineering, others have broad range of fields.
Table 3.4: Publication Channel Distribution of the Primary Studies
Publication Channel Publication
Source Type
Number of Studies Asia-Pacific Software
Engineering Conference ACM Conference 1 Automated Software Engineering ACM Conference 1
Australasian Software
EngineeringConference IEEE Conference 1 ACS/IEEE International
Conference on Computer Systems and Applications
IEEE Conference 1
International Conference on
Computing IEEE Conference 1 Computer Software and
Applications Conference IEEE Conference 1 Computer Sciences and
Applications IEEE Conference 1 Computer Supported
Cooperative Work in Design IEEE Conference 1 European Conference on Model
Driven Architecture Springer Conference 1 European Conference on
Software Architecture ACM Conference 1 European Software Engineering
Conference Springer Conference 1 Software Technologies
Concertation on Formal Methods for Components and Objects
Springer Symposium 1
International Symposium on High Assurance Systems
Engineering
International Conference on
Software Engineering ACM Conference 1 International Conference on
Software Engineering IEEE Conference 1 International Conference on
Computer Science & Education IEEE Conference 1 International Conference on
Software Reuse Springer Conference 1 International Conference on
Computer Engineering and Systems
IEEE Conference 1
Communication and Information
Technologies IEEE Symposium 1 International Symposium on
Information Science and Engineering
IEEE Symposium 1
Journal of Object Technology - Journal 1 Workshop on Model-Driven
Interoperability ACM Workshop 1 REFINE Workshop Science
Direct Workshop 1 Transactions on Software
Engineering and Methodology ACM Journal 1 Wireless Communications,
Networking and Mobile Computing
IEEE Conference 1
International Conference on
3.3.2
Research Methods
In this section, we present the research methods of the selected primary studies in Table 3.5. According to our observations, most of the studies use short examples in their work. Only one paper has an experiment and gives related results for its findings. Case studies are also used in order to show the reliability and quality of the applied work.
Table 3.5: Research Methods of the Primary Studies Research
Method Studies Number Percent Case Study 5, 8, 9, 13, 18, 21, 25, 26 8 31 Experiment 4 1 4 Short Example 2, 3, 6, 7, 10, 11, 12, 14, 15, 16, 17, 19, 22, 23, 24 15 58 Not Defined 1, 20 2 7
3.3.3
Methodological Quality
To state the quality of the primary papers, we conduct a quality assessment cri-teria. We evaluate the primary papers in terms of quality of reporting, rigor, credibility and relevance of the studies. The first four questions mentioned in Table 3.2 correspond the quality of reporting, the questions fifth and sixth corre-spond the rigor of the studies, the questions seventh and eighth correcorre-spond the credibility of the studies and finally the questions ninth and tenth correspond the relevance of the them. At the end of this methodology, we can find the total quality of the primary studies.The detailed results of the quality assessment can be seen in Appendix-C/Study Quality Assessment.
We show the quality of reporting of the selected primary studies in Figure 3.4. According to this figure, if we specify that the quality of reporting value is 6 or greater means good, we can say that 66% of papers (17 of them) are good in
terms of quality of reporting.
Figure 3.4: Quality of Reporting of the Primary Studies
In Figure 3.5., we show the rigor quality of the primary studies depending on the fifth and sixth questions in Table 3.2. According to the results, 16% of the papers (4 of them) have a low rigor quality, however, we can say that 84% of the papers (22 of them) have a good rigor quality.
Figure 3.5: Rigor Quality of the Primary Studies
In order to present the credibility of the primary studies based on the questions seventh and eighth in Table 3.2, we evaluate the papers in terms of their evidence performance (see Figure 3.6). According to results that we get, 4% (one of them)
of the papers have full credibility and 39% (10 of them) of the papers have normal evidence quality, however, 57% (15 of them) of the papers have low credibility.
Figure 3.6: Credibility Quality of the Primary Studies
Depending on the ninth and tenth questions in Table 3.2, we examine the studies in terms of relevance quality to our research area (see Figure 3.7). 46% (12 of them) of the studies have poor relevance, however, 54% (14 of them) of the them is good.
Figure 3.7: Relevance Quality of the Primary Studies
In order to show the total quality of the primary studies, we sum the values of each category of the studies. According to Figure 3.8, if we divide the quality
value into three parts that if the total value is between 16-20, it means very good, if it is between 12-15, it means good, if it is lower than 12, it means the studies have poor quality. We can say that 12% of papers (3 of them) are very good, 50% of papers (13 of them) are good and 38% of papers (10 of them) have poor quality.
Figure 3.8: Relevance Quality of the Primary Studies
3.3.4
Systems Investigated
In this section, we evaluate the primary studies according to our defined research questions.
RQ.1: What are proposed solutions of architecture-view consistency checking with model driven development?
In order to check a model, firstly we need an input model (UML model, BON model, etc.) and in our work we focus on the architectural models/views. In Figure 3.9., we present the primary studies according to their input model type in model checking. According to the results, 19% of the papers (5 of them) are architectural models, 54% of the papers are UML models (14 of them), 11% of the papers are BON models (3 of them), 12% of the papers (3 of them) are metamodels and 4% of the papers (one of them) have other type of models. As
stated in our first research question, we tried to find the works which are related to architectural views with model-driven engineering approach. However, among 5 papers related to architectural views, 3 of them are depending on model-driven techniques.
Figure 3.9: Input Model/Type of the Studies
After getting the input model, we need to check it with a methodological way. We evaluate the primary studies according to their model checking types (see Figure 3.10). We found that 15% of the studies (4 of them) do this model checking process via programming languages, 46% of the studies (12 of them) use tools which can automatically do the checking process, 8% of the studies (2 of them) have/create their own algorithms for checking, 23% of the studies (6 of them) have their own methodology that they apply model transformation process and then check the models with their methodology, 8% of the studies (2 of them) does not define their model checking process.
Figure 3.10: Model Checking Type of the Studies
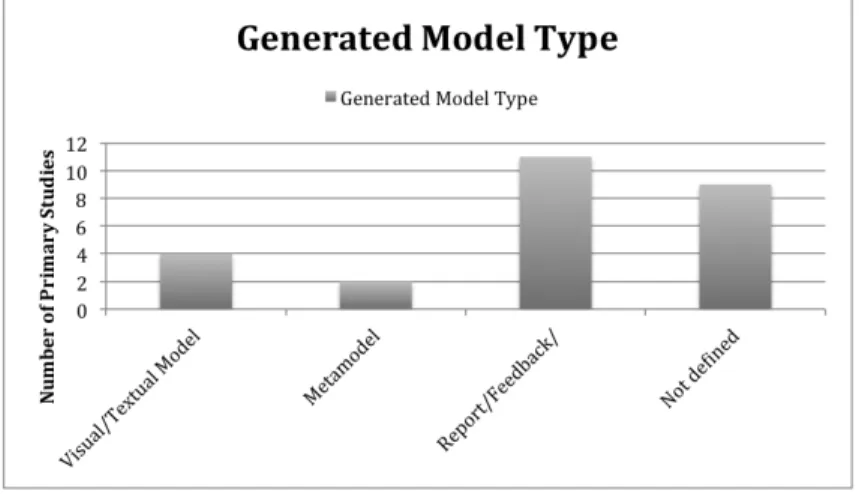
At the end of the model checking process, we want to see the corrected version of the models without inconsistencies (see Figure 3.11). In our research, we found that 15% of the studies (4 of them) can show the visual and textual form of the models to the users, 8% of the studies (2 of them) create a metamodel at the end of the checking process, 42% of the studies (11 of them) show reports, warnings, comments, etc. and via this way an architect/engineer can see the errors/inconsistencies in the models and can have a chance to change the model by himself, 35% of the studies (9 of them) does not define their generated model.
Figure 3.11: Generated Model Type of the Studies
our findings, 61% of the studies (17 of them) are done the model checking process with an automated way where 11% of the studies (3 of them) check the models manually, 21% of the studies (6 of them) use the automatic systems in some stages of the checking and manual checking in some points, 7% of the studies (2 of them) does not talk about their methodology in this field.
Figure 3.12: Methodology for Generated Models of the Studies
RQ.2: What are the challenges and research directions related to architecture-view consistency checking with model driven development?
In our research, the main challenge is that very few amount of the studies (5 of them, see Figure 3.9) are related to architectural views. Because of the fact that in the literature the area of architectural view consistency checking is narrow, we decided to broaden our research with taking other types of models into consideration. For that reason, we encounter ver big amount of papers related to UML/BON diagram checking and many of them include only 2-3 diagrams checking.
The other challenge is that in only one paper an experimental study is con-ducted (see Figure 3.14). 8 of the studies have case studies but there is lack of evidence to evaluate the working systems. Also, 85% of the studies are related to academic cases, namely when a system is created and there is a need to test, academics usually take the correct system and change a correct part of it. In the
testing stage, an error can easily found and the accuracy of the system can be high. However, in real life very different conditions can be in the systems and the views/models related to these conditions may include many inconsistencies in itself. Therefore, working on industrial cases is important in order to evaluate the quality, accuracy, reliability of a system.
RQ.3: What is the evidence performance of the study?
We present the evidence type of the primary studies in Figure 3.13. According to our results, 85% of the studies (22 of them) are related to academic cases where 15% of the studies (4 of them) are related to industrial cases.
Figure 3.13: Evidence Type of the Studies
In Figure 3.14, we present the assessment approach in the primary studies. 58% of the studies (15 of them) give short examples in their work and it is a big threat in terms of validity of the systems. 31% of the studies (8 of them) have case studies, but there is no information about accuracy or something like that, 4% of the studies (one of them) has an experiment in their study and some results to evaluate their work, 7% of the studies (2 of them) does not give any assessment approach.
Figure 3.14: Assessment Approach of the Studies
3.3.5
Threats to Validity
When we conduct this systematic literature review, incomplete research is one of the most important threats among all. At the beginning we create a search string which includes some keywords related to our research topic. Then, we trace electronic databases with using this search string automatically. Most of the time, electronic databases cannot find the related papers according to the given search string and in some databases we need to add/delete some keywords from the search string. Because of the fact that we may get unrelated results, we check up many databases and also search our topic on the internet. As an other important threat in the research, the authors do not work on real cases in most of the papers. Due to the fact that about 87% of the papers have a target domain as academics, many of the approaches are not validated with the real cases. This causes a big threat to validity that i.e. if there is a need to create views in order to show the inconsistency between them, normally to change the consistent view into inconsistent view is the first thing to do, namely break the architectural rules within the views. However, in real life there can be very different conditions in systems and the views related to these conditions may include many inconsistencies. Also, ambiguity in the papers is the other kind of threats. In some papers, authors do not state their methodology, the proposed solution and the assessment type clearly.
In order to overcome these threats to validity, firstly we create a study selection criteria. With this study selection process as we mentioned in Section 3.2.4, we eliminate very big amount papers according to our criteria. After this study selection, we conduct a data extraction process on 26 primary studies we gained. In the light of our research questions, we analyze the papers in terms of their limitations, inadequacies, drawbacks and positive sides. We distinguish them according to their motivation, model checking type, assessment approach, etc.
Chapter 4
Case Study
In this chapter, we introduce a case study called E-school System through Views and Beyond approach. E-school is a system that provides continuous communi-cation between students, teachers and directors. Students have a right to reach every kind of knowledge and study material. Together with the developing tech-nology all over the world, there is a need for this kind of system in the schools. With E-school system,
• Students can reach online course materials such as books, past exams, home-work and quizs.
• Students can be informed about exam/quiz/homework dates and deadlines via e-mail system.
• Teachers can share course materials with students via e-mail system. • Directors and teachers can communicate with e-mail system.
• Teachers and school management can monitor student activities. • School management can monitor teacher and student activities.
• The users can reach E-school system via their personal computers or mobile devices.
In order to illustrate E-school system, a sample scenario can be started by a student (student A). Student A logins to E-school system and wants to see his old mathematics exams in order to study for his finals. Then, he recognises that he has two messages from his teacher (teacher B). In the e-mail, teacher B sends to all students a homework about trigonometry and informs the date and the time of the mathematics final exam. After reading his e-mails, student A completes the mathematics homework and logouts from the system. Then, the director (director C) of the school logins to system and checks the teacher B activities. Director C sends an e-mail to teacher B about lack of mathematics final exam materials. When teacher B sees the e-mail from director C, she sends extra materials to students for the final exam.
In below sections, the architecture of E-school system is documented by using the views included in the Views and Beyond approach.
4.1
Module Styles
4.1.1
Decomposition View
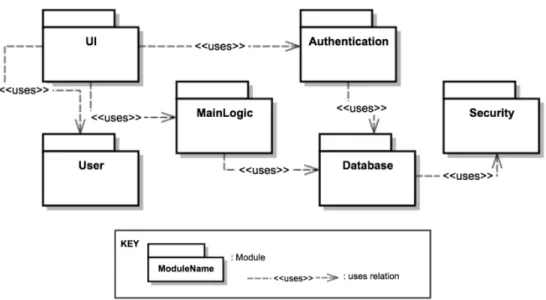
E-school system has a root element called E-school. E-school root module has seven main modules (UI, User, Database, etc.) and they have submodules within themselves. UI module is responsible for the representation of each feature of the system. User module includes Student, Teacher, Director and Admin sub-modules. MainLogic module enables users to reach and process with online ma-terials in the system. MainLogic module has CourseMaterial submodule and it includes E-book, Exam, Quiz and Homework submodules. Homework submodule has TextHomework and VideoHomework submodules. MessageManager module provides the e-mail system within the system users. Authentication module has the control of login actions to E-school system. It checks the user names and passwords of each user that the data coming from Database module. Database module includes Backup submodule which includes the backup information about
users and backups of course materials. Finally, Security module is responsible for the secure data flow of E-school system. Decomposition view of E-school system can be shown visually in Figure 4.1.
Figure 4.1: Decomposition View of E-school System
4.1.2
Uses View
Uses view of E-school system can be shown in the Figure 4.2. UI module uses Authentication, User and MainLogic modules. Authentication and MainLogic use Database module, Database module uses Security module.
Figure 4.2: Uses View of E-school System
4.1.3
Generalization View
User module has Student, Teacher, Director and Admin child modules. Course-Material includes E-book, Exam, Quiz and Homework child modules. Homework module has TextHomework and VideoHomework child modules. Generalization view of E-school system can be shown in Figure 4.3.
Figure 4.3: Generalization View of E-school System
4.1.4
Layered View
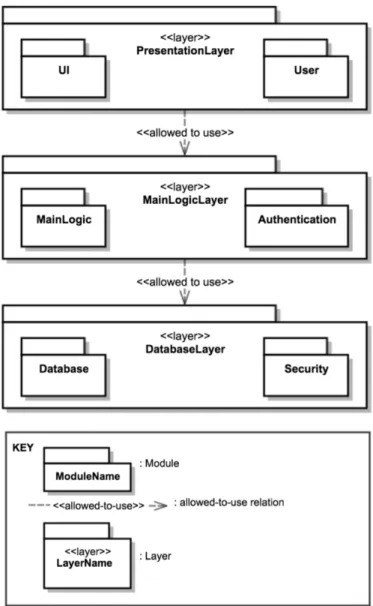
There are three layers for E-school system. The topmost layer, Presentation-Layer includes UI and User modules and is allowed to use MainLogicPresentation-Layer which includes MainLogic and Authentication modules. MainLogicLayer is allowed to use DatabaseLayer including Database and Security modules. Layered view of E-school system can be shown in Figure 4.4.
Figure 4.4: Layered View of E-school System
4.1.5
Aspects View
There are two aspect modules Authentication and Security. They have separate crosscutting concerns for E-school system. Aspects view of E-school system can be shown in Figure 4.5.
Figure 4.5: Aspects View of E-school System
4.1.6
Data-Model View
Data-Model view shows entity relationships with is-a relation and one-to-one, one to many, many to many relations. Student, Admin, Teacher and Director are a User. Therefore they have “is-a” relation. CourseMaterial entity has one to many relationships with E-book, Exam, Quiz and Homework entities. In the same way, Homework entity has “one-to-many” relationships with TextHomework and VideoHomework. Data-Model view of E-school system can be shown in Figure 4.6.