A Design Aid Plug-In Implementation on Exhibition Layout Planning
*
Kutay GÜLER
**
Levent MERCÝN
Abstract: In this research, evaluating the opinions of interior architecture graduates on a plug-in
system implementation for the 3d modeling program 3d Studio Max. Additionally related to this research proposing a design-aid for exhibition layout design by implementing a plug-in system for 3d Studio Max was aimed. The program created for this research works in two phases: The environment creation process which mainly incorporates the modeling tools of 3d Studio Max, but the plug-in provides ready-made exhibit objects to quickly populate the environment. The evaluation method is calculated according to the viewing areas of exhibited objects which are generated according to human cone of vision, human physical space, exhibit-objects' type and size, and maximum number of visitors in the exhibit at a time. As a result of this research, according to the respondents' opinions it is understood that this system provides valuable assistance to the 3d environment creation and environment evaluation processes. According to the findings, in future research, using real-time and animated visitors; conducting in real galleries and comparing the results to the results of this research was suggested.
Keywords: Exhibition Planning, Computer Aided Design, Plug-in
Sergi Düzeni Planlamasý Ýçin Tasarýmý Sürecini Destekleyici Bir Eklenti Program Uygulamasý
Özet: Bu araþtýrmada üç boyutlu modelleme programý olan 3d Studio Max için sergi düzeni
tasarým sürecini destekliyici bir eklenti programýnýn uygulamasýna iliþkin güzel sanatlar fakültesi iç mimarlýk bölümü mezunlarýnýn görüþlerini deðerlendirmek amaçlanmýþtýr. Ayrýca bu araþtýrmaya baðlý olarak üç boyutlu modelleme programý olan 3d Studio Max için sergi düzeni tasarým sürecini destekliyici bir eklenti program sunulmaktadýr. Araþtýrmada oluþturulan program þu þekilde iþlemektedir: Mekan tasarýmý sürecinin büyük bir kýsmý 3d Studio Max ile birlikte gelen modelleme araçlarý tarafýndan gerçekleþtirilse de, makalede sunulan eklenti program hazýr sergi objeleri ile yaratýlan mekanýn düzenlenmesinde kolaylýk saðlamýþtýr. Deðerlendirme metodu ise sergilenen objelerin izleme alanlarýna baðlý olarak mekan analizi yapmaktadýr. Bu izleme alanlarý ise insanýn görüþ konisi, vücut alaný, sergilenen objenin tipi ve boyutler, ve bir zaman dilimindeki maksimum izleyici sayýsý kullanarak hesaplanmaktadýr. Araþtýrma sonucunda katýlýmcýlarýn görüþlerine göre bu sistemin üçüncü boyutta mekan oluþturma ve mekan deðerlendirme süreçlerine olumlu katkýlar saðladýðý anlaþýlmýþtýr. Elde edilen sonuçlara göre daha sonra yapýlacak araþtýrmalarda bilgisayar ortamýda canlandýrýlmýþ ziyaretçilerden yararlanýlmasý; gerçek sanat galerinde uygulanmasý ve çýkan sonuçlarýn bu araþtýrmada elde edilen sonuçlar ile kýyaslanmasý önerilmiþtir.
Anahtar kelimeler: Sergi Düzenleme, Bilgisayar Destekli Tasarým, Eklenti
*
Araþtýrma Görevlisi. Dumlupýnar Üniversitesi Güzel Sanatlar Fakültesi Ýç Mimarlýk Bölümü **
INTRODUCTION
Design process is very complex in nature because of its multi-layered structure and reflective progression (Schön, 1987). Design evaluation has an important role throughout this process since its complexity may cause many errors as the product advances. A design can be evaluated and analyzed in many different ways and simulations have been used as a way of evaluation for a considerably long time. The concept behind simulations are evaluating and analyzing the product as precise as possible to comprehend the weak and lacking points and also to prevent repeated mistakes or radical changes in advanced phases to increase efficiency in design (Mubarak, 2004).
Although contemporary simulations are mostly computer based, many common methods like sketching, rendering and modeling can be considered as some of the oldest and basic methods of simulations (Saunders & Gero, 2004). Today there are many simulation packages available in the market and many are being developed in the research arena, most of which are focusing on the detailed design phases, analyzing physical properties of the design. Interior design process seems almost untouched by simulations when compared to other professions of design. There are several works from countries China and Japan concerning human behavior in public spaces (Feurtey and Chikayama, 2000) and even in exhibitions (Jun, Sung and Choi, 2006), but they are not aiming to improve the design or help the designer throughout the process.
Exhibition design often incorporates further complexity and problematic issues when compared to other design problems, since it involves many distinct variables like visitor attention, motivation, line of sight; or the attraction and stimulation levels of an exhibited object; or different exhibition themes and concepts (Bitgood, 2002). This distinctiveness results in exhibitions in many different types, sizes and formats (Neal, 1987).
Another important variable in exhibition design is the space that the exhibition will be held, and proper planning of this space plays a crucial role in the visitor satisfaction (Bitgood, Patterson and Benefield, 1988; Bitgood and Loomis, 1993). Small museum and art gallery exhibitions are relativelity more problematic in space planning because, considering the number and variety of exhibitions held in a period of time, there is a greater need of flexibility for adapting exhibitions of different sizes and concepts inside the same space. This flexibility can be achieved through different methods, such as modular stands, mobile panels or modifiable showcases, but at the end this flexibility may create more complexity in layout planning.
exhibition layout planning by introducing a quick and easy exhibition creation and evalution method in 3d environment. The main approach of this research is creating a plug-in software for a common and user-friendly 3d graphics application program, the 3d Studio Max 9.0 (henceforth 3dsMax), which is designed for simulating the relationship between visitors and objects and between objects for evaluating the exhibition configuration in terms of human-object interaction.
DESCRIPTION OF THE PLUG-IN
Outline of the Plug-In
The proposed plug-in system will be aiding the designer by warning if there are any collisions between the viewing areas of artworks. To evaluate the configuration of the exhibition, first the user has to model the gallery in 3d and identify the locations and the types of exhibited objects, and as a conclusion there is a need for a scene creation process before the evaluation can begin. The plug-in is designed to help the curator in two points:
1) In creation of the scene: This function is based on the idea of using a readymade model will save time and also function as a visual aid in exhibition planning (Neal, 1987). A 3d virtual model of the exhibition might as well meet the same function. Dean (1994) stated that the configuration of objects in an exhibition, affects the impact of the exhibition whether they can attract and satisfy the visitor or not. Seeing the exhibited objects in 3d environment gives the opportunity to predict the behavior of the visitors and may help planning a more structured exhibition layout.
2) The evaluation of the scene: This function is based on physical needs of visitors and personal space requirements of individuals. As Ambrose and Paine (1993) stated, the composition of the exhibition is very much influenced from visitor types and needs. The physical need specifications of the visitors in the plug-in database will be created relying on anthropometric knowledge and the characteristics of human eye-vision (Pheasant, 1996).
Preliminary User Study
After specifying the outline of the program, a questionnaire has been prepared (see Appendix A for questions) to specify the outline, attributes and purpose of the program further. Samples of the questionnaire were selected from graduates of Bilkent University, Faculty of Fine Arts, using purposive sampling method. The reason behind selecting samples from fine arts graduates is, these
respondents have certain knowledge about art, exhibitions and computer applications, and purposive sampling is intentionally used to ensure that selected respondents are relatively more familiar with these concepts.
The questionnaire was divided into three groups of questions. First group of questions, which are questions 1 to 3, are related to the profession and exhibition attendance of the sample. The aim of these questions is to see if the sample is reliable in his/her answers for second and third parts of the questionnaire. Second group of questions are the questions between 4 and 10, which are related to the exhibition experiences of the sample, focusing on the circulation and viewing problems of visitors. Third group of questions are the questions between 12 and 16, which are related to the computer experience of the sample and the willingness for designing with computer.
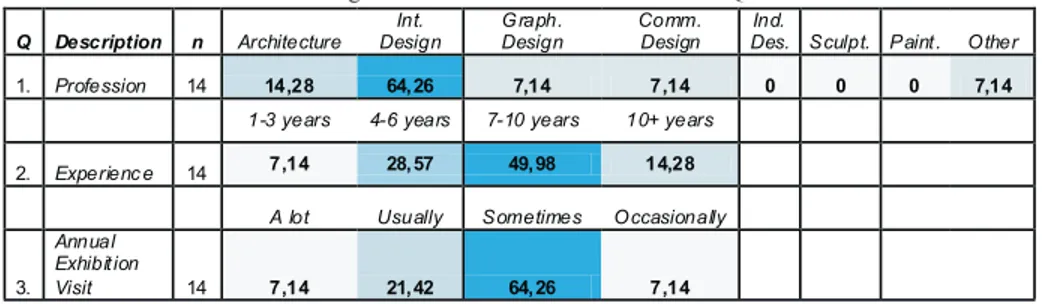
Table 1 - Percentages of Answers for the First Part of the Questionnaire
According to the first part of the questionnaire the percentage of interior designers is 64,26 which is nearly two times more than the percentage of respondents from other design branches. Regarding to the second question, with a percentage of 49,98 samples have 7-10 years of design experience which is followed by 4-6 years of experience with a percentage 28,57. The attendance of respondent to exhibitions were less than expected since the percentage of the answer sometimes is 64,26. According to the results of the first part, a consistency in the answers for the second part of the questionnaire is ensured, because in order to determine the failures in an exhibition, visitors have to be familiar with the exhibition concept and 93 percent of the respondents were attending an exhibition more than occasionally, which can be thought as more than once. Additionally, an approximation of 7 years of design experience was important because today's professional environment requires the use of technology and computer during the design process, which ensures a consistency for the third part of the questionnaire.
Q Description n Architecture Int. Design G raph. Design Comm. Design Ind.
Des. Sculpt. Paint . O ther
1. Profession 14 14,28 64, 26 7,14 7,14 0 0 0 7,14
1-3 years 4-6 years 7-10 years 10+ years
2. Experienc e 14 7,14 28, 57 49, 98 14,28
A lot Usually Sometimes O ccasionally
3.
Annual Exhibit ion
Table 2 - Percentages of Answers for the Second Part of the Questionnaire
In the second part of the questionnaire respondents stated that they have detected many errors in exhibitions they have attended in the past, even not visiting exhibitions frequently. Circulation related problems, and 2d artwork related problems were pointed out more than other problems with %85,68, %64,26 and %78,54 of emphasis on sometimes as an answer, but in general respondents detected at least three of six different problems that are listed in the
th th
questionnaire. The reason behind the %92,82 and %85,68 never in 8 and 10 questions can be unfamiliarity or inobservance of the samples. As a conclusion for the answers of the second part, the viewing evaluation function was included to the plug-in.
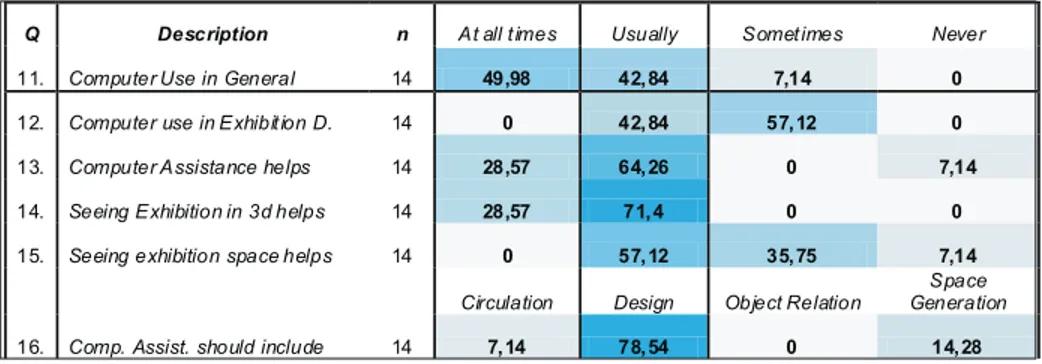
Table 3 - Percentages of Answers for the Third Part of the Questionnaire
Results regarding the third part, with a percentage of 49,98 for at all times and 42,84 for usually, nearly all respondents have a tendency to use computer aided design. And also regarding to the answers of question 12 it can also be said that respondents believes that using computer aid might be useful in exhibition design. But this was an expected outcome since nearly all of the respondents had to attend to computer related courses in their undergraduate periods, since several computer courses are mandatory in different programs of Faculty of Fine Arts of Bilkent. Additionally respondents pointed out that designing in 3d space
Q Descri pti on n At all t imes Usually Somet imes Never
4. Ciculation Problem 14 0 0 85, 68 14, 28
5. Gat hering & Bottlenecks 14 0 14, 28 64, 26 21, 42
6. 2d artwork problems 14 7, 14 0 78, 54 14, 28
7. 3d artwork problems 14 0 14, 28 35, 75 49, 98
8. Layout problems 14 0 7,14 0 92, 82
9. Height & Vision problems 14 14,28 0 35, 75 49, 98
10. Inst allat ion and Media prob. 14 0 14, 28 0 85, 68
Q Description n At all t imes Usually Somet imes Never
11. Computer Use in General 14 49,98 42, 84 7,14 0
12. Computer use in Exhibit ion D. 14 0 42, 84 57, 12 0
13. Computer Assistance helps 14 28,57 64, 26 0 7,14
14. Seeing Exhibition in 3d helps 14 28,57 71, 4 0 0
15. Seeing exhibition space helps 14 0 57, 12 35, 75 7,14
Circulation Design Object Relation
Space Generation
will help to understand the design environment better and will increase user satisfaction with an emphasis on the answers on usually. In the last question respondents stated the importance of design assistance in a software with an 78,54 percent emphasis. As a conclusion for the answers of the third part the aspect of environment creation has become more detailed, for instance detailed 3d models were added instead of boxes representing art-objects, since the 3d design and visualization of a space deemed useful by the respondents.
IMPLEMENTATION OF THE PLUG-IN
Creation of the Scene
Scene creation process has to be conducted in two stages. The first stage is the creation of the shell model, which is the gallery in this case. In the second stage exhibited objects and locations of these objects have to be specified.
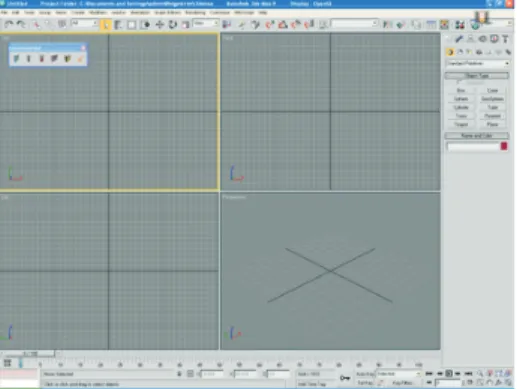
The creation of the 3d shell can be completed with the tools provided by 3dsMax. There are many powerful object creation and manipulation methods available in 3dsMax and simple geometric operations, which are most of the time enough for creating a gallery, are very easy to conduct, but it may take some time to get used to the process for designers who are not familiar with 3dsMax interface (see Figure 1).
Figure 1 – 3dStudio Max 9.0 interface.
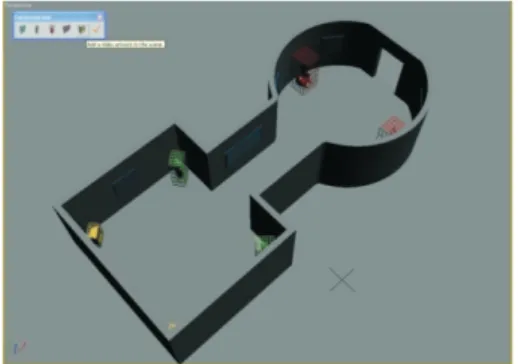
After the creation of the shell the user has populate the exhibition space with various exhibit-objects. This version of the plug-in includes only 5 different exhibition objects, which can be commonly found on art exhibitions. These objects are intentionally selected for using in case study (see Figure 2). Current object creation tools include:
1) 2d art object, which is represented with a frame, has a base dimension of 100x100x10 cm.
2) 3d art object, which is represented with a sculpture, has a base dimension of 55x70x170 cm.
3) Installation artwork, is represented with a 3d installation, has a base dimension of 90x90x200 cm.
4) Projection artwork, is represented with a projection screen, has a base dimension of 200x150x10 cm.
5) Video artwork is represented with a TV-set. Has a base dimension of 70x78x45 cm.
Figure 2 – Interface of the plug-in system.
All the objects created with creation tools can be scaled with
artWorkScale function if their base dimensions are not equal or close to
the real life size of an exhibit-object. artWorkScale function is a basic rollout which uses the scale transformation method of 3dsMax to scale exhibit-objects to an intended size. The scale transformation of an object is stored in 3point value specifying three coefficients for scaling the object in x, y, z dimensions. After an object is scaled, the scale factor is stored and can be used to transform other objects accordingly.
The 3d representations of objects are designed in different colors and every complex mesh has a rectangular hull in wire-mesh form to specify the volume of the object to base calculations also to ease perception in the virtual environment (see Figure 3).
Evaluation of the Scene
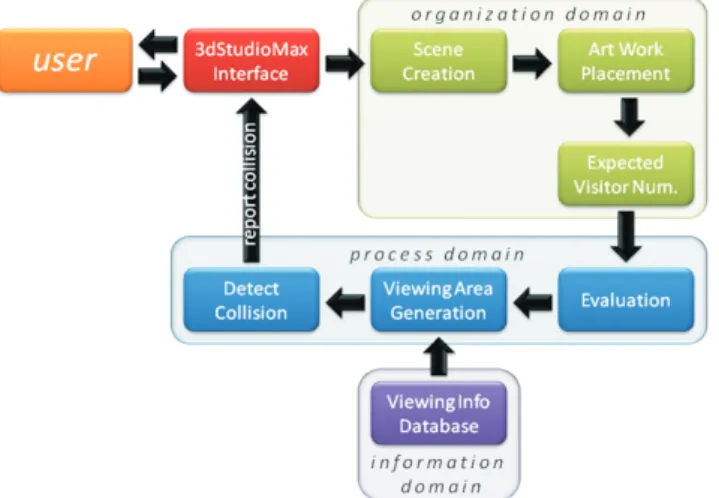
The evaluation process aims to find any collision between viewing and circulation areas to warn the designer during and after the layout planning process. Evaluation processing system is mainly based on two aspects: the human cone of vision and human physical space. The actual calculation of the scene evaluation based on generation of a viewing area for each exhibit-object according to the maximum expected visitor number and check if they collide in the 3d space.
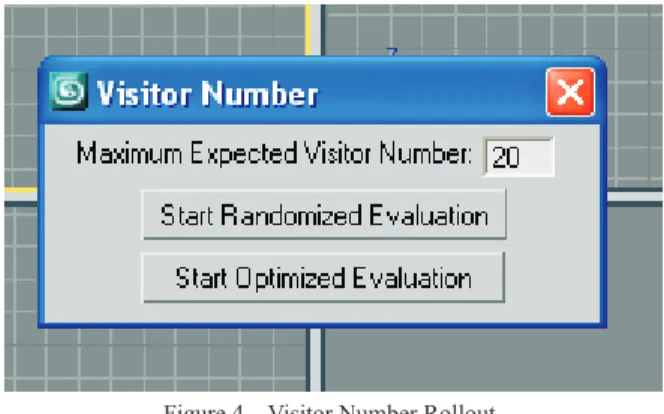
The viewing area formulation is based on the cone of vision, human physical space, the type and scale factor of the artwork it belongs to and the maximum expected visitor number (see figure 4). The human cone of vision covers 60° of horizontal and 70° of vertical area (Neal, 1987) and the approximation of body ellipse and elbow room of 95%ile male to create an ellipsis shape to define the body space of a viewer (Pheasant 1996). When executed the evaluation engine calls up a dialog box asking the user for the maximum number of expected visitors at a certain moment inside the gallery, which is saved as the maximum expected visitor number. These numbers and information is used to generate a mesh object to identify the viewer area. This viewing area is generated in the scene after each call of the evaluation engine, depending on the dimensions of the artwork, transformation factors of the artwork and the generated viewer number factor (see figure 5).
Figure 4 – Visitor Number Rollout.
The rules of evaluation is based on the agent rules of Saunders and Gero (2004) which is actually based on the herding rules proposed by Reynolds (1987) and the social force model of Hélbing and Molnar (1997). According to these models following two rules are stated:
visitors inside the exhibition.
2) Visitors can group with other visitors or they can separate to subgroups or individuals.
Figure 5 – Evaluation system architecture.
Based on these two rules, a visitor coefficient (vc) is calculated according to the maximum expected visitor number at the same time inside the gallery which is entered by the user. This coefficient is simply the average number of viewers that are viewing an artwork. In optimized evaluation this numbers stays fixed and the calculations are based on this fixed number. In randomized evaluation a random number of viewers are selected between 1 and 2(vc). Since the number of visitors viewing each artwork cannot be known because the grouping and disintegrating of visitors can not be known exactly. Depending on this result the randomized evaluation function is a better method than optimized one, but several randomized evaluations is needed in order to understand if the relationship between exhibited objects is correct.
CASE STUDY
Method of Experiment
In order to understand the effects of the plug-in in the design process a case study has been conducted with 4 interior architecture and environmental design graduates whom have attended to two curatorial studies classes, and have experience of exhibition design, before graduation. Two samples are familiar with 3dsMax environment and basic uses of it (Samples A and B) and other two are not familiar (Samples C and D).
different galleries, one will be designed with traditional sketching method and the other will be designed with the proposed plug-in system. The number and type of items in the exhibition and the square footage of the galleries were kept same (see appendix B for plans of galleries and object number specifications). After completing the tasks, the length of the design process and the number of collisions, for 10 maximum visitors, in both experiments are recorded.
Findings and Interpretation
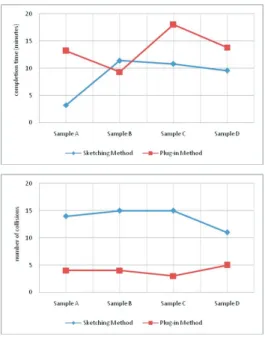
In sketching method, respondents have completed the tasks in shorter times when compared to plug-in method only sample B has completed the task in Plug-in method quicker than the sketchPlug-ing method. Only Sample A and B were familiar with the 3dsMax environment but the results show that unfamiliar Sample D has completed the task in 14:02 minutes whereas Sample A completed the task in 13:20 minutes. The familiarity degree of A and B of 3dsMax was different since B was more experienced in 3d. The result was showed that the 4 minutes difference between A and B is probably because of the amount of familiarity to 3dsmax since sample A has finished the task in sketching method in 3:22 which is more 8 minutes difference between the completion time of sample B. The elongation of the time in plug-in method is also a result of evaluation besides familiarity. Users have conducted many evaluation processes before finishing the process and nearly after every evaluation some changes were made (see Figure 6).
The designs in sketching methods were transferred to plug-in format and evaluated. The main disadvantages of the sketching method are the proportion of objects is not clear and possible circulation of visitors was not really considered. The number of errors in traditional method was more than 10 in all samples which mean nearly half of the objects were placed inappropriately. On the other hand during the plug-in method many evaluations were conducted and this drastically reduced the number of collisions to less than five, which was reasonable because the system cannot always calculate a reliable result, as a result a number of solutions should be conducted. Sample C has spent the most time with the system and resulted in 3 collisions in the plug-in test which as well point out that the most time spent the system will result in less number of mistakes in the layout, since the sketching performances of sample B and sample C are nearly the same.
DISCUSSION, CONCLUSION AND SUGGESTIONS
This paper tries to implement a computational method into interior design process to improve the traditional way of interior designing. The result of the questionnaire and the case study shows positive feedback and results. The respondents of the preliminary user study stated with an average %55,09 that the proposed plug-in will usually help the designer in the design and exhibition design processes. Additionally %78,54 of the respondents stated that this computational method will be most helpful to the user in the design process. All respondents in the case study find the system user friendly and easy to learn, also there were no complaints about 3dsMax or how hard it is to use it. After a session of teaching, the system and 3dsMax basics to users they performed relatively equal performances.
Although there were limitations to this study, like the lack of eligible samples or conducting experiments in imaginary galleries and situations rather than real life situations, the results prove that an interior design aid can be helpful to the to the designer in developing and evaluating the design. With the proposed plug-in the user can test many different layouts rapidly and decide which one suits best to the given situation more efficiently.
In the future research real-time animated visitors will be included to cross check the results of the current evaluation system. It is expected that seeing the behavior of visitors might be more inspiring to the designer in the creation process. Also further improving 3d capabilities of the plug-in, like adding environment creation tools and additional ready-made models of different exhibition objects, might be helpful to the designer in visualizing the exhibition and understand the space better.
This study was conducted as a pilot study to understand if an interior design aid can be adapted to the design process and will it be helpful to the designer by also employing the capabilities of 3d graphics. Based on tests, questionnaires and the comments of several experienced designers, the systems reached its initial goal.
REFERENCES
Ambrose T. & Paine C. (1993). Museum Basics. London: Routledge.
Bitgood, S., Patterson, D., and Benefield, A. (1988). “Exhibit design and visitor behavior: empirical relationship”. Environment and Behavior 20:
474-491.
Bitgood, S. And Loomis, R.J. (1993). “Environmental design and evaluation in museums”. Environment and Behavior 25:683-697.
Bitgood, S. (2002). “Environmental psychology in museums, zoos, and other exhibition centers.” Robert B. Bechtel and Arza Churchman (Eds.)
Handbook of Environmental Psychology. New York : John Wiley & Sons, Inc.,
pp.461-480.
Dean D. (1994). Museum Exhibition: Theory and Practice. London: Routledge. Feurtey, F., Chikayama, T. (2000). Simulating collision avoidance of
pedestrians. Masters Thesis, University of Tokyo.
Helbing D., & Molnar, P. (1997). “Self-Organization Phenomena in Pedestrian Crowds.” In Schweitzer, F. (Ed.), Self-Organizing of Complex
Structures: From Individual to Collective Dynamics. London: Gordon
& Breach, pp. 569-577.
Jun, K., Sung, M.Y., Choi, B. (2006). “Steering behavior model of visitor NPCs in virtual exhibition”. Advances in Artificial Reality and
Tele-Existence: 16th International Conference on Artificial Reality and Telexistence, ICAT 2006, Hangzhou, China. Heidelberg: Springer Berlin.
Mubarak, K. (2004). Case Based Reasoning for Design Composition in
Architecture. Doctoral Dissertation, Carnegie-Mellon University:
Neal A. (1987). Help for the Small Museum: Handbook of Exhibit Ideas and
Methods. New York: Pruett.
Pheasant S. (1996). Body Space: Anthropometry Ergonomics and The Design of
Workspace. London: Taylor & Francis
Reynolds, C. W. (1987). Flocks, Herds and Schoold: A Distributed Behavioural Model. Computer Graphics, 21: 25-34.
Saunders R., Gero, J. S. (2004). Curious Agents and situated Design Evaluations. Artificial Intelligence for Engineering Design, 18: 153-161.
Schön, D. A. (1987). Education the Reflective Practitioner. San Francisco, CA: