ISSN: 1308–9196
Yıl : 11 Sayı : 31 Mart 2019
Yayın Geliş Tarihi: 01.11.2018 Yayına Kabul Tarihi: 06.03.2019 Araştırma Makalesi
DOI Numarası: https://dx.doi.org/10.14520/adyusbd.477571
HEALTH EXPENDITURE, ECONOMIC GROWTH, AND CO2
EMISSIONS: EVIDENCE FROM THE OECD COUNTRIES
Tuncer GÖVDELİ
AbstractThe present study investigates the correlation between health expenditure, economic growth, and CO2 emissions in 26 OECD countries during the period of 1992-2014. First of all, cross-sectional dependence of the variables and the panel was assessed with a view to identify the panel methods usable for this purpose. Given the prevalence of cross-sectional dependence regarding the variables and the panel, the panel unit root and cointegration test was chosen from among second generation tests. The variables were found to be stationary at order I(1). Moreover, the model was found to exhibit a cointegration relationship. In the light of estimations of the cointegration factors, the elasticity coefficients of economic growth and CO2 emissions were predicted to be 0.188 and 0.012 respectively. According to the results of VECM Granger causality analysis, economic growth as well as CO2 emissions are causative with respect to health expenditure, whereas economic growth, once again, is causative with respect to CO2 emissions. A long-term causality analysis, in turn, revealed a direct correlation whereby economic growth and CO2 emissions lead to increased health expenditure.
Keywords: Health expenditure, economic growth, CO2 emission, OECD countries, VECM Granger causality analysis.
Adıyaman Üniversitesi Sosyal Bilimler Enstitüsü Dergisi, Yıl: 11, Sayı: 31, Mart 2019
SAĞLIK HARCAMALARI, EKONOMİK BÜYÜME VE CO
2EMİSYONU: OECD ÜLKELERİNDEN KANITLAR
Öz
Bu çalışmada seçilmiş 26 OECD ülkesinin 1992 ile 2014 dönemi arasında sağlık harcamaları, ekonomik büyüme ve CO2 emisyonu arasındaki ilişkiler araştırılmıştır. Bu amaçla kullanılacak panel yöntemlerini seçebilmek için değişkenlerin ve panelin yatay kesit bağımlılığı belirlenmiştir. Değişkenlerde ve panelde yatay kesit bağımlılığı olması sebebiyle kullanılan panel birim kök ve eşbütünleşme testinin ikinci nesil testlerden seçilmiştir. Değişkenlerin I(1) mertebede durağanlıkları tespit edilmiştir. Ayrıca modelde eşbütünleşme ilişkisi tespit edilmiştir. Eşbütünleşme katsayılarının tahmin sonuçlarına göre ekonomik büyüme ve CO2 emisyonunun esneklik katsayıları sırasıyla 0.188 ve 0.012 olarak tahmin edilmiştir. VECM Granger nedensellik analizi sonuçlarına göre ekonomik büyüme sağlık harcamalarının nedenseli, CO2 emisyonu sağlık harcamalarının nedenseli, ekonomik büyüme CO2 emisyonunun nedenselidir. Uzun dönem nedensellik analizine göre ise ekonomik büyüme ve CO2 emisyonundan sağlık harcamalarına doğru nedensellik ilişkisi tespit edilmiştir.
Anahtar Kelimeler: Sağlık harcamaları, ekonomik büyüme, CO2 emisyonu, OECD ülkeleri, VECM Granger nedensellik analizi.
1. INTRODUCTION
In recent years, the relationship between environmental pollution, economic growth and health expenditure stands out as a popular subject of research in economy literature. The studies covering developed and developing countries can be categorized in three groups. The first study category focuses on the relationship between economic growth and pollutants in the environment, in close association with the testing of the Environmental Kuznets Curve (EKC) hypothesis. According to this hypothesis in reverse U form, during
manufacturing CO2 emissions would grow, leading to environmental pollution
Adıyaman Üniversitesi Sosyal Bilimler Enstitüsü Dergisi, Yıl: 11, Sayı: 31, Mart 2019
environmental awareness levels rise, leading to lower levels of pollution as economic growth progresses further (Grossman and Krueger, 1995). The literature has studies analyzing the variables of economic growth and pollutants affecting the environment (Akbostanci et al., 2009; Coondoo and Dinda, 2002; Lee and Lee, 2009; Bengochea-Morancho and Higon-Tamarit, 2001). The second category involves studies investigating the relationship between health and economic growth (Baltagi and Moscone, 2010; Bakare and Olubokun, 2011; Bhargava et al., 2001). The third category, in turn, is a combination of the first two categories. It can be categorized as studies investigating environmental pollution, economic growth, and health expenditure (Chaabouni et al., 2016; Beatty and Shimshack, 2014; Janke et al., 2009).
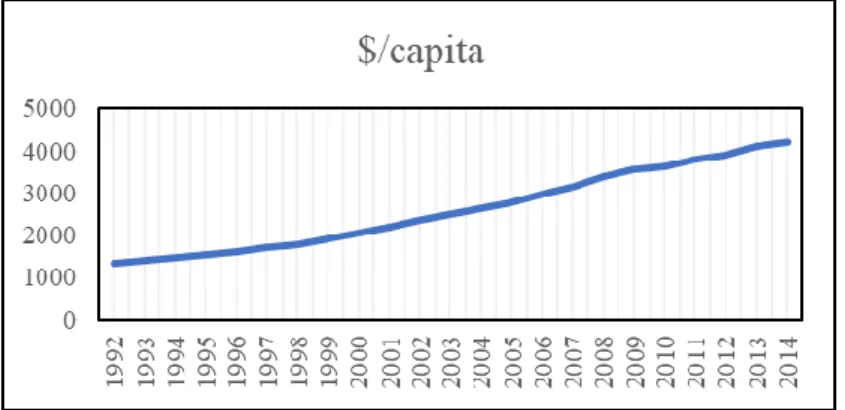
The health expenditure levels of OECD countries vary substantially through time and from one country to another. According to the OECD database, in 1992 the average health expenditure per capita was USD 1307. By 2014, the average health expenditure per capita grew to USD 3675, marking an average annual increase of 7.87%. In 2014, Mexico had the distinction of being the country with the lowest health expenditure level (USD 1021) among all OECD countries. Mexico is followed by Turkey with a health expenditure figure of USD 1043 and Lithuania with a health expenditure figure of USD 1301. The US ranks at the top of the list of health expenditure per capita, with a figure of USD 9028. It is followed by Luxemburg (USD 7118) and Switzerland (USD 7115). Figure 1 presents the average health expenditure per capita of 26 OECD countries. The upwards trend of health expenditure is evident. In 2014, in the US, the share of health expenditure in GDP was 16.5%, which is also the highest such figure in all OECD countries. The second and third ranking countries in this respect were France (11.6%) and Switzerland (11.5%). The economic structure, geographical location, and population of the countries can affect the health expenditure
Adıyaman Üniversitesi Sosyal Bilimler Enstitüsü Dergisi, Yıl: 11, Sayı: 31, Mart 2019
levels. Figure 1 shows that health expenditure per capita had been growing in the period of 1992-2014.
Figure 1. Average Health Expenditure per capita in 26 OECD Countries
(OECD database)
The literature on health expenditure grew from the foundation laid down by Abel-Smith (1967) from the World Health Organization, leading to the conclusion that, once adjustments for inflation, exchange rates and population are made, GDP is an important determinant of health expenditure (Balaji, 2011). Since the studies by Kleiman (1974) and Newhouse (1977), income levels are considered the most important factor accounting for the differences among the countries and the increase in health expenditure (Baltagi and Moscone, 2010). The growth of health expenditure worldwide not only reflects the purpose of economic development, but also indicates rising levels of quality of life for the wider society (Wang, 2011).
The fiscal space of the state serves as a limit to health expenditure. As the fiscal space grows, the governments further their investments into social sectors. A fixed share of the budget has different effects on health expenditure. A fixed share of the budget, in a growing economy, is an effective guarantee of absolute rise in health expenditure. Economic crises or recession, on the other
Adıyaman Üniversitesi Sosyal Bilimler Enstitüsü Dergisi, Yıl: 11, Sayı: 31, Mart 2019
hand, restrict expenditure in health (Ke et al., 2011). Health stands out as one of the most important items on any government’s or private sector’s list of expenditure. Health expenditure is crucial for economic growth expectations to have a direct impact on the welfare of the society.
The purpose of this study is to analyze the effect of CO2 emissions and
economic growth on health expenditure in OECD countries, in the period of 1992-2014. OECD countries were chosen as the object of the study due to the fact that the same set of criteria was used for data collection. The study is
motivated by the will to identify the impact of CO2 emissions, chosen as an
environmental pollutant, on health expenditure. The first chapter of the study focuses on the theoretical background and presents a general state of affairs in OECD countries. The second chapter entails a literature review, and presents the conclusions of the previous studies concerning the core issues discussed herein. The third chapter presents the data, methodology, and application, and provides detailed discussion of the data for selected countries. Furthermore, the methods applied are discussed, along with the interpretation of the conclusions of the application. The application of second generation econometric tests made a concrete contribution to the literature. The last chapter of the study consists of conclusions and political recommendations.
2. LITERATURE REVIEW
The literature review can be discussed in three categories. The first group of
studies investigates the relationship between economic growth and CO2
emissions. Cho et al. (2014) provided an analysis of 22 OECD countries, focusing
on the period of 1971-2000. The conclusion of their study based on CO2
emissions, energy consumption and economic growth series is that the EKC hypothesis is applicable. Sharma (2011) applied panel data analysis on a group of 69 countries. The study focusing on the period of 1985-2005 found that
Adıyaman Üniversitesi Sosyal Bilimler Enstitüsü Dergisi, Yıl: 11, Sayı: 31, Mart 2019
electricity consumption per capita, total primary energy consumption per capita, GDP per capita, and trade deficit concerning energy consumption have
positive effects on CO2 emissions. Galeotti et al. (2006) provides an analysis of
24 OECD countries, covering the period of 1960-1997. The study based on the
variables of CO2 emissions and economic growth found a U-shaped EKC. Cole
(2004) used the variables of CO2, economic growth, and openness in an analysis
of 22 OECD countries in the period of 1980-1997. The study found that EKC hypothesis applies. Martínez-Zarzoso and Maruotti (2011) tested the validity of
the EKC hypothesis for 22 OECD countries, based on CO2 and economic growth
variables. The study investigating the period of 1975-1998 concluded with an N-shaped EKC.
The second category contains studies investigating health expenditure and economic growth. In a study on the case of India, Balaji (2011) focused on the period of 1960-2009, looking for any correlation between health expenditure and economic growth, but ultimately failing to find one. Amiri and Venetelou (2012) provided an empirical analysis of 20 OECD countries, covering the period of 1970-2009. Their findings suggest that the economic growth is causative with regards to the health expenditure in most OECD countries. Wang (2011) provided an analysis of the relationship between health expenditure and economic growth in 31 countries, focusing on the period of 1986-2007, concluding that increased health expenditure has a positive effect on economic growth in the long run. Baltagi and Moscone (2010) analyzed the relationship between health expenditure and economic growth, over a sample containing 20 OECD countries. The conclusion of the study that covered the period of 1971-2004, due to the low coefficient of elasticity involved, health expenditure was found to be an essential service rather than a luxury. In a study covering Malaysia’s data in the period of 1970-2009, Tang (2011) investigated the correlation between health expenditure and economic growth, and found
Adıyaman Üniversitesi Sosyal Bilimler Enstitüsü Dergisi, Yıl: 11, Sayı: 31, Mart 2019
cointegration relationship not to mention long-term causality between the variables.
The third category of studies, on the other hand, is effectively a synthesis of the
first two categories, analyzing health expenditure, economic growth and CO2
emissions. The studies in this category, however, are rather limited in contrast to those in the first two categories. Chaabouni et al. (2016) employed panel data analysis, covering 51 countries over the period of 1995-2013. It was found
that, in general, the panel exhibited two-way causality between CO2 emissions
and economic growth, and between health expenditure and economic growth.
Furthermore, there exists causality from CO2 emissions towards health
expenditure according to other findings of the study. Zaidi and Saidi (2018) investigated the variables of health expenditure, environmental pollution and economic growth in their empirical analysis of Sub-Saharan Africa countries for the period of 1990-2015. Based on the results of ARDL bounds testing, the existence of a positive effect on economic growth was underlined whereas a negative long-term effect of environment pollutants on health expenditure was identified. On the causality front, that study found that health expenditure is among the causes of economic growth, and a two-way causality exists between
health expenditure and CO2 emission levels. Ghorashi and Rad (2017)
investigated the case of Iran for the period of 1972-2012, with a focus on the
variables of CO2 emissions, health expenditure and economic growth. Their
analyses led to the identification of a two-way causal link between CO2
emissions and economic growth. Furthermore, health expenditure is found to be the cause of economic growth.
3. DATA, METHODOLOGY AND APPLICATION
The empirical analyses presented in this empirical study are based on annual data covering the period of 1992-2014. The variables focused on in this current
Adıyaman Üniversitesi Sosyal Bilimler Enstitüsü Dergisi, Yıl: 11, Sayı: 31, Mart 2019
study, covering 26 OECD countries* are health expenditure (HE), economic
growth (GDP), and CO2 emissions. Health expenditure is stated in USD/capita,
based on data from the OECD database. Economic growth data are also stated
in USD/capita, based on World Bank’s figures. CO2 emissions are presented in
metric tons/capita, again based on World Bank’s figures.
(1) The model employed in the study is presented in equation 1. The natural logarithm of all variables was taken into account and added to the model.
3.1. Cross-sectional Dependence Tests
The unit root and cointegration tests to be employed can be chosen based on the results of cross-sectional dependence tests. If a lack of cross-sectional dependence in panel data exists, first generation panel unit root tests may be applied. However, in case panel data exhibit cross-sectional dependence, the use of second generation unit root tests allows for more effective and stronger estimations.
The methods used to identify cross-sectional dependence are the
Breusch-Pagan (1980) CDLM1 test, Pesaran et al. (2004) CDLM2 test, and Pesaran et al.
(2004) CDLM3 test. The hypotheses of the tests: H0: There is no cross-sectional
dependence, and H1: Cross-sectional dependence exists.
When Breusch-Pagan (1980) CDLM1 test, Pesaran et al. (2004) CDLM2 test, and
Pesaran et al. (2004) CDLM3 test produce results with a probability smaller than
* “Australia, Austria, Belgium, Canada, Czech Republic, Denmark, Finland, France, Germany, Greece, Iceland, Ireland, Italy, Japan, Korea, Netherlands, New Zealand, Norway, Poland, Portugal, Spain, Sweden, Switzerland, Turkey, United Kingdom, United States.”
Adıyaman Üniversitesi Sosyal Bilimler Enstitüsü Dergisi, Yıl: 11, Sayı: 31, Mart 2019
0.05, H0 is rejected at 5% significance level, concluding that cross sectional
dependence exists among the units comprising the panel.
(2)
: shows the estimated cross-sectional correlations between residual sets.
There is no cross-sectional dependence under the hypothesis H0. Under the
hypothesis H0, N is fixed while T → ∞. The statistics exhibit N(N-1)/2 degrees of
freedom, and Chi-squared asymptomatic distribution. CDLM1 test leads to
better results in cases where the value of the time axis is larger than that of the cross-sectional axis (T>N).
(3)
CDLM2 statistics exhibit a standard normal distribution under Pesaran (2004), H0
hypothesis, where T → ∞ and N → ∞. CDLM2 test leads to better results in
cases where the value of the time axis is larger than that of the cross-sectional axis (T>N).
(4)
CDLM3 statistics exhibit a standard normal distribution under Pesaran (2004), H0
hypothesis, where T → ∞ and N → ∞. CDLM3 test leads to better results in
cases where the value of the cross-sectional axis is larger than that of the time axis (N>T).
Adıyaman Üniversitesi Sosyal Bilimler Enstitüsü Dergisi, Yıl: 11, Sayı: 31, Mart 2019
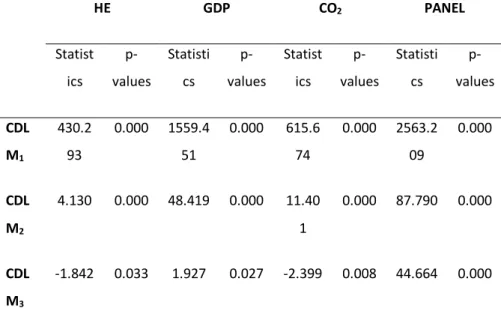
Tablo 1. Results of the Cross-sectional Dependence Tests
HE GDP CO2 PANEL Statist ics p-values Statisti cs p-values Statist ics p-values Statisti cs p-values CDL M1 430.2 93 0.000 1559.4 51 0.000 615.6 74 0.000 2563.2 09 0.000 CDL M2 4.130 0.000 48.419 0.000 11.40 1 0.000 87.790 0.000 CDL M3 -1.842 0.033 1.927 0.027 -2.399 0.008 44.664 0.000
Table 1 presents the results of the cross-sectional dependence tests for individual cases and for the whole panel. According to the results of the cross-sectional test for individual cases, the null hypothesis was rejected for HE, GDP
and CO2 variables, finding cross-sectional dependence. Therefore, the unit root
tests required to be employed for the variables should be second generation tests. In the light of the results of the tests for the panel, the null hypothesis was rejected in all three methods, finding instead cross-sectional dependence. Therefore, the cointegration test to be employed should, again, be one of the second generation tests.
Adıyaman Üniversitesi Sosyal Bilimler Enstitüsü Dergisi, Yıl: 11, Sayı: 31, Mart 2019
3.2. Panel Unit Root Test
The study employed the CADF panel unit root test developed by Pesaran (2007) with respect to the cross-sectional dependence.
In order to analyze the unit root regarding time series data, the heterogeneous panel unit root test developed by Im, Pesaran and Shin (IPS) (2003) can be employed. This test is based on extended Dickey-Fuller (ADF) regression.
(5)
In this context, ki represents lag length, zit reflects significant terms and pi
stands for section-specific primary autoregressive parameters.
The standard IPS test can lead to false inferences in the case of external economies or shocks. That is why the cross-sectional extended IPS test recommended by Pesaran (2007) should be used. This test refers to an ADF regression extended by the cross-sectional averages of lagged levels and the first-differences of the individual series (Herzer, 2016). In this context, the cross-sectional extended ADF (CADF) regression;
(6)
Here refers to the cross-sectional average of , and .
The arithmetic mean of the CADF statistics calculated for each section is calculated to determine the existence of unit root for the wider panel.
Adıyaman Üniversitesi Sosyal Bilimler Enstitüsü Dergisi, Yıl: 11, Sayı: 31, Mart 2019
Here, refers to the OLS t-rate of in equation 11. The critical value is
compared against the table values provided by Pesaran (2007).
Table 2. Results of the Panel Unit Root Tests
HE GDP CO2 ΔHE ΔGDP ΔCO2
Statistic Statistic Statistic Statistic Statistic Statistic
CIPS -2.14 -1.83 -2.08 -3.12* -2.65* -3.56*
Note: The critical table values for CIPS for N=26 T=23 is -2.32 at 1% and for fixed
values on p. 280 IIb. The maximum lag length is set as 3, while the optimal lag lengths were established based on Schwarz information criterion. *, refers to significance level at 1%.
The unit root test results for the variables are presented in Table 2. The null hypothesis, that is the variables have unit root, cannot be rejected at the values
of HE, GDP and CO2 variables. That is why the variables have unit root at I(0).
Once the difference for the variables were established, the I(1) null hypothesis was rejected at the first order, finding a stable state.
3.3. Testing the Homogeneity of Cointegration Factors
Swamy (1970) determined the homogeneity of the slope coefficients in cointegration equations. Pesaran and Yamagata (2008), in turn, contributed to the literature through a development of Swamy’s test. In this test;
(8)
In such a general cointegration equation, slope coefficients are analyzed to
Adıyaman Üniversitesi Sosyal Bilimler Enstitüsü Dergisi, Yıl: 11, Sayı: 31, Mart 2019
are; Slope coefficients are homogenous and Slope
coefficients are heterogeneous.
The panel is estimated first through the OLS (Ordinary Least Squares) and then through Weighted Fixed Effect Model, to produce the required testing statistics. Pesaran and Yamagata (2008) developed two distinct testing statistics to try on the hypotheses:
For larger samples: (9)
For smaller samples: (10)
Here, N refers to the number of cross sections, S refers to Swamy test statistics, k refers to the number of explanatory variables, and Var(t,k) refers to the
standard error. When the probability is found to be less than 0.05, H0
hypothesis is rejected at a significance level of 5%, and thus H1 hypothesis is
accepted. Therefore, the cointegration factors are found to be non-homogenous (Pesaran and Yamagata, 2008).
Table 3. Homogeneity Results of Cointegration Factors
Statistic p-value
15.582 0.000
Adıyaman Üniversitesi Sosyal Bilimler Enstitüsü Dergisi, Yıl: 11, Sayı: 31, Mart 2019
The homogeneity results of cointegration factors are presented in Table 3. According to the results in Table 3, the null hypothesis, which states that the slope coefficients of cointegration factors are homogeneous, is rejected. Thus, the slope coefficients are found to be heterogeneous.
3.4. Durbin-Hausmanausman Panel Cointegration Test
The cointegration relationship is analyzed through the Durbin-Hausmanausman panel cointegration test developed by Westerlund (2008). Durbin-Hausman cointegration test allows panel cointegration analyses in case the independent variables are I(1) or I(0), provided that the dependent variable is l(1). Furthermore, the test takes the common factors into account (Westerlund, 2008).
With Durbin-Hausman method, Westerlund (2008) investigated the existence of the cointegration relationship using two distinct tests. The first of these is the Durbin-Hausman group test, while the second is the Durbin-Hausman panel test. With the Durbin-Hausman group test, Westerlund (2008) allows for the variance of the autoregressive parameter from one section to another. This test
does not entail cointegration for hypothesis H0. For the alternative hypothesis,
on the other hand, it expresses the existence of the cointegration relationship for at least some of the sections. For the Westerlund (2008) Durbin-Hausman panel test, the autoregressive parameter is assumed to be the same for all
sections. No cointegration occurs with hypothesis H0. The alternative
hypothesis, on the other hand, signifies the existence of cointegration relationship throughout the panel.
The Durbin-Hausman tests are estimated using the following formula:
Adıyaman Üniversitesi Sosyal Bilimler Enstitüsü Dergisi, Yıl: 11, Sayı: 31, Mart 2019
. (12)
The Durbin-Hausman group statistics refer to test results being checked if cross-sections are heterogeneous. The Durbin-Hausman panel statistics, on the other hand, apply in case the cross-sections are homogeneous.
Table 4. Durbin-Hausman Panel Cointegration Test
Statistic Statistic p-value
Durbin-Hausman Group Statistics -1.802** 0.036
Durbin-Hausman Panel Statistics -2.648* 0.004
Note: ** and * refer to 5% and 1% significance levels, respectively.
The results of Durbin-Hausman Panel cointegration test are presented in Table 4. The null hypothesis for the Hausman group statistics and the Durbin-Hausman panel statistics rules that there is no cointegration. According to the results in Table 4, the null hypothesis is rejected with both tests, leading to the conclusion that cointegration exists.
3.5. Estimation of Long-Term Cointegration Factors
Once a cointegration relationship between the series is determined, long-term individual cointegration factors were estimated using Pesaran’s (2006) Common Correlated Effect (CCE) method, taking cross-sectional dependence into account. The CCE method is an estimator that can produce consistent and asymptotic normal distribution even in the case the time axis is smaller or larger than the section axis (Pesaran, 2006). The stages of this test are as follows:
Adıyaman Üniversitesi Sosyal Bilimler Enstitüsü Dergisi, Yıl: 11, Sayı: 31, Mart 2019
, ; (13)
On the basis of the equation yi associated with the linear heterogeneous panel
data model;
(14)
Above represents observable common effects, while represents
unobservable common effects.
Model is sustained through the conversion
(15)
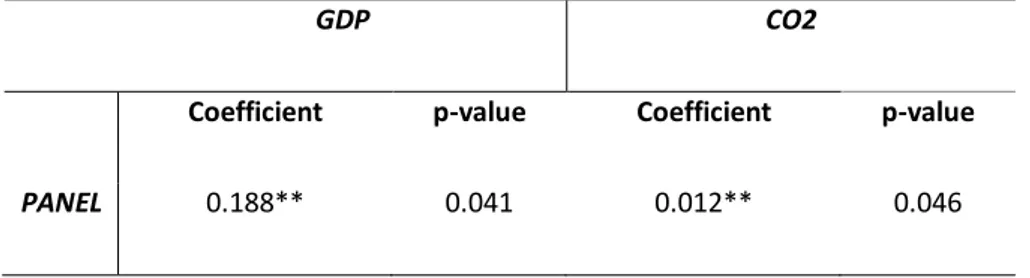
Table 5. Estimation of Long-Term Cointegration Factors
GDP CO2
Coefficient p-value Coefficient p-value
PANEL 0.188** 0.041 0.012** 0.046
Note: ** refers to 5% significance level.
Table 5 presents the results of the estimation of long-term cointegration factors. The elasticity coefficient of economic growth is, expectedly, positive
and significant at 5%. The elasticity coefficient for CO2 emission is calculated to
be 0.012. CO2 emission’s elasticity coefficient which is positive and significant at
5% can be interpreted to the effect that increase in CO2 emissions will lead to
higher health expenditure, and environmental pollution will have a negative effect on health.
Adıyaman Üniversitesi Sosyal Bilimler Enstitüsü Dergisi, Yıl: 11, Sayı: 31, Mart 2019
3.6. PANEL CAUSALITY ANALYSIS
As the cointegration analysis cannot determine the direction of causality, performance of an additional causality analysis would help increase the significance of the analysis results. According to Engle and Granger (1987), the findings reached through the causality test based on a vector auto regression (VAR) model with reference to the first difference could be misleading in the case cointegration exists with the variable. To overcome this problem, the vector error correction model (VECM) entails estimation using the VAR model, by increasing a lagged error correction term. To analyze the causality relationships in panel data, the VECM model can be formulated as follows (Nazlioglu and Soytas, 2012).
(16)
(17)
(18)
Here k refers to optimal lag length; and refers to the residue from the panel
FMOLS estimation of equation 1. This model enables both short- and long-term estimations with respect to Granger causality analysis.
Table 6. VECM Granger Causality Test Results
Adıyaman Üniversitesi Sosyal Bilimler Enstitüsü Dergisi, Yıl: 11, Sayı: 31, Mart 2019
Variable value) ECTt-1 causality
SH - 13.417(0. 003) 26.154(0. 000) -0.022(-0.015) GDP-SH; CO2-SH GDP 0.997(0. 801) - 5.642(0.1 03) 0.427(0.032) CO2 2.794(0. 424) 6.257(0.0 99) - 0.002(0.023) GDP-CO2
Note: ** and * refer to 5% and 1% significance levels, respectively.
The VECM Granger causality analysis can help estimate both short- and long-term causality relationship between the variables. Table 6 presents the results of the VECM Granger causality test. In light of short-term causality test results, the hypothesis that ‘economic growth is not a cause of health expenditure’ was rejected. Therefore, economic growth is understood to be a cause of health
expenditure. Moreover, the null hypothesis ‘CO2 emission is not the cause of
health expenditure’ was also rejected, leading to the conclusion that CO2
emission is a cause of health expenditure. The hypothesis ‘economic growth is
not the cause of CO2 emission’ was rejected, finding that economic growth is
Adıyaman Üniversitesi Sosyal Bilimler Enstitüsü Dergisi, Yıl: 11, Sayı: 31, Mart 2019
Figure 1. VECM Granger Causality Relationship
A long-term causality analysis revealed a direct correlation whereby economic
growth and CO2 emissions lead to increased health expenditure. The fact that
the ECT factor is negative suggests that the deviations will fall, and thus equilibrium will be achieved in the long term.
4. CONCLUSION and DISCUSSION
This study investigated the long-term relationship between health expenditure,
economic growth and CO2 emissions in OECD countries, as well as the causality
between the variables. To enable this research, first of all the cross-sectional dependence of the variables and the panel was analyzed. As the cross-sectional dependence existed with the variables used and the panel, it is understood that the unit root and cointegration tests to be employed in the study should be second generation tests. According to the results of the unit root test, the variables were found to be stationary at the first order I(1). The cointegration factors were found to be heterogeneous, followed by the cointegration test itself. Cointegration relationship was found between the variables. Then, the elasticity coefficients of the variables were estimated. The results exhibit
Adıyaman Üniversitesi Sosyal Bilimler Enstitüsü Dergisi, Yıl: 11, Sayı: 31, Mart 2019
emissions. Among the leading factors contributing to health expenditure, economic growth definitely leads to increases in health expenditure. Given the
positive elasticity coefficient of CO2 emission, environmental pollution would
increase health expenditure, having a negative effect upon health.
Policy-makers would be wise to take political measures to curb CO2 emissions which
would increase health expenditure.
The final stage of the empirical analysis employed the VECM Granger causality test, investigating causality relationship between the variables. According to
short-term causality analysis, economic growth as well as CO2 emissions are
causative with respect to health expenditure, whereas economic growth, once
again, is causative with respect to CO2 emissions. A long-term causality analysis,
in turn, revealed a direct correlation whereby economic growth and CO2
emissions lead to increased health expenditure.
As the wealth levels of countries increase, their health expenditure increases as well. Policy-makers should be aware whether increased health expenditure alone is sufficient to ensure social welfare. The income of the countries is not the sole factor explaining health expenditure. The overall health expenditure levels can vary substantially even among countries with comparable income levels. Low-income countries with health expenditure levels lagging well behind what the society needs, should dedicate more resources for this sector. For a large portion of OECD countries, health expenditure levels are arguably sufficient to meet the needs of the society.
In addition to GDP and CO2 as a factor determining the health expenditure
levels of the countries, should also be addressed by the policy-makers. In more recent times, the countries neglected the environment for the sake of rapid economic growth. This attitude brought about major problems. Irresponsible pollution marring the environment led to significant health issues. The
Adıyaman Üniversitesi Sosyal Bilimler Enstitüsü Dergisi, Yıl: 11, Sayı: 31, Mart 2019
governments should implement policies to further economic growth, in tandem with policies to protect the environment. With a direct influence on health expenditure levels, environmental pollution can have consequences on economic growth itself as well. When setting long-term policies, this factor should also be taken into account. Renewable energy ranks at the top of the list of options the policy-makers should consider in terms of reducing impact on
environment. Thanks to new technologies, CO2 emissions will be reduced
substantially. Government policies to facilitate investments in such technologies will help reduce environmental pollution. Another issue the policy-makers should take into account is the need to raise awareness among the wider public
about CO2 emissions. Doing so would improve not only the health levels, but
also the welfare of the society.
REFERENCES
Abel-Smith, B. (1967). “An International Study of Health Expenditure.” World Health Organisation (Public Health Papers No. 32), Geneva.
Akbostancı, E., Türüt-Aşık, S., ve Tunç, G. İ. (2009). “The relationship between income and environment in Turkey: is there an environmental Kuznets curve?”. Energy policy, 37(3):861-867.
Amiri, A., ve Ventelou, B. (2012). “Granger causality between total expenditure on health and GDP in OECD: Evidence from the Toda–Yamamoto approach”. Economics Letters, 116(3):541-544.
Bakare, A. A. ve Olubokun, S. (2011). “Health care expenditure and economic growth in Nigeria: An empirical study”. Journal of Emerging Trends in
Adıyaman Üniversitesi Sosyal Bilimler Enstitüsü Dergisi, Yıl: 11, Sayı: 31, Mart 2019
Balaji, B. (2011). “Causal nexus between public health expenditure and economic growth in four southern Indian states”. IUP Journal of Public
Finance, 9(3):7-22.
Baltagi, B. H. ve Moscone, F. (2010). “Health care expenditure and income in the OECD reconsidered: Evidence from panel data”. Economic
modelling, 27(4):804-811.
Baltagi, B. H. ve Moscone, F. (2010). “Health care expenditure and income in the OECD reconsidered: Evidence from panel data.” Economic
modelling, 27(4):804-811.
Beatty, T. K. ve Shimshack, J. P. (2014). “Air pollution and children's respiratory health: A cohort analysis.” Journal of Environmental Economics and
Management, 67(1):39-57.
Bengochea-Morancho, A., Higon-Tamarit, F., & Martínez-Zarzoso, I. (2001). “Economic growth and CO2 emissions in the European Union”.
Environmental and Resource Economics, 19(2):165-172.
Breusch, T. S. ve Pagan, A. R. (1980). “The Lagrange multiplier test and its applications to model specification in econometrics”. The Review of
Economic Studies, 47(1):239-253.
Chaabouni, S., Zghidi, N., ve Mbarek, M. B. (2016). “On the causal dynamics between CO2 emissions, health expenditures and economic growth.”
Sustainable cities and society, 22:184-191.
Cho, C. H., Chu, Y. P. ve Yang, H. Y. (2014). “An environment Kuznets curve for GHG emissions: a panel cointegration analysis”. Energy Sources, Part B:
Adıyaman Üniversitesi Sosyal Bilimler Enstitüsü Dergisi, Yıl: 11, Sayı: 31, Mart 2019
Cole, M. A. (2004). “Trade, the pollution haven hypothesis and the environmental Kuznets curve: examining the linkages”. Ecological
economics, 48 (1): 71-81.
Coondoo, D. ve Dinda, S. (2002). “Causality between income and emission: a country group-specific econometric analysis”. Ecological Economics, 40 (3): 351-367.
Engle, R. F., & Granger, C. W. (1987). “Co-integration and error correction: representation, estimation, and testing.” Econometrica: journal of the
Econometric Society, 251-276.
Galeotti, M., Lanza, A., & Pauli, F. (2006). “Reassessing the environmental Kuznets curve for CO2 emissions: A robustness exercise”. Ecological
economics, 57(1):152-163.
Ghorashi, N. ve Rad, A. A. (2017). “CO2 Emissions, Health Expenditures and
Economic Growth in Iran: Application of Dynamic Simultaneous Equation Models”. Journal of Community Health Research, 6(2):109-116.
Grossman, G. M. ve Krueger, A. B. (1995). “Economic growth and the environment”. The quarterly journal of economics, 110(2):353-377. Herzer, D. (2016). “Unions and Income Inequality: A Heterogeneous Panel
Co‐integration and Causality Analysis”. Labour, 30 (3):318-346.
Im, K. S., Pesaran, M. H. ve Shin, Y. (2003). “Testing for unit roots in heterogeneous panels”. Journal of econometrics, 115(1):53-74.
Adıyaman Üniversitesi Sosyal Bilimler Enstitüsü Dergisi, Yıl: 11, Sayı: 31, Mart 2019
Janke, K., Propper, C. ve Henderson, J. (2009). “Do current levels of air pollution kill? The impact of air pollution on population mortality in England”.
Health economics, 18(9):1031-1055.
Kais, S. & Saida, Z. (2018). “Environmental pollution, Health expenditure and Economic growth and in the Sub-Saharan Africa countries: Panel ARDL approach”. Sustainable Cities and Society, 41:833-840.
Ke, X., Saksena, P. ve Holly, A. (2011). “The determinants of health expenditure: a country-level panel data analysis.” Geneva: World Health Organization, 26.
Kleiman, E. (1974). “The determinants of national outlay on health. In The economics of health and medical care (pp. 66-88).” Palgrave Macmillan, London.
Lee, C. C., & Lee, J. D. (2009). “Income and CO2 emissions: evidence from panel
unit root and cointegration tests”. Energy policy, 37(2):413-423.
Martínez-Zarzoso, I. ve Maruotti, A. (2011). “The impact of urbanization on CO2
emissions: evidence from developing countries”. Ecological Economics, 70(7):1344-1353.
Nazlioglu, S., & Soytas, U. (2012). “Oil price, agricultural commodity prices, and the dollar: A panel cointegration and causality analysis”. Energy
Economics, 34(4):1098-1104.
Newhouse, J. P. (1977). “Medical-care expenditure: a cross-national survey”.
Adıyaman Üniversitesi Sosyal Bilimler Enstitüsü Dergisi, Yıl: 11, Sayı: 31, Mart 2019
Pesaran, M. H. (2004). “General Diagnostic Tests for Cross Section Dependence in Panels.” Cambridge Working Papers in Economics no. 435. University of Cambridge.
Pesaran, M. H. (2006). “Estimation and inference in large heterogeneous panels with a multifactor error structure”. Econometrica, 74(4):967-1012. Pesaran, M. H. (2007). “A simple panel unit root test in the presence of
cross‐section dependence”. Journal of applied econometrics, 22(2):265-312.
Pesaran, M. H., ve Yamagata, T. (2008). “Testing slope homogeneity in large panels”. Journal of Econometrics, 142(1):50-93.
Sharma, S. S. (2011). “Determinants of carbon dioxide emissions: empirical evidence from 69 countries”. Applied Energy, 88(1):376-382.
Swamy, P. A. (1970). “Efficient inference in a random coefficient regression model”. Econometrica: Journal of the Econometric Society, 311-323. Tang, C. F. (2011). “Multivariate granger causality and the dynamic relationship
between health care spending, income and relative price of health care in Malaysia.” Hitotsubashi Journal of Economics, 199-214.
Wang, K. M. (2011). “Health care expenditure and economic growth: Quantile panel-type analysis.” Economic Modelling, 28(4):1536-1549.
Westerlund, J. (2008). “Panel cointegration tests of the Fisher effect”. Journal of
Adıyaman Üniversitesi Sosyal Bilimler Enstitüsü Dergisi, Yıl: 11, Sayı: 31, Mart 2019
GENLEŞTİRİLMİŞ ÖZET Giriş
Çevre kirliliği, ekonomik büyüme ve sağlık harcamaları arasındaki ilişki son zamanlarda ekonomi literatüründe araştırılmaya başlanmıştır. Gelişmiş ve gelişmekte olan ülkeleri kapsayan çalışmaları üç kategoriye ayırabiliriz. Birinci kategoride ekonomik büyüme ile çevre kirleticileri bağlantısına odaklanan çalışmalar Çevresel Kuznets Eğrisi (EKK) hipotezinin test edilmesiyle yakından
ilişkili olmuştur. Ters U şeklinde olan bu hipoteze göre üretim süresince CO2
emisyonunun artacağı, ekonomik büyüme arttıkça çevresel kirlenmeye yol açacağı yönündedir. Ekonomik büyümenin belli bir aşamasından sonra toplumun bilinçlenerek çevre kirlenmesinin önüne geçme eğiliminde olacağı, ekonomik büyüme arttıkça çevresel kirlenme azalacaktır (Grossman ve Krueger, 1995). Ekonomik büyüme ve çevresel kirleticiler değişkenlerini alarak analiz yapılan çalışmalar literatürde mevcuttur (Akbostanci vd., 2009; Coondoo ve Dinda, 2002; Lee ve Lee, 2009; Bengochea-Morancho ve Higon-Tamarit, 2001). İkinci kategoride, sağlık ile ekonomik büyümeyi inceleyen çalışmalardır (Baltagi ve Moscone, 2010; Bakare ve Olubokun, 2011; Bhargava vd., 2001). Üçüncü kategori ise ilk iki kategorinin birleşimidir. Çevre kirliliği, ekonomik büyüme ve sağlık harcamalarını inceleyen çalışmalar olarak kategorize edilebilir (Chaabouni vd., 2016; Beatty ve Shimshack, 2014; Janke vd. 2009).
Metot
Bu ampirik çalışmada sunulan ampirik analizlerde, 1992 ile 2014 dönemini kapsayan yıllık veriler kullanılmıştır. 26 OECD ülkesi ele alınan çalışmada
kullanılan değişkenler; sağlık harcamaları (HE), ekonomik büyüme (GDP) ve CO2
emisyonudur. Sağlık harcamaları verileri US dollars/capita cinsindendir ve OECD veri tabanından alınmıştır. Ekonomik büyüme verileri US dollars/capita
cinsindendir ve World Bank veri tabanından alınmıştır. CO2 emisyonu verileri
metric tons/capita cinsindendir ve World Bank veri tabanından alınmıştır. Yatay kesit bağımlılığı testi sonuçlarına göre seçilecek birim kök ve eşbütünleşme testleri belirlenebilmektedir. Panel verilerinde yatay kesit bağımlılığı yoksa birinci nesil panel birim kök testleri kullanılabilir. Ancak panel verilerinde yatay kesit bağımlılığı varsa ikinci nesil panel birim kök testleri kullanılması daha etkin ve güçlü tahminleme yapılmasına olanak sağlamaktadır. Çalışmada, Pesaran (2007) tarafından geliştirilen yatay kesit bağımlılığı altında CADF panel birim kök testi kullanılmıştır. Swamy (1970) yaptığı çalışmada, eşbütünleşme denklemlerindeki eğim katsayılarının homojenliğini belirlemiştir. Pesaran ve Yamagata (2008) ise Swamy testini geliştirerek literatüre
Adıyaman Üniversitesi Sosyal Bilimler Enstitüsü Dergisi, Yıl: 11, Sayı: 31, Mart 2019
sunmuşlardır. Eşbütünleşme ilişkisi Westerlund (2008) tarafından geliştirilen Hausmanausman panel eşbütünleşme testi ile analiz edilmiştir. Durbin-Hausman eşbütünleşme testi, bağımlı değişken I(1) olması koşuluyla, bağımsız değişkenlerin I(1) veya I(0) olması durumunda panel eşbütünleşme analizi yapılmasına imkan sağlanmakta ve ortak faktörleri dikkate almaktadır (Westerlund, 2008).
Seriler arasında eşbütünleşme ilişkisi tespit edildikten sonra uzun dönem bireysel eşbütünleşme katsayıları yatay kesit bağımlılığını göz önünde bulunduran Ortak İlişkili Etkiler (Common Correlated Effect - CCE) yöntemiyle Pesaran (2006) tahmin edilmiştir. CCE yöntemi, zaman boyutunun kesit boyutundan küçük veya büyük olması durumunda dahi tutarlı ve asimtotik normal dağılım gösteren sonuçlar üretebilen bir tahmincidir (Pesaran, 2006). Eşbütünleşme analizi nedenselliğin yönünü belirleyemediğinden nedensellik analizinin de yapılması analiz sonuçlarını daha da anlamlı hale getirecektir. Engle ve Granger (1987)’e göre birinci farkındaki bir vector auto regression (VAR) modeline dayanan nedensellik testinden elde edilen bulgular, değişken arasında eşbütünleşme ilişkisi varsa yanıltıcı olabilecektir. Bu problemi aşmak için, vector error correction modeli (VECM) bir gecikmeli hata düzeltme terimini artırarak VAR modeli ile tahmin etmektir
Bulgular
Bireysel yatay kesit test sonuçlarına göre HE, GDP ve CO2 değişkenlerinde sıfır
hipotezi reddedilerek yatay kesit bağımlılığı olduğu tespit edilmiştir. Buna göre, değişkenler için kullanılması gereken birim kök testlerin ikinci nesil olması gerekmektedir. Panel için yapılan test sonuçlarına göre üç yöntemde de sıfır hipotezi reddedilerek yatay kesit bağımlılığı tespit edilmiştir. Bu nedenle kullanılacak eşbütünleşme testinin ikinci nesil testlerden olması gerekmektedir.
HE, GDP ve CO2 değişkenlerinin seviyesinde sıfır hipotezi olan değişkenler birim
köklüdür hipotezi reddedilememiştir. Bu nedenle değişkenler I(0)’da birim köklüdür. Değişkenlerin farkının alınmasıyla birinci mertebede I(1) sıfır hipotezi reddedilerek durağan hale geldiği tespit edilmiştir.
Eşbütünleşme katsayılarının homojenite analizine göre sıfır hipotez olan
eşbütünleşme katsayılarının eğim katsayıları homojendir hipotezi
reddedilmektedir. Böylece eğim katsayılarının heterojen olduğu tespit edilmiştir. Durbin-Hausman grup istatistiği ve Durbin-Hausman panel istatistiğinde sıfır hipotezi eşbütünleşme yoktur şeklindedir. Her iki testte de sıfır hipotezi reddedilmiştir ve eşbütünleşmenin olduğu sonucuna ulaşılmıştır.
Adıyaman Üniversitesi Sosyal Bilimler Enstitüsü Dergisi, Yıl: 11, Sayı: 31, Mart 2019
Uzun dönem eşbütünleşme katsayılarının tahmin sonuçlarına göre ekonomik büyümenin esneklik katsayısı beklenildiği gibi pozitif ve %5 düzeyinde
anlamlıdır. CO2 emisyonu esneklik katsayısı 0.012 olarak bulunmuştur. Pozitif ve
%5 düzeyinde anlamlı olan CO2 emisyonu esneklik katsayısı, CO2 emisyonu
arttıkça sağlık harcamalarını artıracağı, çevre kirlenmesinin sağlık üzerinde olumsuz etki bırakacağı şeklinde yorumlanabilir.
Kısa dönem nedensellik sonuçlarına göre; ekonomik büyüme sağlık harcamalarının nedenseli değildir hipotezi reddedilmiştir, bu nedenle ekonomik büyüme sağlık harcamalarının nedenseli olduğu sonucuna ulaşılmıştır. Ayrıca
CO2 emisyonu sağlık harcamalarının nedenseli değildir olan sıfır hipotezi de
reddedilerek CO2 emisyonu sağlık harcamalarının nedenseli olduğu sonucuna
ulaşılmıştır. Ekonomik büyüme CO2 emisyonunun nedenseli değildir hipotezi
reddedilmiştir ve ekonomik büyüme CO2 emisyonunun nedenseli olduğu tespit
edilmiştir.
Sonuç ve Öneriler
Bu çalışma, OECD ülkelerindeki sağlık harcamaları ile ekonomik büyüme ve emisyonu arasındaki uzun dönemli ilişki ve değişkenler arasındaki nedensellik ilişkisi araştırılmıştır. Bu amaçla öncelikle değişkenlerin ve panelin yatay kesit bağımlılığı analiz edilmiştir. Kullanılan değişkenlerde ve panelde yatay kesit bağımlılığı olmasından dolayı çalışmada kullanılması gereken birim kök ve eşbütünleşme testlerinin ikinci nesil testlerden olması gerektiği kanısına ulaşılmıştır. Birim kök testi sonucuna göre değişkenlerin birinci mertebede I(1) durağan oldukları tespit edilmiştir. Eşbütünleşme katsayılarının heterojen olduğu belirlenerek eşbütünleşme testine geçilmiştir. Değişkenler arasında eşbütünleşme ilişkisi tespit edilmiştir. Değişkenlerin esneklik katsayıları tahmin
edilmiştir ve sonuçlarda ekonomik büyüme ve CO2 emisyonunun esneklik
katsayıları pozitif ve anlamlıdır. Sağlık harcamalarını artıran en önemli
faktörlerden olan ekonomik büyüme sağlık harcamalarını artırmaktadır. CO2
emisyonunun esneklik katsayısının pozitif olması, çevre kirlenmesinin sağlık harcamalarını artıracağı, sağlık üzerinde negatif etkiye sahip olduğunu
göstermektedir. Sağlık harcamalarını artıran CO2 emisyonunu politika yapıcılar
tarafından azaltacak politik önlemler alınması gerekmektedir.
Ampirik analizin son aşamasında VECM Granger nedensellik testi kullanılarak değişkenler arasında nedensellik ilişkisi araştırılmıştır. Kısa dönem nedensellik
sonuçlarına göre ekonomik büyüme sağlık harcamalarının nedenseli, CO2
emisyonu sağlık harcamalarının nedenseli, ekonomik büyüme CO2 emisyonunun
nedenselidir. Uzun dönem nedensellik analizine göre ise , ekonomik büyüme ve
CO2 emisyonundan sağlık harcamalarına doğru nedensellik ilişkisi tespit
Adıyaman Üniversitesi Sosyal Bilimler Enstitüsü Dergisi, Yıl: 11, Sayı: 31, Mart 2019
Ülkelerin zenginlik seviyesi arttıkça sağlık harcamaları artmaktadır. Politika yapıcıların artan sağlık harcamalarının toplum refahı için yeterli bir artış olup olmadığını bilmesi gerekmektedir. Ülkelerin geliri sağlık harcamalarını açıklamada tek faktör değildir. Gelir seviyesi benzer ülkeler arasında sağlık harcaması toplamı çok farklı sonuçlar olabilmektedir. Sağlık harcamaları toplumun gereksiniminin çok altında olan düşük gelirli ülkelerin bu sektöre daha fazla kaynak sağlaması gerekmektedir. OECD ülkelerinin büyük bir kısmı için sağlık harcamaları toplumun gereksinimini büyük oranda karşılayabildiği söylenebilir.
Ülkelerin sağlık harcamalarını, GDP ile birlikte belirleyen CO2 emisyonu politika
yapıcılar tarafından irdelenmesi gereken bir konudur. Yakın geçmişte ülkelerin ekonomik büyüme için çevreyi fazla önemsememesi, pek çok olumsuz sonuçlar doğurmuştur. Çevrenin bilinçsizce kirletilmesi önemli sağlık sorunlarına yol açmıştır. Hükümetlerin ekonomik büyümeyi artırma politikaları ile birlikte çevreyi koruma politikaları beraber yürütülmesi gerekmektedir. Sağlık harcamalarını doğrudan etkileyen çevre kirlenmesi ileride ekonomik büyümeyi de etkileyecek sonuçlara varabilmektedir. Uzun vadeli politikalar belirlenirken bu faktörün de göz önüne alınması gerekmektedir. Çevrenin daha az kirletilmesinde politika yapıcıların dikkat etmesi gereken konuların başında
yenilenebilir enerji gelmektedir. Yeni teknolojiler sayesinde CO2 salınımında
ciddi azalmalar olacaktır. Hükümetlerin politikalarında bu tür teknolojilere yapılacak yatırımlar ile birlikte çevrenin kirlenmesi azalacaktır. Politika
yapıcıların dikkat etmesi gereken bir başka konu toplumu CO2 salınımı
konusunda bilinçlendirmesi gerekmektedir. Bu sayede toplumun sağlık seviyesi ile birlikte toplum refahı artacaktır.