*Corresponding author email: [email protected] 4754
SYNTHESIS, CHARACTERIZATION AND DNA INTERACTION OF CU(II) COMPLEXES WITH
HYDRAZONE-SCHIFF BASE LIGANDS BEARING ALKYL QUATERNARY AMMONIUM SALTS
ELIF EDA ŞENGÜL, TOLGA GÖKTÜRK, CANSU GÖKÇE TOPKAYA AND RAMAZAN GUP
*Department of Chemistry, Faculty of Science, Mugla Sıtkı Koçman University, 48100, Kotekli-Mugla, Turkey. ABSTRACT
Four new Schiff-base hydrazone ligands were synthesized by the condensation of 2- and 4-aminobenzoylhydrazone with 3-(4-acetylphenoxy)-N,N,N-trimethylpropane-1-ammonium and 5-(4-acetylphenoxy)-N,N,N-trimethylpentane-1-ammonium salts. The structures of the ligands were confirmed by means of NMR, FTIR, and elemental analysis. The mononuclear and binuclear copper complexes containing these ligands were also obtained. The hydrazine-Schiff base compounds behave either as bidentate (NO sites) monobasic or tridentate (NNO sites) dibasic as ligands depending on the position of the amino group. Elemental analyses, magnetic susceptibility, FTIR and mass spectroscopy were used to confirm the proposed structures of new copper complexes. DNA binding and cleavage activities of all compounds were investigated. UV-vis spectroscopy results suggest that all compounds preferably bind to DNA via intercalation mode. According to the results of electrophoresis studies, the compounds exhibit significant cleavage activity on the plasmid DNA both in the absence and presence of hydrogen peroxide, depending on the concentration of the compounds.
Keywords: Hydrazone, quaternary ammonium salts, mono- and binuclear copper(II) complex, DNA binding and cleavage.
1. INTRODUCTION
Schiff bases are well known and potential chelating agents in coordination chemistry and also have significant applications in medicine with their anti-bacterial, anti-inflammatory and anti-microbial activities.1-7 These ligands are
often used to build multinuclear metal complexes according as they can be easily synthesized, have a reasonable structure and allow for easy synthesis of wide variety of complex compounds having chemical, biological and industrial importance.8-12 In last decade, metal complexes have attracted quite attention in
medicinal chemistry and biochemistry as encouraging compounds to design new drugs.13-15 These studies also showed that complexation between ligands and
metal ions increases their bio potential compared to their simple forms. It is well known that metal ions can change magnitude and direction of the medicinal activity of a simple ligand as a result of changes in their redox potential, charge density distribution, shape and size. With this reason, researches in recent years have been focused on the design and synthesis of the potent metal based drugs with more effective therapeutic properties. Hydrazones and aroyl-hydrazones have various biological activities such as analgesic, antimicrobial, antidepressant, anticonvulsant, antiplatelet, antiviral and antitumor.16-19
Additionally, metal complexes of hydrazones have been investigated for years due to their antitumor and antimicrobial activities.20–24
The compounds having quaternary ammonium salts moiety are widely used as bioactive agents. Quaternary ammonium salts have a significant role in the living organisms and are commonly used for the control of bacterial growth in clinical and industrial environments.25-27 Quaternary ammonium salts are also used as
fungicides, bactericides, antiseptics and therapeutic agents due to their excellent antimicrobial activity. The alkyl chains they have ease their transition through bio-membranes and their longer size increases the lipophilicity as drug. In the view of potential value of biological activities of quaternary alkyl ammonium salts and hydrazones we have decided to design novel Schiff base ligands using quaternary alkyl ammonium salts and hydrazones to get their cooperative effects for having better biological activities of newly synthesized Schiff base ligands and also their copper(II) complexes.
Therefore, here we report the synthesis and characterization of novel aroylhydrazone ligands containing quaternary alkyl ammonium salts and their Cu(II) complexes as well as the studies the in vitro DNA binding and DNA cleavage activities.
2. MATERIAL AND METHODS 2.1 Materials and Instrumentation
All reagents used in this work were supplied from Merck and Sigma-Aldrich and used without further purification. pBR322 DNA was purchased from Fermentas. Microanalysis (C, H, N) were performed using LECO 932 CHNS analyzer and copper content was measured by AAS using the DV 2000 Perkin
Elber ICP-AAS. Mass spectra were recorded on a Waters Xrvo TQ-S UPLC-MS/MS spectrometer. Sherwood Scientific MK1 Model Gouy Magnetic Susceptibility Balance were used to measure magnetic susceptibility of complexes. NMR spectra were recorded on a Bruker 400 MHz spectrometer in DMSO_d6 using TMS as internal standard. IR spectra were recorded on pure
solid samples with a Thermo-Scientific, Nicolet iS10-ATR. The electronic spectra of the ligands and complexes were recorded on a PG Instruments T80+ UV/Vis Spectrophotometer.
2.2 Preparation of 3- (4-acetylphenoxy) -N, N, trimethylpropane-1-ammonium perchlorate (I) and 5- (4-acetylphenoxy) -N, N, N-trimethylpentane-1-ammonium perchlorate (II)
1.52 g (0.011 mol) of K2CO3 and catalytic amount of KI were added to a
solution of 1.36 g (0.01 mol) of 4-hydroxyacetophenone in 20 mL of acetone, followed by stirring for 15 minutes. (3-bromopropyl) trimethylammonium bromide (0.01 mol, 2.87 g) or (5-bromopentyl) trimethylammonium bromide (1.36 g, 0.01 mol) was added as a solid and the resulting mixture was stirred under reflux for 24 hours. After evaporating the solvent with evaporator, the remaining solid was dissolved with minimum amount of cold water and an equal amount of NaClO4 was added and kept at refrigerator for one night. The white
solid precipitate was filtered off. The product was purified by crystallization using methanol. The purity of the compound was checked with thin layer chromatography.
For (I): Yield 81%. Mp: 150-152 °C. UV-VIS (DMF, nm) 205.5, 216.0, 272.0
sh, 299. FTIR (ATR, cm−1): 2956 (C-H)aliph, 1674 (C=O), 1246 (C-O). 1H NMR
(DMSO_d6, ppm): δ 2.19 (p, 2H, CH2), 2.31 (s, 3H, CH3), 3.18 (s, 9H, N+-CH3),
3.45 (t, 2H, N-CH2), 4.09 (t, 2H, O-CH2), 7.75 (2H, d, ArH), 7.98, (2H, d, ArH).
13C NMR (DMSO_d
6, ppm): 186.7 (C=O), 172.3 (C=O), 162.7 (C-O), 149.1,
147.6 and 142.9 (C=N), 137.1, 131.8, 128.4, 119.4 and 114.4 (Ar-C), 64.5 (O-CH2), 10.4 (CH3). Analysis (%): (% calculated/found) for C14H22ClNO6; C,
50.08/50.01; H, 6.60/6.53; N, 4.77/4.15.
For (II): Yield 79%. Mp: 129-131 °C. UV-VIS (DMF, nm) 205.5, 271.0, 291
sh, 304.0. FTIR (ATR, cm−1): 2956 (C-H)aliph, 1669 (C=O), 1261 (C-O). 1H
NMR (DMSO_d6, ppm) δ 1.14 (2H, p, CH2), 1.77 (4H, m, CH2), 2.45 (3H, s,
CH3), 3.15 (9H, s, N-CH3), 3.28 (2H, t, N-CH2), 4.06 (2H, t, O-CH2), 7.01 (2H,
d, ArH) 7.90 (2H, d, ArH). 13C NMR (DMSO_d
6, ppm) 197.0 (C=O), 163.1
(C-O), 131.2, 130.5, and 114.9 (Ar-C), 68.1 (O-CH2), 65.8 (N-CH2), 52.8 (N-CH3),
28.6 (CH3), 27.1, 23.0, 22.5 (CH2). LC-MS 364.15 (M+). Analysis (%): (%
calculated/found) for C16H26ClNO6; C, 52.82/52.75; H, 7.20/7.23; N, 3.85/3.87.
2.3 Synthesis of the hydrazone Schiff base ligands
3-(4-Acetylphenoxy)-N,N,N-trimethylpropane-1-ammonium perchlorate (I) or 5-(4-acetylphenoxy)-N,N,N-trimethylpentane-1-ammonium (II) (1 mmol)
4755
was added as a solid to a solution of 2- or 4-aminoybenzohydrazide (1 mmol) dissolved in 10 mL of ethanol with a catalytic amount of glacial acetic acid. The reaction mixture was refluxed for further 24 h. The precipitated compound was collected by filtration, washed with diethyl ether and then dried in vacuum. The product recrystallized by water-ethanol (2/1).
For (E)-3-(4-(1-(2-(4-Aminobenzoyl)hydrazineylidene)ethyl)phenoxy)-N,N, N- trimethylpentane-1-ammonium perchlorate (HL1): Yield 80 %. Mp 219 °C.
UV-VIS (DMF, nm): 269.0 sh, 315.0. IR (ATR, cm−1): 3437 and 3345 (NH2),
3228 (NH), 2950 and 2868 (C-Haliph), 1659 (C=O)amide, 1600 (C=N), 1316 (C-N),
1263 (C-O), 1111 (ClO4-). 1H NMR (DMSO_d6, ppm): δ 2.22 (p, 2H, CH2), 2.33
(s, 3H, CH3), 3.12 (s, 9H, N+-CH3), 3.50 (t, 2H, N-CH2), 4.12 (t, 2H, O-CH2),
6.86 (d, 2H, ArH), 7.02 (d, 2H, ArH), 7.79 (d, 4H, ArH), 10.09 (s, 1H, OH), 10.48 (s, 1H, NH). 13C NMR (DMSO_d
6, ppm) 159.9 (C=O), 160.7 (C=N), 160.8
and 159.6 (ArC-O), 130.3, 129.2, 128.3, 124.9, 115., 114.4 (Ar-C), 67.2 (CH2
-O), 63.4 (N-CH2), 52.7 (N+-CH3), 23.0 (CH3), 14.4 (CH2). Analysis: (%
calculated/found) for C23H33ClN4O6; C: 55.59/54.89, H: 6.69/6.52, N:
11.27/11.61.
For (E)-3-(4-(1-(2-(4-Aminobenzoyl)hydrazineylidene)ethyl)phenoxy)-N,N, N-trimethylpropan-1-ammonium perchlorate (HL2): Yield 82 %. Mp 272 °C.
UV-VIS (DMF, nm): 271.0 sh, 338.0. FTIR (ATR, cm−1): 3454 and 3351 (NH2),
3232 (NH), 2962 and 2873 (C-Haliph), 1649 (C=O)amide, 1602 (C=N), 1315 (C-N),
1262 (C-O), 1093 (ClO4-). 1H NMR (DMSO_d6, ppm): δ 1.48 (p, 2H, CH2), 1.78
(m, 4H, CH2), 2.32 (s, 3H, CH3), 3.06 (s, 9H, N+-CH3), 3.33 (t, 2H, N-CH2), 4.06
(t, 2H, O-CH2), 6.86 (d, 2H, ArH), 6.99 (d, 2H, ArH), 7.78 (d, 4H, ArH), 10.08
(s, 1H, OH), 10.45 (s, 1H, NH). 13C NMR (DMSO_d
6, ppm): 166.4 (C=O), 160.
(C=N), 160.4 and 160.8 (ArC-O), 131.0, 129.2, 125.0, 124.4, 115.2, 114.6 (Ar-C), 67.6 (CH2-O), 65.6 (N-CH2), 52.6 (N+-CH3), 28.5 (CH3), 22.8, 22.3 and 14.6
(CH2). Analysis (% calculated/found) for C21H29ClN4O6 C: 53.79/53.45, H:
6.23/6.07, N: 11.95/11.60.
For (E)-3-(4-(1-(2-(2-Aminobenzoyl)hydrazineylidene)ethyl)phenoxy)-N,N, N-trimethylpentane-1-ammonium perchlorate (HL3): Yield 74 %. Mp 181 °C.
UV-VIS (DMF, nm): 274.0 sh, 337.0. FTIR (ATR, cm−1): 3442 and 3354 (NH2),
3230 (NH), 2948 and 2871 (C-Haliph), 1664 (C=O)amide, 1606 (C=N), 1320 (C-N),
1249 (C-O), 1092 (ClO4-). 1H NMR (DMSO_d6, ppm): δ 1.48 (p, 2H, CH2), 1.78
(m, 4H, CH2), 2.32 (s, 3H, CH3), 3.06 (s, 9H, N+-CH3), 3.33 (t, 2H, N-CH2), 4.06
(t, 2H, O-CH2), 6.86 (d, 2H, ArH), 6.99 (d, 2H, ArH), 7.78 (d, 4H, ArH), 10.08
(s, 1H, OH), 10.45 (s, 1H, NH). 13C NMR (DMSO_d
6, ppm): 166.4 (C=O), 160.
(C=N), 160.4 and 160.8 (ArC-O), 131.0, 129.2, 125.0, 124.4, 115.2, 114.6 (Ar-C), 67.6 (CH2-O), 65.6 (N-CH2), 52.6 (N+-CH3), 28.5 (CH3), 22.8, 22.3 and 14.6
(CH2). Analysis (% calculated/found) for C23H33ClN4O6; C: 55.59/55.27, H:
6.69/6.78, N: 11.27/10.99.
For (E)-3-(4-(1-(2-(2-Aminobenzoyl)hydrazineylidene)ethyl)phenoxy)-N,N, N-trimethylpropan-1-ammonium perchlorate (HL4): Yield 82 %. Mp 272 °C.
UV-VIS (DMF, nm): 270.0, 297.0., 341.0 FTIR (ATR, cm−1): 3349 br (NH2),
3227 (NH), 2955 and 2858 (C-Haliph), 1669 (C=O)amide, 1605 (C=N), 1320 (C-N),
1246 (C-O), 1090 (ClO4-).1H NMR (DMSO_d6, ppm): δ 1.48 (p, 2H, CH2), 1.78
(m, 4H, CH2), 2.32 (s, 3H, CH3), 3.06 (s, 9H, N+-CH3), 3.33 (t, 2H, N-CH2), 4.06
(t, 2H, O-CH2), 6.86 (d, 2H, ArH), 6.99 (d, 2H, ArH), 7.78 (d, 4H, ArH), 10.08
(s, 1H, OH), 10.45 (s, 1H, NH). 13C NMR (DMSO_d
6, ppm): 166.4 (C=O), 160.
(C=N), 160.4 and 160.8 (ArC-O), 131.0, 129.2, 125.0, 124.4, 115.2, 114.6 (Ar-C), 67.6 (CH2-O), 65.6 (N-CH2), 52.6 (N+-CH3), 28.5 (CH3), 22.8, 22.3 and 14.6
(CH2). Analysis (% calculated/found) for C21H29ClN4O6 C: 53.79/53.45, H:
6.23/6.07, N: 11.95/11.60.
2.4 Synthesis of Cu(II) complexes
Equimolar amounts copper(II) perchlorate hexahydrate (0.370 g, 1 mmol) was added as a solid to a solution of HL1 or HL2 (2 mmol) and HL3 or HL4 (1 mmol)
dissolved in MeOH-water (10 mL). After addition trimethylamine (2 mmol),the reaction mixture and refluxed for 24 h. The complex was precipitated, filtered off and washed with cold water. Finally recrystallized by acetonitrile-ethanol (1/1).
For [Cu(HL1)2]: Dark brown complex; Yield: 72 %; m.p.: 278 ºC. µ
eff = 1.69
B.M.; UV-VIS (DMF, nm): 270.0 sh, 310.0, 376.0 sh, 387.0, 398.0 sh. FT-IR (ATR, cm−1): 3468 and 3377 (NH2), 3040 (ArH), 2928 and
2821 (C-Haliph), 1607 (C=N−N=C), 1370 (C-N), 1248 (C−O), 1092 (ClO4).
Analysis (% calculated/found) for C46H64Cl2CuN8O12 C: 52.35/52.64, H:
6.11/5.98, N: 10.62/10.31, Cu: 6.02/5.87.
For [Cu(L2)2]: Dark brown complex; Yield: 71 %; m.p.: 277 ºC. µ
eff = 1.72
B.M.; UV-VIS (DMF, nm) 274.0 sh, 317.0, 367.0 sh, 386.0 and 407.0 sh. FT-IR (ATR, cm−1) 3466 and 3377 (NH2), 3043 (ArH), 2932 and 2835 (C-Haliph), 1604
(C=N−N=C), 1372 (C-N), 1238 (C−O), 1091 (ClO4). MS (ES+), (m/z): 999.18
[M]+. Analysis (% calculated/found) for C
42H56Cl2CuN8O12 C: 50.48/50.72, H:
5.65/5.84, N: 11.21/11.03, Cu: 6.36/6.18.
For [Cu2(L3)2]: Dark brown complex; Yield: 72 %; m.p.: 278 ºC. µ
eff = 1.39
B.M.; UV-VIS (DMF, nm): 284.0, 320.0 sh, 386.0, 413.0 sh. FT-IR (ATR, cm−1): 3443 b (NH2), 3042 (ArH), 2947 and 2838 (C-Haliph), 1605 (C=N−N=C), 1367
(C-N), 1250 (C−O), 1095 (ClO4). MS (ES+), (m/z): 1119.80 [M+2]+. Analysis
(% calculated/found) for C46H62Cl2Cu2N8O12 C: 49.46/49.26, H: 5.59/5.73, N:
10.03/10.22, Cu: 11.38/11.08.
For [Cu2(L4)2]: Dark brown complex; Yield: 71 %; m.p.: 277 ºC. µ
eff = 1.36
B.M.; UV-VIS (DMF, nm) 273.0, 314.0, 345.0, and 409.0 sh. FT-IR (ATR, cm−1): 3407 b (NH2), 3045 (ArH), 2951 and 2847 (C-Haliph), 1609 m
(C=N−N=C), 1367 m (C-N), 1245 (C−O), 1088 (ClO4). Analysis (%
calculated/found) for C42H54Cl2Cu2N8O12 C: 47.55/47.86, H: 5.13/4.99, N:
10.56/10.12, Cu: 11.98/12.13. 2.5 DNA Binding
2.5.1 Electronic absorption titrations
All the binding experiments of these complexes with CT-DNA were conducted in water buffer containing 5 mM tris [tris(hydroxymethyl)aminomethane] and 50 mM NaCl, and adjusted to pH 7.3 with HCl. The determination of UV-Vis absorption spectra was carried out by adding the increasing amounts of DNA (from 0 to 100 µM) to each of these compounds with a fixed concentration (50 µM) dissolved in a solvent mixture of 1% DMF and 99% tris–HCl buffer. The spectra were measured in the wavelength range of 200−500 nm.28
2.6 DNA Cleavage
The cleavage of supercoiled pBR322 DNA was determined by agarose gel electrophoresis.29 The gel electrophoresis experiments were performed by
incubation of the samples containing 7 µl pBR322 plasmid DNA (50 ng/µl) and different concentrations of compounds (50, 100, 150, 200 and 250 µM) dissolved in DMF in 100 mM Tris-HCl buffer (pH 8.0) at 37 ºC for 2 h in the presence and absence of H2O2 (5 µl, 5 mM). After incubation, the samples were loaded with 4
µl loading dye (0.25% bromophenol blue, 0.25% xylene cyanol, 30% glycerol, 10 mmol EDTA) on a 1% agarose gel containing 1 µg/ml of EtBr. The gels were run at 100 V for 3 h in TBE buffer and photographed under UV light.
3. RESULTS AND DISCUSSION 3.1 Synthesis
For the synthesis of (4-acetylphenoxy) -N, N, N-trimethylpropane-1-ammonium perchlorate (I) and (4-acetylphenoxy) -N, N, N-trimethylpentane-1-ammonium perchlorate (II) (Scheme 1) equimolar amounts of 4-hydroxybenzyohdrazide and a slight excess of anhydrous K2CO3 were suspended
in dry CH3COCH3 and gently refluxed. The hydrazone Schiff base ligands were
synthesized using reactions of compounds I and II with 4-aminobenzoic hydrazide (HL1, HL2) and 2-aminobenzoic hydrazide (HL3, HL4) in ethanol. The
reactions resulted in good yields to produce the corresponding aroylhydrazones and proceeded smoothly (Figure 1). They are not soluble in water but soluble in common organic solvents. The structures of the newly synthesized ligands were elucidated with 1H- and 13C NMR, elemental analyses, electronic absorption and
FTIR. The metal complexes, [Cu(L1)
2], [Cu(L2)2], [Cu2(L3)2]2ClO4 and
[Cu2(L4)2]2ClO4 were synthesized by reacting equimolar amounts of
Cu(ClO4)2·6H2O and the corresponding ligand in MeOH followed by the
addition of trimethylamine.
The copper(II) complexes of Schiff base ligands were characterized using FTIR, mass, UV/Vis spectroscopy, magnetic susceptibility measurement and elemental microanalyses. The analytical data and the proposed molecular formulas for the hydrazone-Schiff base compounds their copper(II) complexes were in good agreement.
4756 Scheme 1: Schematic diagram showing the synthesis of (4acetylphenoxy)
-N, -N, N-trimethylalkyl-1-ammonium perchlorate compounds. 3.2 1H- and 13C-NMR spectroscopy
The 1H NMR and 13C NMR spectra of the compounds recorded at room
temperature in DMSO_d6. In the 1H NMR spectrum, the chemical shifts appeared
as singlet in the region of 3.06-3.12 ppm and 2.31-2.33 ppm are attributed N+(CH
3)3 and CH3-C=N protons, respectively. The triplet peaks in the region of
4.06-4.12 and 3.34-3.52 ppm are due to –CH2OPh and –CH2N protons. The NH2
protons of HL1 (Figure S1) and HL2 resonance as a singlet at 5.74 and 5.75 ppm
while those of HL3 (Figure S2) and HL4 appear at 6.22 and 6.21 ppm as a singlet.
The chemical shift for –NH proton appear as a singlet in the region of 10.21-10.47 ppm, also indicating the formations of the hydrazone Schiff base ligands. The aromatic protons of HL1 and HL2 ligands give four doublet-doublet peaks at
~ 6.60, ~ 7.00, ~ 7.65 and ~ 7.80 ppm as expected for the 1,4-disubstituted aromatic compounds whereas the aromatic protons of HL3 and HL4 ligands,
orto-disubstituted, give both doublet-doublet and multiplet signals. The other 1H
NMR peaks of the ligands consistent with previously reported similar compounds.30-33
Figure 1. Proposed structure of the hydrazone Schiff base ligands.
According to the 13C NMR spectrum of the ligands, the signals in the region
of 132.4-112.9 ppm are ascribed to the carbon atoms of aromatic ring (Figures S3 and S4). The signals in the region of 65.3-67-6, 63.5-65.7 and 52.7 ppm are assignable to –O-CH2, -N+-CH2 and –N+-(CH3)3 carbons, respectively. The
chemical shifts corresponding to the aliphatic carbon atoms are observed in the region of 14.5-28.6 ppm. The chemical shift at ~ 160.0 is attributed to carbonyl carbon (C=O) of the ligands, respectively. The peaks observed in region of 149.8-159.9 are due to aromatic C-O, azomethine carbon (C=N) and aromatic C-N resonances, in addition. 1H and 13C NMR spectrum of the Cu(II) complexes
could not be obtained due to their paramagnetic nature. 3.3 Infrared spectra
The IR spectra of the compounds in the region of 400-4000 cm-1 were
analyzed. The IR spectra of the ligands gives absorption two bands in the region of 3351-3454 cm-1 and ~ 3230 cm-1 due to asymmetric and symmetric stretching
vibrations of NH2 group while one band at ~ 3230 cm-1 is observed for the
stretching vibration of NH group (Figures S5 and S6). The IR also show the presence of strong stretching vibrations of v(C=N) (1600-1606 cm-1) and the
ionic perchlorate (1089-1111 cm-1). In comparison with the free hydrazone
ligands, the strong bands due to stretching vibration of the carbonyl group observed between 1648-1670 cm-1 disappeared and a new band was observed at
between 1605-1609 cm-1 in the IR spectrum of the Cu(II) complexes probably
due to >C N N C< stretching vibration indicating that the coordination of azomethine nitrogen v(C=N) and the enolic oxygen after deprotonation to copper center.30,34-37 In the IR spectra of [Cu(L1)
2] (Figure S7)
and [Cu(L2)
2] two bands for asymmetric and symmetric stretching vibrations of
NH2 groups were observed at ~3468 cm-1 and 3377 cm-1 indicating
non-involvement of these groups in the complex formation whereas in the case of [Cu2(L3)2] (Figure S8) and [Cu2(L4)2] only a single weak band appeared at 3443
and 3407 cm-1 since it seems that they have only one N-H bond probably due to
the deprotonation of one hydrogen of NH2 and then coordinating this group to
copper center. Therefore, from the IR spectra it is concluded that the HL1 and
HL2 compounds act as mono anionic bidentate ligands coordinating through the
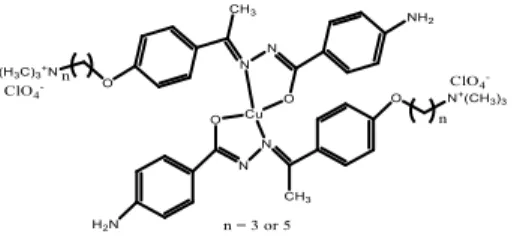
azomethine nitrogen and the enolic oxygen to form mononuclear complexes (Figure 2) whereas HL3 and HL4 compounds act as dianionic tridentate ligands
coordinating through the azomethine and amido nitrogen atoms and the enolic oxygen to form binuclear complexes (Figure 3). The other peaks observed in the IR spectra of the compounds are given in experimental section.
Figure 2. Suggested structures of the mononuclear copper(II) complexes. 3.4 Electronic absorption spectra
The electronic spectra of all compounds were recorded in DMF at room temperature, and the spectral data are given in the experimental section. The intense bands at the region of 269-274 nm and 304-341 nm are due to π→π* and n→π* transitions of the hydrazone ligands, respectively. The spectra of all complexes show absorption bands at 398-413 nm due to intra-ligand charge transfer transitions. An intense band at ~386 nm is assigned to the ligand-metal
charge transfer transition. The other bands observed in the UV-Visible spectra of the complexes are assigned to π→π* and n→π* transitions. The measured magnetic moment values for [Cu(L1)
2] and [Cu(L2)2] are 1.69 and 1.72 BM,
respectively, as expected for mononuclear complexes as the observed magnetic moments for these complexes correspond to the spin value for one unpaired electron [30,32,37,38]. On the other hand, the room temperature magnetic moments of the binuclear copper(II) complexes, [Cu2(L3)2] and [Cu2(L4)2], are
1.39 and 1.36 BM, respectively, much lower than expected for spin-only value which may be explained by the strong antiferromagnetic interaction between the two Cu(II) centers.35,39,40
Figure 3. Suggested structures of the binuclear copper(II) complexes. Mass spectra
The mass spectrum [Cu(L2)
2] and [Cu2(L3)2] complexes show the expected
molecular ion peaks at m/z= 999.18 (9%) for [Cu(L2)
2] and 1119.80 (19%)
(M+2) for [Cu2(L3)2] that confirm the proposed structures of the complexes
(Figures S9 and S10). 3.5 DNA binding studies
In most cases, DNA binding is the critical step in DNA cleavage [40,41]. Therefore, the probable binding ability of the hydrazone ligands and their Cu(II) complexes towards CT-DNA were studied in Tris-HCl buffer by UV-vis spectroscopy in the range of 250-500 nm. The typical absorption titration curves of the compounds at constant concentration (20 µM) in the presence of different concentrations of CT-DNA are given in Figures 4 and 5. Upon addition of DNA, the absorption bands between 269-274 nm in the spectra of the ligands exhibited hyperchromism with a minor red shift. Furthermore, the bands at 315 nm, 338 nm, 304 nm and 297 for HL1, HL2, HL3 and HL4, respectively, showed
bathochromic shift with hypochromism. A distinct isosbestic point was observed at 291 nm for HL1, 395 nm for HL2, 291 nm for HL3 and at 300 nm for HL4
indicates the existence of a single mode of binding (Figure 4). Similarly, with increase in concentration of CT-DNA, the bands between 270-284 nm exhibited
4757
hyperchromism while the bands between 304-320 nm showed hypochromism with a red shift in the absorption spectrum of the Cu(II) complexes, which indicates that all compounds bind with DNA. The isobestic points were formed at 295, 298, 303 and 306 nm for [Cu(L1)
2], [Cu(L2)2], [Cu2(L3)2] and [Cu2(L4)2]
complexes, respectively (Figure 5).
These absorption titration results suggest that the DNA binding mode of all compounds is similar and they might bind to DNA by intercalation. The hypochromic shifts in the absorption titration spectra could be attributed to a slight stacking interaction between DNA base pairs and the aromatic chromophores of the complexes consistent with the intercalative binding mode, while the batochromic shift is evidence of the stabilization of the CT‐DNA duplex. The binding constant (Kb) values were found to be 2.5 x 10⁴ M-1, 4.5 x
104 M-1, 12.9 x 10⁴ M-1, 0.167 x 10⁴ M-1, 3.0 x 10⁴ M-1, 4.0 x 10⁴ M-1, 10.0 x 10⁴
M-1 and 0.33 x 10⁴ M-1 for HL1, HL2, HL3, HL4, [Cu(L1)
2], [Cu(L2)2], [Cu2(L3)2]
and [Cu2(L4)2], respectively. These data suggest that binding affinity to DNA of
HL3 ligand and its copper(II) complex are higher than other compounds.
However, the calculated binding constants of these complexes are lower than those of the well-known DNA intercalators (ethidium bromide and [Ru(phen)DPPZ]).42,43
Figure 4. Absorption titration curves of the ligands in the presence of increasing concentration of CT-DNA. A: HL1, B: HL2, C: HL3, D: HL4
Figure 5. Absorption titration curves of the Cu(II) complexes in the presence of increasing concentration of CT-DNA. E: [Cu(L1)
2], F: [Cu(L2)2], G:
[Cu2(L3)2], H: [Cu2(L4)2]
3.6 DNA cleavage studies
Agarose gel electrophoresis has been used for the supercoiled pBR322 DNA cleavage studies of the hydrazine ligands and their copper(II) complexes under physiological conditions in the presence and absence of H2O2 as an oxidant agent.
DNA cleavage activities of the compounds were evaluated by determining their ability of converting the plasmid DNA in the supercoiled form (Form I) to the its open circular form (Form II) and the linear form (Form III).44,45
3.6.1 Hydrolytic cleavage
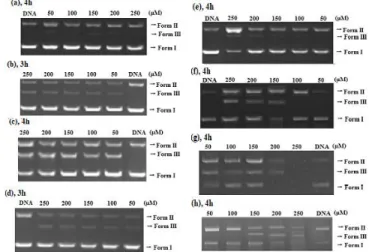
The cleavage activities of different concentrations of the compounds on plasmid DNA pBR322 were investigated at pH 7.0 (10 mM Tris-HCl) at 37 °C in the absence of a co-reagent. The cleavage activity was initially observed at specific compound concentrations over 3 or 4 h incubation (Figure 6) by
quantifying the conversion of supercoiled plasmid DNA (form I) into form II and form III. In the case of HL1, at a concentration of 50 µM, the plasmid DNA was
slightly cleaved to form II and the percentage of open-circular slightly increase with increasing ligand concentration [Figure 6 (a)]. On the other hand, the other ligands cleaved the supercoiled DNA to its nicked and linear forms at the same time and increasing intensities of forms II and III were found with increase in the ligand concentration, and the gel pattern indicates the double-strand DNA cleavage [Figure 6 (b-d)].
Figure 6. Cleavage of pBR322 DNA mediated by HL1 (a), HL2 (b), HL3 (c),
HL4 (d), [Cu(L1)
2] (e), [Cu(L2)2] (f), [Cu2(L3)2] (g) and [Cu2(L4)2] (h) at various
concentrations in absence of co-reagent.
The copper(II) complexes of the ligands effectively cleaved supercoiled DNA to open and linear form at specific complex concentrations (150 μM, 150 μM, 50 μM, 150 μM) over 4 h incubation [Figure 6 (e-h)] by quantifying the conversion of supercoiled plasmid DNA into open-circular and linear DNA. The [Cu(L1)
2],
[Cu(L2)
2] and [Cu2(L4)2] complexes slightly cleaved the supercoiled DNA only
to nicked DNA at of 100 µM (Figure 6e, 6f, 6h). When the concentration of these complexes reached to 150 µM, linear form also began to appear besides nicked form. On the other hand, the [Cu2(L3)2] cleaved the supercoiled DNA to both
form II and form III even in the at 50 µM concentration, interestingly (Figure 6g). At a concentration of 200 µM, all the supercoiled DNA was converted into open-circular and linear DNA. At 250 µM concentration, it was found that the SC DNA is substantially cleaved into NC and LC forms. It can be concluded from these data that the chemical nuclease activity of the [Cu2(L3)2] complex is
higher than those of the other Cu(II) complexes, which also has higher DNA binding affinity of the corresponding ligand.
3.6.2 Oxidative cleavage
Figure 7. Cleavage of pBR322 DNA mediated by HL1 (a), HL2 (b), HL3 (c),
HL4 (d), [Cu(L1)
2] (e), and [Cu(L2)2] (f), [Cu2(L3)2] (g) and [Cu2(L4)2] at various
4758 The oxidative cleavage of the compounds on plasmid DNA pBR322 was also
investigated at pH 7.0 (10 mM Tris-HCl) at 37 °C with different concentrations of the compound in the presence of H2O2 as co-reactant (Figure 7). The
hydrazone ligands (HL1-HL4) converted the form I DNA to its form II and form
III, and all three forms are observed even at 50 µM concentration [Figure 7 (a-d)]. Increasing the concentrations of the ligands resulted in the increasing yield of the form II and form III. In the case of HL3 ligand, when the concentration
increased to 250 µM, the supercoiled form was almost converted nicked and linear forms, and the cleavage percentage of form II seems to be higher that of form III. Interestingly, however, the copper complexes slightly cleaved the supercoiled DNA only to nicked form at concentration of 100 µM in comparison with those of the ligands. On the other hand, when the concentration of the copper complexes was increased to 150 µM, the complexes cleaved SC DNA in to NC and LC forms and the increasing intensities of the nicked and linear forms were found with increase in concentration of the Cu(II) complexes [Fig. 7 (e-h)].
4. CONCLUSION
In conclusion, four new hydrazone Schiff base ligand bearing quaternary alkyl ammonium salts and their Cu(II) complexes have been successfully synthesized and characterized. Schiff base compounds derived from 4-aminobenzylhydrazide (HL1 and HL2) act as mono anionic bidentate ligands
coordinating through azomethine nitrogen and enolic oxygen whereas Schiff base compounds derived from 2-aminobenzylhydrazide (HL3 and HL4) behave
as dibasic tridentate ligands coordinating through azomethine and amino nitrogen atoms and enolic oxygen. The DNA binding and DNA cleavage activities of Schiff base ligands as well as their complexes have been investigated. UV–vis studies exhibits that the interaction between ligands and their copper(II) complexes with CT DNA is mainly through intercalation. Furthermore, the UV spectra of the copper(II) complexes have not markedly altered with addition of increasing concentration of DNA, indicating that the main structure of the Cu(II) complexes do not change and they bind with CT-DNA non-covalently. The compounds are able to cleave CT-DNA both in the absence and presence of an oxidant agent. They cleave the circular supercoiled DNA to nicked DNA and linear DNA form both in the absence and presence of H2O2, which has strong dependence on the concentration of compounds. The
results revealed that among all compounds the ligand HL3 and its copper(II)
complex show highest DNA cleavage and binding activity. ACKNOWLEDGEMENTS
We thank the Scientific Research Projects Foundation of Mugla Sitki Koçman University for financial support of this work with Project No: 15/168.
REFERENCES
1. G. Küçükgüzel, A. Kocatepe, E. De Clercq, F. Sahin, M. Güllüce, Eur. J. Med. Chem. 41, 353, (2006).
2. T. R. Todorovic, U. Rychlewska, B. Warzajtis, D. D. Radanovic, N. R. Filipovic, I. A. Pajic, D. M. Sladic, K. K Andelkovic, Polyhedron, 28, 2397, (2009).
3. C. Marzano, M. Pellei, D. Colavito, S. Alidor, G. G. Lobbia, V. Gandin, F. Tisato, C. Santini, J. Med. Chem. 49, 7317, (2006).
4. M. X. Li, L. Z. Zhang, C. L. Chen, J. Y. Niu, B. S. Ji, J. Inorg. Biochem. 106, 117, (2012).
5. A. T. Chaviara, P. C. Christidis, A. Papageorgiou, E. Chrysogelou, D. J. Hadjipavlou-Litina, C. A. Bolos, J. Inorg. Biochem. 99, 2102, (2005). 6. F. Sparatore, G. Pirisino, M. Alamanni, P. Manca-Dimich, M. Satta, Boll.
Chim. Farmac. 117, 638, (1978).
7. W. M. Singh, B. C. Dash, Pesticides, 22, 33, (1988). 8. E. Tsuchida, K. Oyaizu, Coord. Chem. Rev. 237, 213, (2003). 9. D. C. Sherrington, Chem. Soc. Rev. 28, 85, (1999).
10. M. S. Shongwe, S. H. Rahbi, M. A. Azani, A. A. Muharbi, F. Al-Mjeni, D. Matoga, A. Gismelseed, I. A. Al-Omari, A. Yousif, H. Adams, M. J. Morris, M. Mikuriya, Dalton Trans. 41, 500, (2012).
11. P. Krishnamoorthy, P. Sathyadevi, K. Senthilkumar, P. T. Muthiah, R. Ramesh, N. Dharmaraj, Inorg. Chem. Commun. 14, 1318, (2011). 12. S. Kathiresan, S. Mugesh, J. Annaraj, M. Murugan, New J. Chem. 41, 1267,
(2017).
13. T. C. Johnstone, K. Suntharalingam, S. J. Lippard, Chem. Review, 116, 3436, (2016).
14. J. Kavanagh, D. Tresukosol, C. Edwards, J. Clinic. Oncology, 13, 1584, (1995).
15. C. Marzano, M. Pellei, F. Tisato, C. Santini, Med. Chem. 9, 185, (2009). 16. M. V. Angelusiu, S. F. Barbuceanu, C. Draghici, G. L. Almajan, Eur. J. Med.
Chem. 45, 2055, (2010).
17. G. Verma, A. Marella, M. Shaquiquzzaman, M. Akhtar, M. R. Ali, M. M. Alam, J. Pharm. Bioallied. Sci. 6, 69, (2014).
18. R. N. Sharma, K. P. Sharma, S. N. Dikshit, Arch. Appl. Sci. Res. 3, 415, (2011).
19. V. N. Telvekar, A. Belubbi, V. K. Bairwa, K. Satardekar, Bioorg. Med. Chem. Lett. 22, 2343, (2012).
20. G. Tamasi, L. Chiasserini, L. Savini, A. Sega, R. Cini, J. Inorg. Biochem. 99, 1347, (2005).
21. P. V. Bernhardt, P. Chin, P.C. Sharpe, J. Y. Wang, D. R. Richardson, J. Biol. Inorg. Chem. 10, 761, (2005).
22. D. S. Kalinowski, P. C. Sharpe, P. V. Bernhardt, D. R. Richardson, J. Med. Chem. 51, 331, (2008).
23. S. K. Sridhar, M. Saravanan, A. Ramesh, Eur. J. Med. Chem. 36, 615, (2001).
24. J. Xie, S. Shen, R. Chen, J. Xu, K. Dong, J. Huang, Q. Lu, W. Zhu, T. Ma, L. Jia, H. Cai, H. Zhu, Oncol. Lett. 13, 4413, (2017).
25. N. V. Shtyrlin, S. V. Sapozhnikov, A. S. Galiullina, A. R. Kayumov, O. V. Bondar, E. P. Mirchink, E. B. Isakova, A. A. Firsov, K. V. Balakin, Y. G. Shtyrlin, Biomed. Res. Int. 3864193, (2016).
26. K. P. C. Minbiole, M. C. Jennings, L. E. Ator, J. W. Black, M. C. Grenier, J. E. LaDow, K. L. Caran, K. Seifert, W. M. Wuest, Tetrahedron, 72, 3559, (2016).
27. I. Kowalczyk, Molecules, 13, 379, (2008).
28. C. V. Kumar, E. H. Asuncion, J. Am. Chem. Soc. 115, 8547. (1993). 29. P. R. Reddy, A. Shilpa, N. Raju, P. Raghavaiah, J. Inorg. Biochem. 105, 1603,
(2011).
30. R. Gup, B. Kırkan, Spectrochim. Acta A, 64, 809, (2006) .
31. I. C. Mendes, J. P. Moreira, N. L. Speziali, A. S. Mangrich, J. A. Takahashi, H. Beraldo, J. Brazil. Chem. Soc. 17, 1571, (2006).
32. C. Gokce, R. Gup, Appl. Organomet. Chem. 27, 263, (2012).
33. P. Dinda, P. Sengupta, S. Ghosh, T. C. M. Mak, Inorg. Chem. 41, 1684, (2002).
34. F. Tisato, C. Marzano, M. Porchia, M. Pellei, C. Santini, Med. Res. Rev. 30, 708, (2010).
35. P. Krishnamoorthy, P. Sathyadevi, A. H. Cowley, R. R. Butorac, N. Dharmaraj, Eur. J. Med. Chem. 46, 3376, (2011).
36. S. Tabassum, W. M. Al-Asbahy, M. Afzal, F. Arjmand, V. Bagchi, Dalton Trans. 41, 4955, (2012).
37. M. F. Iskander, L. El Sayed, N. M. H. Salem, R. Werner, W. Haase, J. Coord. Chem. 56, 1075, (2003).
38. R. Gup, B. Kırkan, Spectrochim. Acta A, 62, 1188, (2005).
39. M. Maekawa, S. Kitagawa, Y. Nakao, S. Sakamoto, A. Yatani, W. Mori, S. Kashino, M. S. Munakata, Inorg. Chim. Acta, 293, 20, (1999).
40. L. Zhi Li, C. Zhao, T. Xu, H. Wei Ji, Y. Hong Yu, G. Qiang Guo, H. Chao, J. Inorg. Biochem. 99, 1076, (2005).
41. E. Lamour, S. Routier, J. L. Bernier, J. P. Catteau, C. Bailly, H. Vezin, J. Am. Chem. Soc. 121, 1862, (1999).
42. K. H. Reddy, P. S. Reddy, P. R. Babu, J. Inorg. Biochem. 77, 169, (1999). 43. K. Dhara, J. Ratha, M. Manassero, X. Wang, S. Gao, P. Banerjee, J. Inorg.
Biochem. 101, 95, (2007).
44. T. Ozawa, A. Hanaki, K. Onodera, Polyhedron, 11, 735, (1992).
45. S. S. Massoud, R. S. Perkins, F. R. Louka, W. Xu, A. L. Roux, Q. Dutercq, R. C. Fischer, F. A. Mautner, M. Handa, Y. Hiraoka, G. L. Kreft, T. Bortolotto, H. Terenzi, Dalton Trans. 43, 10086, (2014).