Cilt 4, Sayı 1, Haziran 2010, sayfa 11-28.
Necatibey Faculty of Education Electronic Journal of Science and Mathematics Education Vol. 4, Issue 1, June 2010, pp. 11-28.
Perceptions of Scientists: A Comparative Study of Fifth
Graders and Fourth Year Student Teachers
Ayşe Oğuz ÜNVER*
Muğla University, Muğla, TURKIYE
Received: 28.02.2010 Accepted: 10.05.2010
Abstract – This study compared the perception of scientists of fifth grade elementary school students’ (n=65) and
senior student teachers (n=48). First, all participants answered a form with seven open-ended questions, and then they were given a blank piece of paper on which to draw a picture of a scientist. Both qualitative and quantitative procedures were utilized to analyze the data of the study. The results showed that student teachers’ perception of scientists were more stereotypical than those of the fifth grade students were. Even though today’s education programs are framed to encourage the idea of being scientists, scientific thinking and scientific society, student teachers’ perception of scientists were surprising given that they are likely to be classroom teachers in only a year’s time. The paper concludes with suggestions for science education, including an activity to put a positive image of scientists in students’ minds.
Key Words: scientist, science education, perception, 5th graders, student teachers
Bilim İnsanlarını Algılama: İlköğretim 5. Sınıf Öğrencileri
ile Son Sınıf Öğretmen Adaylarının Karşılaştırılması
Özet – Bu çalışma ilköğretim beşinci sınıf (n=65) ve üniversite son sınıf öğretmen adaylarının (n=48) biliminsanı algılarını karşılaştırmaktadır. İlk olarak katılımcılara açık uçlu yedi sorudan oluşan bir form dağıtılmış ve ardından boş bir kâğıt verilerek bilim insanı çizmeleri istenmiştir. Ham veriler hem nitel hem de nicel veri çözümleme teknikleri kullanılarak analiz edilmiştir. Sonuçlara göre, öğretmen adaylarının bilim insanı algıları beşinci sınıf öğrencilerine kıyasla daha fazla kalıp yargılar içermektedir. Her ne kadar günümüz eğitim programları, öğrencileri bilim insanı olma, bilimsel düşünme ve bilim toplumu fikirleri etrafında toplanmaya teşvik etse de, sadece bir yıl sonra öğretmen olarak görev yapacak öğretmen adaylarının “bilim insanı” algıları düşündürücüdür. Makale bilim eğitimine katkı sağlayacak öneriler ve öğrencilerin zihinlerinde olumlu bilim insanı oluşturmayı amaçlayan etkinlikler ile sonuçlanır.
Anahtar kelimeler: Bilim insanı, bilim eğitimi, algı, 5. sınıflar, öğretmen adayları
*
Corresponding author: Ayşe Oğuz Ünver, Assistant Professor in Science Education Muğla University, Education Faculty, 48000, Kötekli-Muğla, TURKIYE.
E-mail: [email protected]
•
Introduction
In teaching science, educators could make positive or negative impressions on students about science, scientists or even about educators themselves (Moseley & Norris, 1999). For instance, if students’ deeply rooted images of scientists are strange-looking in their classes, in the future theywill likely prefer not to be a scientist (Sheffield, 1997). Schibeci and Sorensen (1983) found that children’s negative stereotypical images of scientists translated into negative images of science. Moreover, Ross (1993) and MacCorquodale (1984) reported that the reason why females are less likely to enter science classes was their low and negative perceptions with respect to science.
The anthropologist, Margaret Mead, and the medical doctor, R. Metraux, (1957) were the first researchers to study students` perception of scientists. They have done a nation-wide study and asked high school students to write an essay describing their perceptions of scientists. They found the typical high school student’s image of a scientist to be an elderly or middle-aged man, wearing a white coat and glasses, and working in a laboratory. Since then, other studies have also found that students` stereotypical images of scientist did not significantly different (e.g., Chambers, 1983; Mason & Kahle, 1989; Mason, Kahle, & Gardner, 1991; Rosenthal, 1993; Schibeci & Riley, 1986).
Several studies on images of scientists have been conducted with various populations including primary school age children (e.g., Buldu, 2006; Chambers, 1983; Kaya, Dogan & Ocal, 2008; Painter & Tretter, 2006; Schibeci & Sorenson, 1983), students in the middle grades (e.g., Fralick, Kearn, Thompson & Lyons, 2009; Symington & Spurling, 1990), high school students (e.g., Mason, Kahle, & Gardner, 1991), collage students (e.g., Bovina & Dragul’Skaia, 2008) and pre-service teachers (e.g., Moseley & Norris, 1999). The common results of these studies were the participants’ stereotypical images of scientists. Interestingly, Finson and Beaver (1995) found that, as children progress through successively higher-grade levels, their images of scientists become more and more stereotypical.
As a result, studies with various populations showed that participants` images of scientists were similar to each other. However, are those results the same with different cultures? One study examined how multicultural factors influence the images of scientists and reported that, while students of one ethnicity typically drew pictures of people of that same ethnicity; most Caucasians students rarely drew images of Caucasians (Odell, Hewitt, Bowman, & Boone, 1993). In addition, few studies from Asian countries showed stereotypical images of scientists (e.g., She, 1998; Song & Kim, 1999). Furthermore, there
have been only a few studies from different cultures that have obtained comprehensive data (Rubin & Cohen, 2003; She, 1998; Song & Kim, 1999). Despite a considerable amount of research on students’ perceptions of scientist, there have been few studies comparing elementary school students’ perception with those of teachers’ (e.g., Moseley & Norris, 1999). The comparison of these two populations could be significant in terms of hypothesis the source of children perception of scientists and premise how these two populations influence each other, since the teachers are the ones who teach science and scientists to the elementary students. As a result, the aim of this study was to determine fifth grade Turkish elementary school students’ and the fourth year Turkish student teachers’ perception of scientist and how their perceptions differed. The study carried out by comprehensive data, like the image of the scientist, the definition of a scientist, scientists you know, and being a scientist.
Participants And Procedure
Participants
The researcher selected participants by using stratified sampling procedure (Tuckman, 1999), because this sampling method permitted researchers to select participants in turns of the research interest. The study restricted with a Public University located in the Mediterranean region of Turkey and elementary schools in same region for comparing whether there was a difference between the fifth grades and the fourth year student teachers’ perception of scientist. For selecting participants in elementary schools, the first step was writing the names of all elementary schools from the cluster that was taken from the city Department of Education, and then drawing a random sample. As a result, the study was conducted 65 fifth grade elementary school students (31 male and 34 female, mean-age 11) and 48 senior class student teachers majoring in elementary education (27 male and 21 female, mean-age 23).
Instrument and Data Collection
In this study, the author attempted to examine several different aspects of students’ perception of scientists by comparing two groups. First, participants answered a form with seven open-ended questions (see Appendix A). The questions was modified from earlier studies (Buldu, 2006; Chambers, 1983; Painter & Tretter, 2006) and initially evaluated by a professor from science education department and by a 5th grade teacher. A professor from the
department of Turkish Language Education reviewed the accuracy of language of the questions. Then the participants were given a blank piece of paper and asked to draw a scientist. The reason for obtaining open-ended questions and drawing data is that, if participants` drawing skills are poor, then they can express themselves in words and vice versa and decrease the limitations of the DAST test. Since the DAST only checked the drawings of the participants, sometimes participants may not tell the things they would like to express.
The researcher gave the instrument during a non-instructional period. Completing the instrument took around 40 minutes. The students were instructed to emphasize no names should be put anywhere on the test paper. Students' participation was entirely voluntary. Students' grades were not affected by their decision to participate or not to participate in this study. Even though the students could withdraw from the study at any time without consequences of any kind, none of the students quit the study.
Coding
Participants were asked seven open-ended questions and these were centered on three themes constructed with an iterative process of open coding (Strauss & Corbin, 1990). The three themes were: (1) definition of a scientist; (2) a scientist you know; and (3) being a scientist. The relative frequencies of the qualitative data were calculated and converted to a percentage in order to compare the elementary school students’ and the student teachers’ scores.
The pictures were analyzed in terms of a control list that was developed by the authors following the guidance of the Draw a Scientist Test (DAST) (Chambers, 1983) and the Draw a Scientist Test – Checklist (DAST-C) (Finson and Beaver, 1995). Chambers (1983) reported seven essential characteristics of the stereotypical image of scientist: (1) lab coat, (2) eyeglasses, (3) facial growth hair, (4) symbols of research: scientific instruments and laboratory equipment of any kind, (5) symbols of knowledge: principally books and filing cabinets, (6) technology: the product of science, (7) relevant captions: formulae, taxonomic classification, etc. Then, Finson and Beaver (1995) criticized the scoring of DAST and developed DAST-C to analyze the data. In the present study, the author developed a more comprehensive control list based on these previous studies. The drawings were scored in terms of the control list below. For instance, for the category whether the student draw a scientist with glasses scored 1 and without a glasses scored 0.
1. Appearance of scientist (glasses, strange hairstyle, facial hair, lab coat, disheveled, neat look, ordinary look, unusual figure, foolish-looking).
2. Apparatuses.
a. Symbols of research displayed (test tubes, beakers, flasks, mass cylinder etc.). b. Symbols of knowledge (books, clipboards, pens in pockets, etc.).
c. Technology representations (telephone, TV, computer, etc.). d. Relevant captions (formulae, “eureka”, etc.).
e. Warnings (“private”, “keep out”, “top secret”, etc.) 3. Place.
a. Indoor (research room, laboratory, etc.). b. Outdoor (mountains, gardens, space, etc.). 4. Activity (experiment, research, etc.).
5. Gender (male, female)
6. Age (young, old, middle aged) Results
Analysis of Pictures
Appearance of Scientist
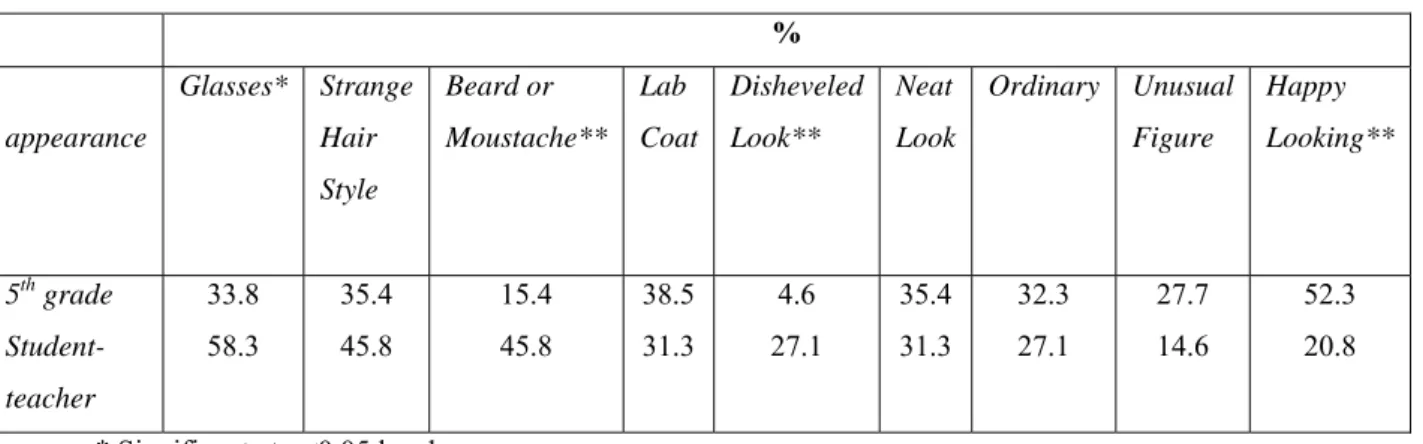
Chi square analysis indicated a significant difference at the .001 level in four of the nine categories. In the category of the appearance of the scientist, all variables were lower than 50% except for ‘happy looking’ and ‘glasses’ (see Table 1). However, student teachers’ scores for the variables ‘beard or moustache’ and ‘disheveled look’ were significantly higher than the elementary school students’ score (χ2= 12,61, p<.001, χ2= 11,48, p<.001). That is to say, compared to elementary school students, more student teachers drew scientists with a disheveled look and facial hair. Moreover, 58.3% of student teachers drew a scientist with glasses, whereas only 33.8% of elementary school students did this. As a result, significant differences were found between these two variables (χ2= 6,71, p<.05). On the other hand, 52.3% of elementary school students drew a happy-looking scientist, while only 20.8% of student teachers did so (χ2= 11,50, p<.001). None of the students’ draws stupid or foolish-looking scientists.
Table 1 Comparison of Fifth Grade Elementary School Students’ And Senior Student Teachers’ Drawings Of The ‘Appearance Of Scientists’ (n=113)
% appearance Glasses* Strange Hair Style Beard or Moustache** Lab Coat Disheveled Look** Neat Look Ordinary Unusual Figure Happy Looking** 5th grade Student-teacher 33.8 58.3 35.4 45.8 15.4 45.8 38.5 31.3 4.6 27.1 35.4 31.3 32.3 27.1 27.7 14.6 52.3 20.8 * Significant at p<0.05 level ** Significant at p<0.001 level
Two typical examples of elementary school students' and university level students’ drawings for “appearance of scientists” are represented in Figure 1a and Figure 1b. While the student teachers drew a scientist with beard and moustache and a disheveled look, fifth grade students drew a happy scientist with an ordinary appearance.
Figure 1a Student Teacher’s (BO25) Drawing Figure 1b Fifth-Grade Student’s (Y12) Drawing
Apparatuses
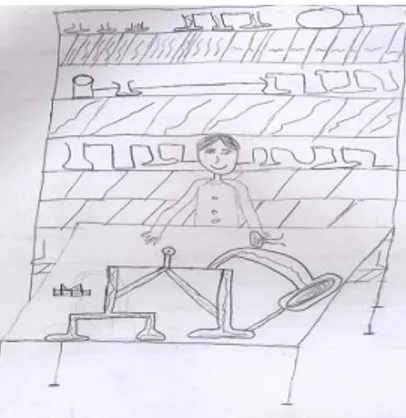
No significant differences were found between the elementary students and student teachers for the variable ‘apparatus’, except for ‘symbols of research displayed’. Less than 10% of student teachers drew the scientists with the ‘symbols of knowledge’, ‘technology representations’, ‘relevant captions’, and ‘warnings’ variables. Fifth grade elementary school students included in their drawing a significantly higher number of research symbols such as test tubes, beakers and flasks and mass cylinder than student teachers did (χ2= 15,24 p<.001). Figure 2 illustrates a sample picture from a fifth grade elementary school student.
Figure 2 Fifth-Grade Elementary School Student’s (Y6) Drawing
Place
More fifth grade students (34.4%) depicted their scientists working in a laboratory, compared to only 6.3% of student teachers who drew their scientists in laboratory. Therefore, significant differences were found between the groups (χ2= 13,23, p<.001). Among fifth grade students, one drew a scientist with a backpack, one student drew a group of scientists studying together in a laboratory, two students drew scientists working in an office, one student drew a scientist on a field trip, and three students imagined a scientist working in space. In contrast, among student teachers, only one student drew a scientist in a classroom, one student drew a scientist reading a book in a library, and two students drew a scientist in an office. As a result, fifth grade students tended to imagine scientists in their working environment.
Activity
More fifth grade student (43.1%) depicted their scientists doing research in a laboratory than student teachers did (4.2%). Significant differences at the 0.001 level were found between the two groups (χ2= 21,44, p<.001).
Gender
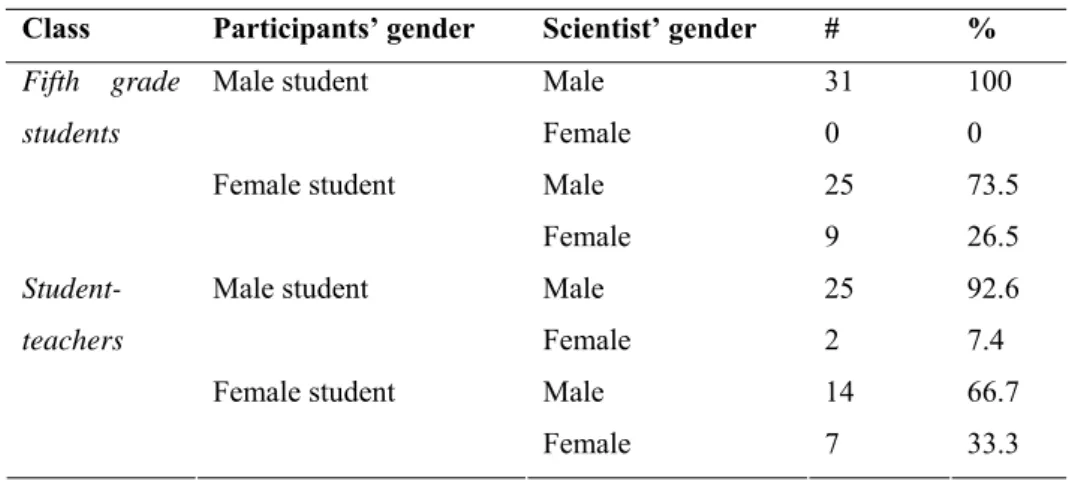
Table 2 shows the overall data for the “gender” variable. All fifth grade male students depicted a male scientist, while only 9 out of 34 female students drew a female scientist. Student teachers’ data results were similar to those of the fifth grade students. Therefore, no significant differences were found between the groups.
Table 2 The Numbers And The Percentages Of Fifth Grade Elementary School Students’ And Senior Student Teachers’ Drawings Of Scientists’ Gender
Class Participants’ gender Scientist’ gender # % Male 31 100 Male student Female 0 0 Male 25 73.5 Fifth grade students Female student Female 9 26.5 Male 25 92.6 Male student Female 2 7.4 Male 14 66.7 Student-teachers Female student Female 7 33.3 Age
The category for ‘age’ included three variables: young, middle aged, and old. Student teachers and fifth grade students both imagined middle age scientists (61.5% and 58.3%, respectively). Other than that, among fifth grade students, 24.6% drew a young scientist, whereas 22.9% of student teachers depicted old scientists. Figure 3a and Figure 3b show an example of a drawing of an ‘old scientist’ picture with a walking stick, drawn by a student teacher, and an example of a drawing of a ‘middle aged’ scientist, drawn by a fifth grade student.
Figure 3a Student Teacher’s (BO5) Drawing Figure 3b Fifth-Grade Student’s (D6) Drawing
Analysis of Open-Ended Questions
Participants were asked seven open-ended questions and these were centered on three themes constructed with an iterative process of open coding. The three themes were: (1) definition of a scientist; (2) a scientist you know; and (3) being a scientist. The relative
frequencies of the qualitative data were calculated and converted to a percentage in order to compare the elementary school students’ and the student teachers’ scores.
Definition of a Scientist
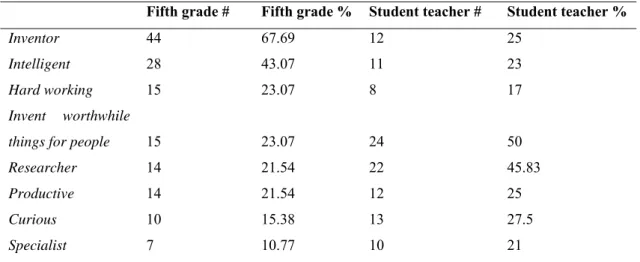
In this question, students were asked the definition of a scientist. Both groups` answers were centered on similar thoughts such as the scientist as an inventor, intelligent, hard working, inventing worthwhile things for people, a researcher, curious, and a specialist in one discipline. Table 3 shows the numbers and percentages of fifth grade elementary school students’ and senior student teachers’ common thoughts on scientists. Apart from this, 18.46% of fifth grade students described scientist working in space, while 39.5% of student teachers defined scientists as unbiased.
Table 3 The Numbers And Percentages Of Fifth Grade Elementary School Students’ And Senior Student Teachers’ Common Thoughts Of Scientist
Fifth grade # Fifth grade % Student teacher # Student teacher %
Inventor 44 67.69 12 25
Intelligent 28 43.07 11 23
Hard working 15 23.07 8 17
Invent worthwhile
things for people 15 23.07 24 50
Researcher 14 21.54 22 45.83
Productive 14 21.54 12 25
Curious 10 15.38 13 27.5
Specialist 7 10.77 10 21
The comparison of the drawings and the answers to the open-ended question about scientists gave interesting results. Student teachers’ drawings of stereotypical scientist - with beard and moustache, glasses and disheveled looking - were reflected in their writings. For instance, student teacher IO7`s definition of a scientist was as follow:
O7- “Scientist is a crazy person who changes the taboos of the society he lives, asks questions, and proves his claims.”
When the same student’s drawing was checked, it was obvious how the picture was consistent with his/her definition of a scientist. In addition, even though significant number of student teachers considered scientists as individuals who follow scientific thinking processes,
they still maintained their stereotypical scientist images. More examples from student teachers descriptive data are as follows:
IO12: “Scientists…run after inventions…usually wears white coat. They make life easy with their inventions; beneficial for people…They do research. Scientists are crazy clever people.” BO11: “Scientists always wear white coats and glasses. They are different from other people because they do research and hypothesis…”
BO22: “Scientists do science. Usually they are with beard and wears glasses…They are curious, suspicious people who have different thoughts from others. It is always easy to recognize them in a society because they look strange.”
Similarly, the majority of fifth grade students thought of scientists as gifted inventors, but only some of them agreed on scientists being an expert in one discipline. None of the fifth grade students imagined a scientist as a fictional character. Only a few students limited their image to that of a scientist working in space. Examples from fifth grade students’ data represented below:
D2- “Scientists are inventors. They work hard. They have big mind. They always invent useful things for people.”
D4- “Scientists are the people who know everything on one subject area…” D7- “Scientists are inventors. They are very curious. Therefore, they…”
D12- Scientists are working on space…They must be very clever. Scientist always invents new technologies…”
Figure 4 Student Teacher’s (IO7) Drawing
·,
A Scientist You Know
In this question, students were asked whether they have ever seen or met a scientist and where. Only six students (9.2%) among fifth grades wrote that they had seen scientists’ pictures in books, or on television, or had met one at a university. In contrast, only 19 student teachers (39.58%) wrote that they met scientists at conferences and universities.
The other question asked about this theme was to name scientists they remembered. Even though student teachers listed more names than fifth grade students did, both group’s answers centered on the inventors that they had learned about in classes. The most favorite scientists among fifth-grades were Edison (46.16%), whereas the most favorite scientists among student teachers were Einstein (77.08%). The other favorite scientists among fifth grades were as follow: Alexander Graham Bell, Archimedes, Pasteur and Newton. Even though student teachers favorite scientists included some famous Turkish scientists, their lists were similar to those of the fifth grade students. Student teachers’ most favorite scientists were as follows: Ibn-i Sina, Oktay Sinanoglu, Newton, Piaget, Freud, Archimedes, Mendel, Pasteur, Galileo, Ali Kuscu, Pavlov, Alexander Graham Bell and Socrates.
Being a Scientist
In this theme, the first question was ‘can everybody be a scientist, and why?’ Nearly half of the fifth grade students (43.08%) thought that, if one studies hard and has enough intellect, there is no difficulty in being a scientist. On the other hand, only 27.08% of student teachers wrote that only if one has a good education and studies systematically can one be a scientist.
Two more questions were asked to students to understand if they consider universities as a home of scientists, and if they know the differences between scientists and inventors. The questions were as follows: (1) Do you want to be a scientist? Why?; (2) Do you want to be a research assistant in Physics, Chemistry, Biology, Art, Technology or some other disciplines? Why?
More than half of the fifth grade students (60%) answered both questions “yes”, whereas less than a quarter (23.07%) of student teachers answered “yes”. Even though 50% of student teachers thought that they could be a research assistant at a university, they did not think that they could be a scientist. An example from student teacher (IO9) data is shown below:
IO9- “Scientists organizes and constructs knowledge. They are the people who follow scientific thinking processes like problem solving and experimentations. We can meet scientists at the universities, in the laboratories or in our daily lives. They try to understand and teach us the nature of human beings and universe.”
Student IO9’s definition of a scientist was logical, but s/he listed only inventors’ name (e.g., Edison, Galileo) when asked his/her favorite scientists. Even though s/he wrote that one could meet scientists at universities, s/he could not list any scientists from his/her own university. Moreover, the same student believed that s/he could be a research assistant at the university, but s/he did not think s/he could be a scientist. Student IO9’s answers for the question, “do you want to be a scientist?”, was as follows:
IO9- “I do not think because I have no patience and I have no inventions.”
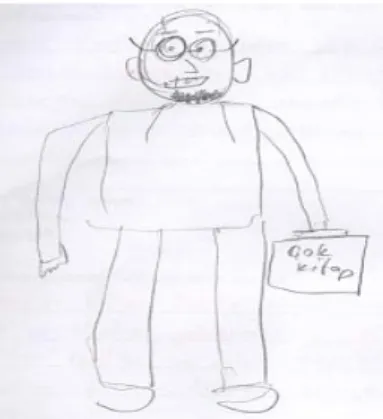
What is more, student IO9’s drawing (see Figure 5) was also consistent with his/her writing. His/her perception of a scientist was stereotypical.
Figure 5 Student Teacher’s (IO9) Drawing
Even though fifth grade students did not differentiate between scientists and inventors, the majority of them believed that they could be a scientist if they studied hard. In addition, fifth grade students D8 and D9 thought that being a research assistant is a preparation for being a scientist.
D9- “…If I want, I can be a scientist but I already have to do something related to science. I do not think scientist have to be gifted. If one gives importance to science and study hard, there is no reason not to be a scientist.”
Discussion
The results of the study showed that senior student teachers’ perception of scientists were more stereotypical than were the fifth grade elementary school students’ perceptions. In other words, student teachers generally depicted scientists with glasses, beard and moustache, a white coat and a disheveled appearance. Earlier studies also claimed that, as children progress through successively higher-grade levels, their images of scientists become more and more stereotypical. By the fifth grade, the “image” has fully emerged (Chambers, 1983; Schibeci & Soremen, 1983). However, those studies were only conducted with elementary school children. In contrast, the current study’s results show that student teachers’ images of scientists were far more stereotypical than those of the elementary school children. The outcome of the study is engrossing because, in only one year’s time, those student teachers could be working as classroom teachers. The other interesting result for student teachers was that, even though they were at university, the majority of them claimed that they had not met a scientist.
The results showed that students in both groups tended to draw a male scientist. Interestingly, one fifth grade student (Y24) even wrote, “I cannot be a scientist because I am
not a man, I am a girl”. Pioneering research also supported this result; for instance only 28
male students out of 4,807 drew female scientists (Chambers, 1983). In another large sample study, only 135 out of 1,600 drawings were female scientists although 60% of the participants were female (Fort & Varney, 1989). Even after instruction regarding the importance of female scientists, students still tended to draw male scientists (e.g., Flick, 1990; Huber & Burton, 1995; Mason, Kahle & Gardner, 1991). In contrast, Barrow (2000) conducted research about the image of psychologists with students at a private women’s college enrolled in Basic Psychology classes. Many students (39.6%) saw the psychologist as a female rather than a stereotypical male. Barrow claimed that this was the result of students having chosen to attend a private women’s college, and that a requirement of every course in this particular college was the inclusion of a section in the course about women in the discipline. Moreover, in a recent study Steinke et. al. (2007) stated that boys were more likely than girls to draw male scientists, and girls were more likely than boys to draw female scientists. Boys also were
more likely to depict other stereotypes of scientists. Media sources were listed as the primary source of information for the drawings.
Another interesting result of this study was that the fifth grade students imagined scientists in their working environment. On their drawings, they depicted scientist studying in the laboratory and doing research in space. Research with elementary school students by Barman (1997) noted that 88% of students drew scientists working in a laboratory. But, what was different for the present study was that fifth grade Turkish students imagined scientist not only studying in the laboratory but also doing research in space. Moreover, even though the earlier study had confirmed the same results with adults (Barman, 1999), the current study showed totally opposite outcomes with student teachers. As with previous studies, both groups’ favorite scientists were centered on Einstein and Edison, but unlike the previous studies (Moseley&Norris, 1999; Song&Kim, 1999), none of the Turkish students depicted scientists as fictional characters.
Finally, the results showed that fifth grade students were closer to the idea of being a researcher and a scientist than student teachers. In addition, some fifth grade students thought that being a research assistant in a university is the first step toward becoming a scientist. However, even though nearly half of the student teachers believed they could be a research assistant, they did not believe they could be a scientist. As a result, student teachers imagined scientists as inventors who live and think differently than other people.
The number of participants might be considered as a limitation for the study. However, the study provided promising insight and evidence for that even though today’s education programs are framed to encourage the idea of being scientists, scientific thinking and a scientific society, student teachers’ perceptions of scientists were surprising considering that they could be classroom teachers in less than a year’s time. Moreover, the study was designed to point to importance of encouraging scientific thinking for whole education life and integrated into everyday life rather than generalizing the results.
Implication For Science Education
The results of the study might be used to foster a positive image of scientists in students’ minds. In science education, one goal would be to make scientists more ‘real’ for students and to make it more plausible for students to see themselves in the role of a scientist (King & Bruce, 2003). When one asks elementary school students what they want to be in the future, the majority of them say doctors or teachers; this may be the result of the children mainly having been in contact with these professions since birth.
Therefore, the results of this study can be used to suggest experiences for students that will build positive images of scientists. For instance, teachers can invite scientists to the science classes, mention being a scientist when teaching about occupations, and organize field trips to see science in action, in addition to internships, student research projects, and hands-on laboratory activities. Moreover, the experiences should be of a greater variety of scientists, and discussions should include the barriers and opportunities for women and minorities in the sciences. These experiences will provide students with an opportunity to see themselves in the role of scientists.
Classroom teachers can also use this task as an activity. Teachers can ask students to draw a picture of a mathematician, a doctor, a botanist, or an astronomer at the beginning of the related chapter and save the drawings. At the end of the chapter, the teacher can conduct the same drawing and questioning activity and compare the results with the students. Thus, students can observe and share the change in their perceptions of several occupations, especially those related to science.
Reference
Barman, C. R. (1997). Students’ views of scientists and science: Results from a national study. Science and Children, 35(1), 18-24.
Barman, C. R. (1999). Completing the study: High school students’ views of scientists and science. Science and Children, 36(7), 16-21.
Barrow, R. (2000). Determining stereotypical images of psychologist: The draw a psychologist checklist. College Student Journal, 34(1), 123-133.
Bovina, I. B. & Dragul’Skaia, I. U. (2008). College students’ representations of science and the scientist. Russian Education and Society, 50(1), 44-64.
Buldu, M. (2006). Young children’s perceptions of scientists: A preliminary study.
Educational Research, 48(1), 121 – 132.
Chambers, D. W. (1983). Stereotypical images of the scientist: The Draw-A-Scientist Test.
Science Education, 67(2), 255-265.
Finson, K. D. & Beaver, J. B. (1995). Development and field test of a checklist for the draw-a-scientist test. School Science and Mathematics, 95(4), 195-206.
Flick, L. (1990). Scientist in residence program improving children's image of science and scientists. School Science and Mathematics, 90(3), 204-214.
Fort, D.C. & Varney, H. L. (1989). How students see scientists: Mostly male, mostly white, and mostly benevolent. Science and Children, 26(8), 8-13.
Fralick, B., Kearn, J., Thompson, S., & Lyons, J. (2009). How middle schoolers draw engineers and scientists. Journal of Science Education & Technology, 18(1), 60-73. Huber, R. A. & Burton, G. M. (1995). What do students think scientists look like? School
Science and Mathematics, 95(7), 371-377.
Kaya, O. N., Dogan, A. & Ocal, E. (2008). Turkish elementary school students’ images of scientists. Egitim Arastirmalari-Eurasian Journal of Educational Research, 32, 83-100. King, M. D. & Bruce, M. C. (2003). Inspired by real science. Science and Children, 40(5),
30-34.
MacCorquodale, P. (1984, August). Self-image, science and math: Does the image of the
"scientist" keep girls and minorities from pursuing science and math? Paper presented
at the 79th annual meeting of the American Sociological Association, San Antonio, TX. Mason, C. L. & Kahle, J. B. (1989). Student attitudes toward science and science-related
careers: A program designed to promote a stimulating gender-free learning environment. Journal for Research in Science Teaching, 26, 25-39.
Mason, C. L., Kahle, J. B. & Gardner, A. L. (1991). Draw-A-Scientist Test: Future implications. School Science and Mathematics, 91(5), 193-198.
Mead, M. & Metraux, R. (1957). The image of the scientist among high school students: A pilot study. Science, 126(3270), 384-390.
Moseley, C. & Norris, D. (1999). Preservice teachers’ views of scientists. Science and
Children, 37(1), 50-56.
Odell, M.R.I., Hewitt, P., Bowman, J. & Boone, W.J. (1993, April). Stereotypical images of
scientists: A cross-age study. Paper presented at the 41st annual national meeting of the
National Science Teachers Association, Kansas City, MO.
Painter, P. & Tretter, T. R. (2006). Pulling back the curtain: Uncovering and changing students’ perceptions of scientists. School Science and Mathematics, 106(4), 181-190. Rosenthal, D. B. (1993). Images of scientists: A comparison of biology and liberal studies
majors. School Science and Mathematics, 93(4), 212-216.
Ross, K.E.K. (1993, April). The role of affective and gender influences on choice of college
science major. Paper presented at the 41st annual national meeting of the National
Science Teachers Association, Kansas City, MO.
Rubin, E. & Cohen, A. (2003). The images of scientists and science among Hebrew-and Arabic-speaking pre-service teachers in Israel. International Journal of Science
Schibeci, R. A. & Riley, J. P. (1986). Influence of students' background and perceptions on science attitudes and achievement. Journal of Research in Science Teaching, 23, 177-187.
Schibeci, R.A. & Sorensen, I. (1983). Elementary school children's perceptions of scientists.
School of Science and Mathematics, 83(1), 14-19.
She, H. C. (1998). Gender and grade level differences in Taiwan students’ stereotypes of science and scientists. Research in Science and Technology Education, 16, 125-135. Sheffield, L. J. (1997). From Doogie Howser to dweebs - or how we went in search of Bobby
Fischer and found that we are dumb and dumber. Mathematics Teaching in the Middle
School, 2(6), 376-379.
Song, J. & Kim K. S. (1999). How Korean students see scientists: the images of the scientist.
International Journal of Science Education, 21(9), 957-977.
Steinke, J., Lapinski, M. K., Crocker, N., Zietsman-Thomas, A., Williams, Y., Evergreen, S. H. & H Kuchibhotla, S.(2007). Assessing media influences on middle school-aged children's perceptions of women in science using the draw-a-scientist test (DAST).
Science Communication, 29(1), 35-64.
Strauss, A. L. & Corbin, J. (1990). Basics of Qualitative Research: Grounded Theory
Procedure and Techniques. Newbury Park, CA: Sage.
Symington, D. & Spurling, H. (1990). The 'Draw a Scientist Test': Interpreting the data.
Research in Science and Technological Education, 8(1), 75-77.
Tuckman, B. W. (1999). Conducting educational research (5th ed.). New York: Harcourt Brace College Publishers.
Appendix A
1- Let`s say one of your friend do not know who is scientist? How do you tell him or her?
(Diyelim bir arkadaşın bilim insanı kimdir, kime denir hiç bir fikri yok. Ona bilim insanını nasıl tarif edersin?)
2- According to you what should be the characteristics of scientist? (Sence bilim insanının özellikleri neler olmalı?)
3- Have you ever seen or met a scientist? If yes, where was it?
(Bu güne kadar hiç bir bilim insanı ile karşılaştın mı veya tanıştın mı? Eğer evet ise, nerede?)
4- Can every one be a scientist? Why? (Herkes bilim insanı olabilir mi? Neden?)
5- Can you be a scientist or want to be a scientist? Why?
(Sen bilim insanı olabilir misin veya olmak ister misin? Neden?) 6- Can you write me the names of a few scientists come to your mind?
(Bana aklına gelen bir kaç bilim insanı ismi yazabilir misin?)
7- Do you want to be a researcher in physics, chemistry, biology, art, technology or some other disciplines in your future? Why?
(İleride fizik, kimya, biyoloji, matematik, kültür-sanat, teknoloji veya başka alanlarda araştırmacı olmak ister misin? Neden?)
---
Would you please draw me the picture of a scientist in your thoughts? Keep in your mind this is not a drawing competition ☺ Just use your lines on the first impulse. (Lütfen bana düşüncelerindeki bilim insanını çizer misin? Unutma bu bir resim yarışması değil ☺ Lütfen içinden geldiği gibi kullan çizgilerini)