UHOD
Correlation of Clinical Risk Factors with
Diffusion-Weighted Magnetic Resonance Images
in Prostate Cancer Patients Treated
with Definitive Radiotherapy
Gurcan ERBAY1, Cem ONAL2, Ozan C. GULER2, Elif KARADELI1, Zafer KOC1
1 Baskent University Faculty of Medicine, Department of Radiology, Ankara
2 Baskent University Faculty of Medicine, Adana Research and Treatment Centre, Department of Radiation Oncology,
Adana, TURKEY ABSTRACT
This study is aimed to correlate apparent diffusion coefficient (ADC) values and clinical T-stage, serum PSA, pathology Gleason scores. We also further analyzed whether ADC values could be used to appropriately define the risk groups. 135 biopsy-proven, radiotherapy-(RT)-treated, prostate cancer patients who underwent pre-RT DW-MRI and standard T2W pelvic MRI were included. ADC and normalized ADC (nADC) values were calculated from DW-MRI delivered a median 8.1 weeks after prostate biopsy. ADC values were correlated with clinical risk factor values by using Pearson correlation test. ADCs in low-, intermediate-, and high-risk patients were 0.873±0.122X10⁻³ mm2/s, 0.763±0.124X10⁻³ mm2/s, and 0.701±0.132X10⁻³ mm2/s (p= 0.001), respectively. Patients
with preRT PSA <10 ng/mL had significantly higher ADCs than patients with preRT PSA 10–20 ng/mL (p= 0.02) or >20 ng/mL (p< 0.001). Mean ADC for patients with Gleason score <7 was significantly higher than patients scoring 7 (p= 0.001) or >7 (p < 0.001). Clinical stage <T2b patients had significantly higher ADC values versus stage T2b (p=0.001) and T2b tumors (p< 0.001). ADC dem-onstrated stronger correlation with NCCN risk groups (R=–0.510; p< 0.001). All clinical factors except Gleason score had moderate inverse correlation with nADC. Best nADC correlation occurred with NCCN risk groups (R=-0.461; p< 0.001). ADCs measured by DW-MRI are noninvasive prognostic markers of clinical parameters and risk for prostate cancer in RT candidates.
Keywords: Prostate cancer, Diffusion-weighted MRI, Risk factors, Apparent diffusion coefficient, Prognostic factor ÖZET
Definitif Radyoterapi ile Tedavi Edilen Prostat Kanserli Hastalarda Klinik Risk Faktörleri ve Difüzyon Ağırlıklı Manyetik Rezonans Görüntülerinin İlişkisi
Bu çalışmanın amacı klinik T evresi, serum prostat spesifik anijen (PSA) ve patolojik Gleason skoru ile apparent diffusion coef-ficient (ADC) değerlerinin ilişkisini araştırmak. Ayrıca ADC değerlerinin risk gruplarının tanımlanması için uygun olup olmayacağını analiz edilmiştir. Definitif radyoterapi (RT) ile tedavi edilen, tedavi öncesi DA-MRG ve standart T2 ağırlıklı MRG’si olan 135 prostat kanserli hasta çalışmaya dahil edildi. Prostat biyopsisinden medyan 8.1 hafta sonra çekilen DA-MRG’ lerden ADC ve normalize edilmiş ADC (nADC) değerleri ölçüldü. ADC değerleri ve klinik risk faktörleri arasındaki ilişkiyi araştırmak için Pearson korelasyon testi kullanıldı. Düşük, orta ve yüksek risk hastalarda ADC değerleri sırası ile 0.873±0.122×10⁻³ mm2/s, 0.763±0.124×10⁻³ mm2/s
ve 0.701±0.132×10⁻³ mm2/s (p = 0.001) idi. RT öncesi PSA değerleri <10 ng/mL olan hastalar, RT öncesi PSA değerleri 10-20 ng/
mL (p= 0.02) veya >20 ng/mL (p< 0.001) olan hastalara göre istatistiksel olarak anlamı derecede yüksek ADC değerlerine sahipti. Gleason Skoru <7 olan hastalar için ortalama ADC skoru, gleason 7 (p = 0.001) veya >7 (p < 0.001) olanlara göre anlamlı derecede yüksekti. Klinik evre <T2b olan hastaların ADC değerleri, evre 2b (p= 0.001) ve >2b (p < 0.001) hastalara göre anlamlı derecede daha yüksekti. ADC değerleri National Compheresive Cancer Network (NCCN) risk grupları ile kuvvetli bir korelasyon gösterdi(R=–0.510; p< 0.001). Gleason skoru hariç tüm klinik faktörler nADC değeri ile ılımlı ters bir korelasyon içindeydi. nADC’ nin en iyi korelasyonu NCCN risk grupları ileydi. (R=–0.461; p< 0.001). DA-MRG ile ölçülen ADC değerleri, RT planlanan prostat kanserli hastalarda önemli bir non invaziv prognostik belirteç olarak değerlendirilebilir.
UHOD
INTRODUCTION
Prostate cancer is mostly an indolent tumor with slow disease progression. However one of six men had prostate cancer, but only one of 36 patients died with disease. Treatment strategies include watchful waiting, radical prostatectomy, or ra-diotherapy (RT) with or without hormonotherapy, depending on disease stage and risk factors.1-3 The
challenge of managing localized prostate cancer is to distinguish patients who may benefit from radi-cal treatment from patients who do not need any intervention. Furthermore, in patients treated with RT, treatment strategies depend on clinical param-eters and, notably, risk groups.
Currently, serum prostate-specific antigen (PSA), clinical T stage, and Gleason scoring are used for defining prostate cancer risk.4,5 These risk factors
have been used to predict the biochemical relapse after surgery or RT, and these parameters are also used to make treatment choices. Additionally, PSA doubling-time and PSA density are used to predict disease outcome, but they are nonspecific in de-termining diseases prognosis.6,7 To predict tumor
biological behavior, histological evaluation of the prostate is required. However, histological evalu-ation involves invasive biopsy procedure(s) and is subject to sampling error. Furthermore, histo-pathological findings of prostatectomy and biopsy specimens do not always accurately reflect actual disease status.8,9 There may be discordance
be-tween clinical and pathological staging, and Glea-son scores of biopsy and prostatectomy specimens may vary. For this reason, a thorough evaluation of entire prostate is essential before performing definitive RT, in which histopathological evalua-tion is based on prostate biopsy only, and staging is performed with clinical and radiological findings. Non-invasive methods to evaluate the entire pros-tate and the tumor biology before performing RT may be a promising alternative. Moreover, this ap-proach would allow optimized treatment delivery to adequately stratified patient risk groups.
The best method of imaging prostate cancer is en-dorectal T2-weighted magnetic resonance imaging (MRI), which has 60-82% sensitivity and 55-70% specificity for detecting cancer.10-12 Additionally,
recent studies have aimed to determine the value of
MR correlates of cellular density, metabolite con-centration, and tumor vascularization for predict-ing tumor aggressiveness.13-16 Diffusion-weighted
MRI (DW-MRI) is advantageous in tumor locali-zation.17-19 DW-MRI may also provide qualitative
information regarding the pathophysiological char-acter of prostate cancer.18,20,21 DW-MRI is sensitive
to the microscopic motion of water molecules and allows biological characterization of tissues based on their water-diffusion properties. The degree of diffusion is quantified as the apparent diffusion co-efficient (ADC).
Few clinical studies involving limited patient num-bers have evaluated the potential value of pre-pros-tatectomy DW-MRI as a non-invasive marker of disease aggressiveness.22,23 This study assessed the
potential importance of ADC values obtained from DW-MRI in prostate cancer patients treated with definitive RT. Additionally; we analyzed the cor-relation between ADC values and clinical T-stage, serum PSA levels, and Gleason scores. We further analyzed whether ADC values could be used to ap-propriately define the risk groups.
PATIENTS AND METHODS Study Design and Patient Population
This retrospective study was approved by Baskent University Institutional Review Board (Project No #KA13/146) and was supported by the Baskent University Research Fund. The requirement for receipt of written informed consent was waived due to the retrospective nature of this study and because all patient-identifying information was an-onymized. All study protocols adhered to the tenets of the Declaration of Helsinki. We reviewed the re-cords of 135 patients with biopsy-proven prostate cancer at the Baskent University Faculty of Medi-cine who were treated with curative intent using definitive RT between January 2012 and August 2013 and who had undergone both DW-MRI and standard T2W pelvic MRI before RT.
Patients were stratified into three risk groups ac-cording to the National Comprehensive Cancer Network (NCCN) guidelines.24 The low-risk group
contained patients with T1-T2a tumor, Gleason score <7, and PSA<10 ng/mL; intermediate-risk
UHOD
patients were T2b tumor, Gleason score= 7, and
PSA 10-20 ng/mL; and high-risk patients were ≥T3a tumor, Gleason score >7, and PSA >20 ng/ mL. Pre-RT MRI scans were performed a median 8.1 weeks (range 4.3-34.1 weeks) after initial pros-tate biopsy and cancer diagnosis.
Magnetic Resonance Imaging
For all patients, T2W, fat-saturated T2W, DWI, and Dynamic Contrast Imaging- (DCE)-MRI exam were performed using a 1.5 T Siemens Avanto® MR scanner used as an 8-element, phased-array coil during the scans, without an endorectal coil. T2W images were acquired with a fast spin-echo sequence: repetition time/echo time (TR/TE)= 5480/55 ms, acquisition matrix 224×320, field of view (FOV)= 220 cm, slice thickness 4 mm, and intersection gap 1.6 mm. Fat-saturation turbo spin echo sequence imaging parameters were: TR/ TE= 5480/55 ms, echo train length= 40, acquisi-tion matrix 224×320, FOV= 220 cm, slice thick-ness=1.6 mm. DW-MRI scans were performed using a multi-slice, single-shot, spin-echo, planar imaging (SE-EPI) sequence (FOV= 365 cm, slice thickness= 4mm, EPI-factor= 192, intersection gap= 0 mm, TR/TE= 4400/83 ms, acquisition ma-trix= 192×100, 4 averages, sense factor= 2 in the
anterior-posterior direction. The b-values of 0, 200, 600, and 1000 s/mm² were used to calculate ADC. The ADC maps were generated automatically us-ing multi-exponential data fittus-ing with manufac-turer’s software (syngo.via; Siemens Healthcare, Erlangen, Germany). The DCE-MRI protocol consisted of a three-dimensional, spoiled-gradient echo sequence (3 mm section thickness, TR/TE= 6.7/3.14 ms, flip angle 100, FOV= 200 cm,
acquisi-tion matrix= 154×256. For DCE imaging, a dose of 0.1 mL/kg gadoterate meglumine (Dotarem®; Guerbet Group, LLC., Villepinte, France) was in-jected at 2mL/s, followed by a saline flush.
Data Analysis
Prostate cancer localization was determined by consensus of the two experienced genitourinary radiologists (≥20-years experience) based on a comparison of digital rectal examination findings, pathologic biopsy results with four-quadrate and 12 core biopsy, and the presence of focal low-sig-nal-intensity areas in the peripheral and/or transi-tion zones on ADC maps, with using T2W. ADCs were determined and maps created using Siemens workstation software syngo.via. Diagnostic crite-ria of prostate cancer in MRI findings were: fo-cal area(s) revealing low signal intensity on T2W images and focal lesion restriction on ADC maps,
UHOD
early contrast enhancement with fast washout, and high blood vessel permeability on dynamic con-trast-enhanced images.25,26 Additionally, prostate
tumors were seen as hyperintense lesions with high b-values.
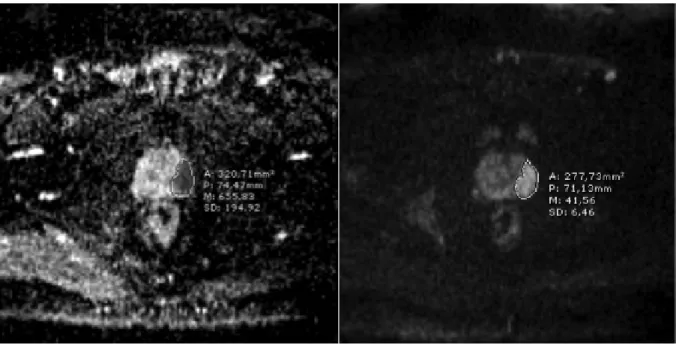
First, both hyperintense lesions at high b-values (especially b= 800 or b= 1000) and lesion with diffusion restriction on ADC maps were, when co-localized in the same area, determined to be focal prostatic cancer lesions (Figure 1). Before RT, re-gions of interest (ROIs) of the tumors in the periph-eral and/or transition zones were drawn on ADC maps to include as much of the tumor as possible, calculations were performed twice in the same site, and the average of these two values was calculated. If a tumor was located in several ADC map im-aging slices, ADC values were measured on both the biggest and the most homogenous regions of the same slice. When the ROIs were drawn, great care was taken to exclude both the neurovascular bundle and the urethra to reduce ADC calculation error. For measuring ADC values in the peripheral and/or transition zones of benign tissue, ROIs at the contralateral side of the tumor were selected. Additionally, the normalized ADC (nADC) was calculated as the ratio of tumor ADC to normal prostate tissue ADC.
Statistical Analysis
Statistical analyses were performed using SPSS software version 20 (SPSS Inc./IBM, Chicago, IL). Clinical risk factors including Gleason score, clinical T-stage, and serum PSA level were cate-gorized into three groups. A paired Student t-test and an independent samples t-test with Bonfer-roni correction were used to assess differences between groups. Pearson correlation analysis was performed between ADCs, nADCs, and clinical risk factor values. Receiver operating character-istic (ROC) analysis was performed to assess the power of tumor ADC and nADC in discriminating between low-, intermediate-, and high-risk groups and a cut-off value for this parameter was deter-mined. A p value of <0.05 was considered indica-tive of statistically significant differences.
RESULTS
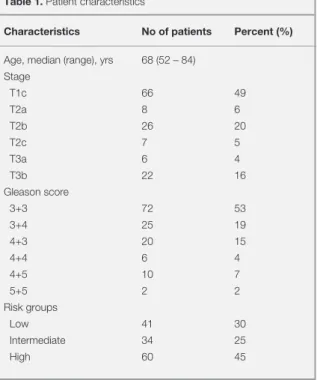
Patient characteristics are summarized in Table 1. Almost half of the patients had clinical stage T1c tumors or Gleason score 3+3 tumors. Again almost one-third of patients were stratified into the low-risk group, while the remaining two-thirds of pa-tients were in the intermediate- or high-risk group. The overall mean and median serum PSA levels were 23.3±8.0 ng/mL and 12.6 ng/mL (range 1.6– 119.6 ng/mL), respectively.
ADC Measurements
The mean tumor ADC and nADC values were (0.773±0.141) ×10−3 mm2/s and (0.581±0.122)×10−3
mm2/s, respectively. The ADC values in the
cen-tral and peripheral normal prostate tissue were (1.321±0.156)×10−3 mm2/s and (1.338±0.152)×10−3
mm2/s, respectively.
Correlation with Serum PSA
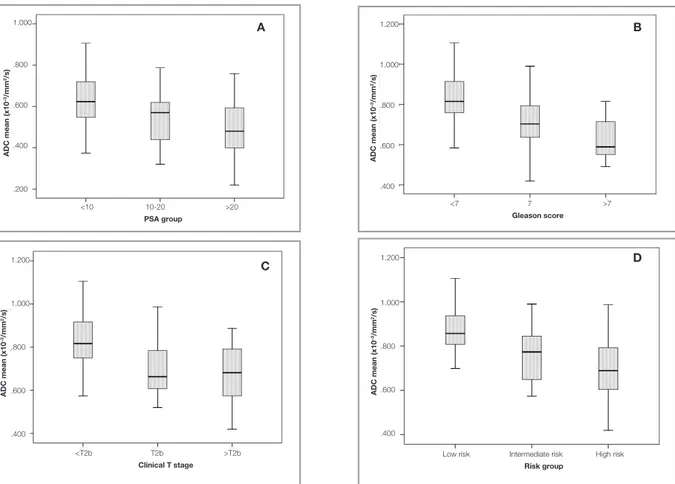
The mean ADC values for PSA groups <10 ng/mL, 10-20 ng/mL and >20 ng/mL were (0.836±0.122)×10−3 mm2/s, (0.751±0.130)×10−3
mm2/s, and (0.690±0.141)×10−3 mm2/s,
respec-tively (Figure 2A). Patients with low preRT PSA levels <10 ng/mL had significantly higher ADC
Table 1. Patient characteristics
Characteristics No of patients Percent (%)
Age, median (range), yrs 68 (52 – 84)
Stage T1c 66 49 T2a 8 6 T2b 26 20 T2c 7 5 T3a 6 4 T3b 22 16 Gleason score 3+3 72 53 3+4 25 19 4+3 20 15 4+4 6 4 4+5 10 7 5+5 2 2 Risk groups Low 41 30 Intermediate 34 25 High 60 45
UHOD
values compared to patients with preRT PSA 10-20
ng/mL (p= 0.02), and PSA >20 ng/mL (p < 0.001). However there was no significant difference be-tween ADC values of patients with intermediate PSA 10–20 ng/mL and PSA >20 ng/mL (p= 0.2) levels.
Correlation with Tumor Gleason Scores
The mean ADC for patients with Gleason scores <7 (0.829±0.119×10⁻³/mm2/s) was
significant-ly higher than in patients with Gleason score 7 (0.720±0.135×10⁻³ mm2/s; p= 0.001) and
pa-tients with Gleason score >7 (0.624±0.109×10⁻³
mm2/s; p< 0.001) (Figure 2B). However, the
dif-ference between Gleason score 7 and Gleason score >7 approached statistical significance (p= 0.08).
Correlation with Tumor Stage
Patients with clinical stage <T2b tumors had sig-nificantly higher ADC values (0.832±0.117×10⁻³
mm2/s) compared to patients with stage-T2b
tu-mors (0.708±0.135×10⁻³ mm2/s; p= 0.001), and
stages >T2b tumors (0.673±0.127×10⁻³ mm2/s; p
< 0.001) (Figure 2C). However there was no sig-nificant difference between ADC values of patients with clinical stage T2b tumor and >T2b tumors (p= 0.6).
Correlation with NCCN Risk Groups
We stratified patients into risk groups based on composites of Gleason score, serum PSA lev-els, and tumor stage. The ADC values in low-, intermediate-, and high-risk patient groups were (0.873±0.122)×10−3 mm2/s, (0.763±0.124)×10−3
mm2/s, and (0.701±0.132)×10−3 mm2/s,
respective-ly (Figure 2D). The differences between all paired risk group comparisons were significant.
Figure 2. ADC values measured in diffusion-weighted magnetic resonance imaging before radiotherapy according to (A) PSA levels, (B) Gleason scores (C) clinical T-stage, and (D) risk groups.
ADC mean (x10 –3/mm 2/s) 1.000 .800 .600 .400 .200 ADC mean (x10 –3/mm 2/s) 1.200 1.000 .800 .600 .400 ADC mean (x10 –3/mm 2/s) 1.200 1.000 .800 .600 .400 ADC mean (x10 –3/mm 2/s) 1.200 1.000 .800 .600 .400
Low risk Intermediate risk High risk
Risk group <10 10-20 >20 PSA group <7 7 >7 Gleason score <T2b T2b >T2b Clinical T stage A D B C
UHOD
Normalized ADC Measurements
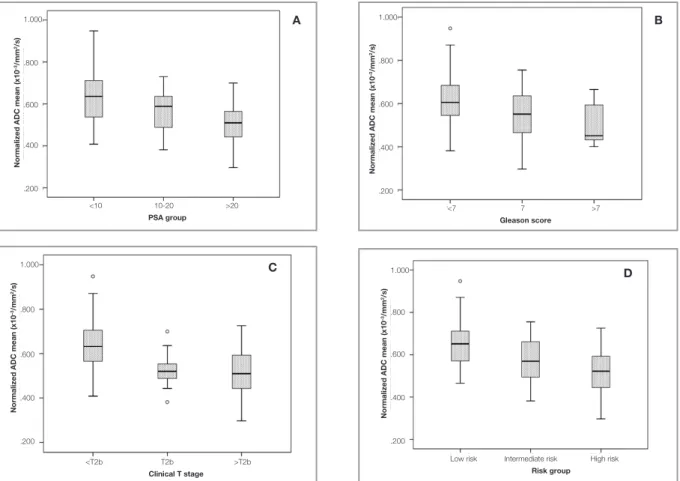
The mean nADC values for PSA groups <10 ng/ mL, 10-20 ng/mL, and >20 ng/mL were 0.63, 0.57, and 0.51, respectively (Figure 3A). The only significant difference in nADC values existed be-tween patients with PSA <10 ng/mL versus pa-tients with PSA >20ng/mL (p= 0.001). The mean nADC for patients with Gleason score <7 (0.62) was significantly higher than patients with Gleason score 7 (0.55; p= 0.04) and patients with Gleason score >7 (0.50; p= 0.03) (Figure 3B). However, the nADC difference between Gleason score 7 and Gleason score >7 groups did not reach statistical significance (p= 0.6). Patients with clinical stage <T2b tumors had significantly higher nADC val-ues (0.63) compared to patients with clinical stage T2b tumors (0.53; p= 0.04) and stage >T2b tumors (0.51; p= 0.001) (Figure 3C). However, there was no significant difference between nADC values of patients with clinical stage T2b tumors versus >T2b
tumors (p= 0.9). The nADC values in the low-, in-termediate-, and high-risk patients were 0.66, 0.58, and 0.52, respectively (Figure 3D). The nADC differences between low- versus intermediate-risk groups (p= 0.04), and low- versus high-risk groups (p< 0.001) were significant. No significant differ-ence in nADCs existed between the intermediate- and high-risk groups.
Correlation Between Clinical Factors
Significant and inverse moderate correlations be-tween all clinical factors and ADCs were observed (Table 2). The ADC demonstrated the best correla-tion with the NCCN risk groups (Pearson=-0.510; p< 0.001). All clinical factors except the Gleason score were inversely and moderately correlated with nADCs. As with the ADC, the best correla-tion with nADC was observed with the NCCN risk groups (Pearson=–0.461; p< 0.001).
Figure 3. Normalized ADC values measured in diffusion-weighted magnetic resonance imaging before radiotherapy according to (A)
PSA levels, (B) Gleason scores (C) clinical T-stage, and (D) risk groups. <10 10-20 >20
PSA group
<7 7 >7
Gleason score
Low risk Intermediate risk High risk
Risk group <T2b T2b >T2b Clinical T stage 1.000 .800 .600 .400 .200
Normalized ADC mean (x10
–3/mm 2/s)
Normalized ADC mean (x10
–3/mm 2/s) 1.000 .800 .600 .400 .200 1.000 .800 .600 .400 .200
Normalized ADC mean (x10
–3/mm 2/s) 1.000 .800 .600 .400 .200
Normalized ADC mean (x10
–3/mm 2/s) D C B A
UHOD
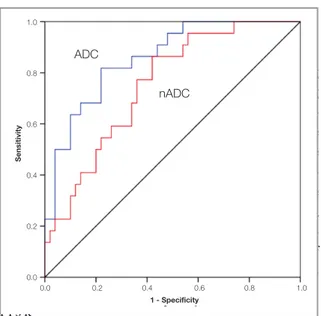
ROC analysis
Fig- u r e 4 shows the ROC curve analyzing
ADC and nADC in discriminating
the low-risk group with the intermedi-ate- or high-risk groups. The area under the curve was 0.857 (p< 0.001; 95% confidence interval: 0.769–0.946) for ADC measure-ments, and 0.802 (p= 0.001; 95% confidence i n - terval: 0.637-0.865) for nADC values. For a 79% risk-prediction accuracy, an ADC cut-o f f cut-of 0.802×10⁻³/mm2/s gave a sensitivity of
82% and specificity of 78%. Also, for a 68% r i s k
-prediction accuracy, a nADC cut-off value of 0.59 gave a sensitivity of 68% and specificity of 66%.
DISCUSSION
This study demonstrates that ADC values can dis-tinguish between among the clinical parameters and define risk factors that are used when select-ing RT strategies for treatselect-ing prostate cancer. In low-risk patients, prostate RT is adequate treat-ment, whereas in intermediate- and high-risk pa-tients, hormone therapy is delivered concurrently with RT. Additionally, negative correlations were found between ADC values and clinical param-eters including serum PSA level, clinical T-stage, and Gleason score.
Water diffusion characteristics are substantially affected by cellular and structural changes within tissues, including cell density, vascularity and mi-crovascular tortuosity, extracellular fluid viscosity, membrane permeability between intra- and extra-cellular compartments, active transport and flow, and directionality of tissue/cellular structures that impede water mobility.27 These cellular and
struc-tural differences exist between low- and high-risk lesions, and they can be measured non-invasively in vivo using DW-MRI, which constructs images based on quantifying water molecule diffusion within tissues.28
The ADC is a quantitative parameter of the ex-tent of water molecule diffusion. Due to increased cellularity, decreased extracellular space, and ab-normal microvasculature, tumor ADCs are gener-ally lower than surrounding normal tissues. Fur-thermore, ADC values can potentially be used to predict tumor aggressiveness.22,29,30 Bae et al.22
demonstrated that prostate cancer patients with a Gleason score ≥4+3, larger tumors (≥16 mm), and highly proliferating cancers had significantly low-er ADC values in 29 patients treated with radical prostatectomy. Oto et al.29 found a moderate
nega-tive correlation between Gleason score (r –0.376, p= 0.001) and tumor ADC values in 73 prostate cancer patients treated with radical prostatectomy. In 39 patients treated with radical prostatectomy, Thörmer et al.21 found that nADC could be used as
a valuable surrogate for predicting tumor aggres-siveness. deSouza et al.23 demonstrated significant
differences in ADC values between patients at low-risk and those with higher-risk localized pros-tate cancer. We evaluated more patients compared to these previous studies, and we demonstrated a significant correlation between ADCs and diverse clinical parameters and NCCN risk groups.
Figure 4. Receiver operating characteristic curve analysis in
risk group prediction according to ADC and nADC.
Table 2. Correlation between ADC, nADC and clinical prognostic parameters
ADC nADC Parameter Pearson correlation p Pearson correlation p
coefficient coefficient PSA -0.443 <0.001 -0431 <0.001 Gleason score -0.496 <0.001 -0.351 <0.001 Clinical T stage -0.501 <0.001 -0.430 <0.001 Risk groups -0.510 <0.001 -0.461 <0.001 Sensitivity 1.0 0.8 0.6 0.4 0.2 0.0 0.0 0.2 0.4 0.6 0.8 1.0 1 - Specificity ADC nADC
UHOD
All patients had been treated with definitive RT. Therefore, we could not perform a detailed anal-ysis of histopathological correlations with ADC values. In some cases, there may be discordance between histopathological findings in biopsy and prostatectomy specimens. Previous studies have shown significant pathologic upgrading at radical prostatectomy, with reported upgrading percent-ages ranging from 20.3%-54%.15 This potentially
creates a problem with accurately identifying and monitoring patients who are erroneously catego-rized as having low-risk disease before surgery. For defining NCCN risk groups, patients were stratified according to Gleason score, serum PSA level, and clinical T-stage. Although ADC values are known to correlate with tissue structure, the NCCN criteria rather than Gleason score were used to define risk groups, to reduce the effects of bi-opsy sampling variability and reflect that our ADC values were averaged over the whole tumor ROI. Averaging ADCs over the ROI is a limitation, as it does not account for ADC differences within the tumor itself; therefore, correlation of these differ-ences with histopathology would be useful. Further study of DW-MRI in localized prostate cancer is also warranted to assess its correlative utility in relation to tumor histopathology and clinical out-comes.
Although several study evaluated ADCs for deter-mining tumor aggressiveness, few studies defined the cut-off values to predict high-grade cancer foci.21-23 Bae et al.22 determined the cut-off ADC
value of 0.52×10⁻³ mm2/s as having low- versus
high-grade tumors. deSouza et al.23 found that
ADC cut-off values of 1.33×10⁻³ mm2/s
(sensitiv-ity 89%, specific(sensitiv-ity 58%) and 1.20×10⁻³/mm2/s
(sensitivity 55%, specificity 95%) provided 70% of risk prediction. Thörmer et al.21 defined nADC
values below 0.46 as the threshold for tumors with intermediate or high aggressiveness. The ADC cut-off values may vary between studies because of different enrolled patient numbers and varied ADC measurement techniques. In our study we evaluat-ed both ADC and nADC values. We found that for 70% risk prediction, an ADC cut-off of 0.802×10⁻³
mm2/s gave a sensitivity of 82% and specificity of
78%, and a nADC cut-off value of 0.59 gave a sen-sitivity of 68% and specificity of 66%. Although
our ADC and nADC cut-off values were higher than previously reported findings, our results may be more reliable because we studied larger number of patients.
ADC value measurement has not been standard-ized yet. In some studies, minimum ADC values were correlated with tumor biological
aggressive-ness31,32, whereas other researchers used mean
ADC values as a surrogate for tumor aggressive-ness.22,33 Although there is intratumoral
heteroge-neity in prostate cancer, we used the mean ADC values. However, to minimize ADC measurement error, ADC was measured on much larger tumor volumes that previously studied, by averaging ADC maps of several imaging slices.
The main limitation of T2W imaging is false posi-tivity for low-signal intensity lesions, where infec-tion, inflammainfec-tion, and fibrosis may mimic the tumor. In this study, to diminish false results, the radiologists delineating the ROI were aware of the tumor localization that was verified with biopsy. However, on post-biopsy T2W images, hemor-rhage has low signal intensity that can mimic the tumor and lead to inaccurate measurements.27 In
previous studies analyzing the importance of ADC in prostate cancer patients22,23, the MRI scans were
delivered before prostate biopsy, which makes the result more accurate. We evaluated the patients be-fore initiation of RT, and MRI scans were all taken before RT with biopsy proven prostate cancer. In suspected cases, T1W images of the whole pelvis were taken at the same time to differentiate hemor-rhage and minimize artifactual error introduction into ADC measurements.
A major limitation of this study is the lack of cor-relating tumor ROIs with whole-mount histopa-thology sections, because all patients in this study were treated with definitive RT. In the high-risk cohort, all lesions were large and easily discern-ible on T2W imaging, so the likelihood of error in ROI selection is low. In the low-risk cohort, where all lesions were verified with biopsy data, the ADC values were likely to have been indistinguishable from adjacent non-malignant prostate tissue. In these cases, the lack of a visually identifiable lesion on the ADC map is also an indicator of the low-risk nature of the lesion. A more problematic feature is
UHOD
that we used the averaged ADC from the entire
tumor region, and this was often heterogeneous. It may be that the more diffusion-restricted areas within the tumor region are ultimately more pre-dictive of outcome. Also, the absolute cut-off val-ues for the ADC and nADC have not yet been ap-propriately defined and standardized, because prior studies used different measurement techniques and were prone to inter-observer variability. The im-ages in our study were interpreted by consensus of two readers rather than by separate analyses. The purpose of this study, however, was not to assess ADC diagnostic accuracy for predicting localized prostate cancer by DW-MRI but to correlate the ADC values with clinical rsik factors using 1.5T MRI. Another study limitation was that all patient underwent transrectal sonography guided-biopsy with pretreatment MR examination, which might have had potential effects on subsequent ADC measurement due to hemorrhage or inflammatory changes in the normal prostate tissue.
In conclusion, DW-MRI offers potential to evalu-ate prostevalu-ate cancer patients treevalu-ated with definitive RT, where complete histopathological evaluation of the entire prostate is not possible. We found that ADC values measured using DW-MRI can noninvasively determine clinical parameters and risk groups for prostate cancer patients that have prognostic significance. However, further work is needed to conclusively determine the clinical sig-nificance of using ACDs to define risk groups and to evaluate treatment responses after definitive RT for prostate cancer.
REFERENCES
1. Heidenreich A, Bastian PJ, Bellmunt J, et al. EAU guidelines on prostate cancer. Part II: Treatment of advanced, relapsing, and castration-resistant prostate cancer. Eur Urol 65: 467-79, 2014.
2. Onal C, Topkan E, Efe E, et al. The effect of concurrent an-drogen deprivation and 3D conformal radiotherapy on pros-tate volume and clinical organ doses during treatment for prostate cancer. Br J Radiol 82: 1019-26, 2009.
3. Chism DB, Hanlon AL, Horwitz EM, et al. A comparison of the single and double factor high-risk models for risk assignment of prostate cancer treated with 3D conformal radiotherapy. Int J Radiat Oncol Biol Phys 59: 380-5, 2004.
4. Albertsen PC, Hanley JA, Gleason DF, et al. Competing risk analysis of men aged 55 to 74 years at diagnosis managed conservatively for clinically localized prostate cancer. JAMA 280: 975-80, 1998.
5. Vickers AJ, Thompson IM, Klein E, et al. A Commentary on PSA Velocity and Doubling Time for Clinical Decisions in Prostate Cancer. Urology 83: 592-98, 2014.
6. Hegde JV, Mulkern RV, Panych LP, et al. Multiparametric MRI of prostate cancer: an update on state-of-the-art techniques and their performance in detecting and localizing prostate cancer. J Magn Reson Imaging. 37: 1035-54, 2013. 7. Truesdale MD, Cheetham PJ, Turk AT, et al. Gleason score
concordance on biopsy-confirmed prostate cancer: is patho-logical re-evaluation necessary prior to radical prostatecto-my? BJU Int107: 749-54, 2011.
8. Kupka R, Dall’oglio MF, Sant’ana AC, et al. Can single posi-tive core prostate cancer at biopsy be considered a low-risk disease after radical prostatectomy? Int Braz J Urol 39: 800-7, 2013.
9. Shoji S, Hiraiwa S, Endo J, et al. Manually controlled targeted prostate biopsy with real-time fusion imaging of multipara-metric magnetic resonance imaging and transrectal ultra-sound: An early experience. Int J Urol 22:173-8, 2015. 10. Tilak G, Tuncali K, Song SE, et al. 3T MR-guided in-bore
transperineal prostate biopsy: A comparison of robotic and manual needle-guidance templates. J Magn Reson Imaging, (in press) 2014.
11. Le JD, Tan N, Shkolyar E, et al. Multifocality and prostate cancer detection by multiparametric magnetic resonance im-aging: correlation with whole-mount histopathology. Eur Urol 67: 569-76, 2015.
12. Hambrock T, Somford DM, Huisman HJ, et al. Relationship between apparent diffusion coefficients at 3.0-T MR imaging and Gleason grade in peripheral zone prostate cancer. Radi-ology 259: 453-61, 2011.
13. Kobus T, Hambrock T, Hulsbergen-van de Kaa CA, et al. In vivo assessment of prostate cancer aggressiveness using magnetic resonance spectroscopic imaging at 3 T with an endorectal coil. Eur Urol 60: 1074-80, 2011.
14. Turkbey B, Shah VP, Pang Y, et al. Is apparent diffusion coef-ficient associated with clinical risk scores for prostate cancers that are visible on 3-T MR images? Radiology 258: 488-95, 2011.
15. Watanabe Y, Nagayama M, Araki T, et al. Targeted biopsy based on ADC map in the detection and localization of pros-tate cancer: a feasibility study. J Magn Reson Imaging. 37: 1168-77, 2013.
16. Song I, Kim CK, Park BK, et al. Assessment of response to radiotherapy for prostate cancer: value of diffusion-weighted MRI at 3 T. Am J Roentgenol 194: 477-82, 2010.
UHOD
17. Quentin M, Schimmoller L, Arsov C, et al. Increased signal intensity of prostate lesions on high b-value diffusion-weight-ed images as a prdiffusion-weight-edictive sign of malignancy. Eur Radiol 24: 209-13, 2014.
18. Onal C, Sonmez S, Erbay G, et al. Simultaneous integrated boost to intraprostatic lesions using different energy levels of intensity-modulated radiotherapy and volumetric-arc therapy. Br J Radiol 87: 20130617, 2014. doi: 10.1259/bjr.20130617 19. Wu LM, Xu JR, Ye YQ, et al. The clinical value of diffusion-weighted imaging in combination with T2-diffusion-weighted imaging in diagnosing prostate carcinoma: a systematic review and meta-analysis. Am J Roentgenol 199: 103-110, 2012. 20. Thormer G, Otto J, Horn LC, et al. Non-invasive estimation
of prostate cancer aggressiveness using diffusion-weighted MRI and 3D proton MR spectroscopy at 3.0 T. Acta Radiol 56: 121-128, 2015.
21. Bae H, Yoshida S, Matsuoka Y, et al. Apparent diffusion co-efficient value as a biomarker reflecting morphological and biological features of prostate cancer. Int Urol Nephrol 46: 555-561, 2013.
22. deSouza NM, Riches SF, Vanas NJ, et al. Diffusion-weighted magnetic resonance imaging: a potential non-invasive marker of tumour aggressiveness in localized prostate cancer. Clin Radiol 63: 774-782, 2008.
23. Mohler J, Bahnson RR, Boston B, et al. NCCN clinical prac-tice guidelines in oncology: prostate cancer. J Natl Compr Canc Netw 8: 162-200, 2010.
24. Engelbrecht MR, Puech P, Colin P, et al. Multimodality mag-netic resonance imaging of prostate cancer. J Endourol 24: 677-684, 2010.
25. Park SY, Kim CK, Park BK, et al. Early changes in apparent diffusion coefficient from diffusion-weighted MR imaging dur-ing radiotherapy for prostate cancer. Int J Radiat Oncol Biol Phys 83: 749-755, 2012.
26. Jung AJ, Westphalen AC. Imaging prostate cancer. Radiol Clin North Am 50: 1043-1059, 2012.
27. Bratan F, Niaf E, Melodelima C, et al. Influence of imaging and histological factors on prostate cancer detection and localisa-tion on multiparametric MRI: a prospective study. Eur Radiol 23: 2019-2029, 2013.
28. Oto A, Yang C, Kayhan A, et al. Diffusion-weighted and dy-namic contrast-enhanced MRI of prostate cancer: correlation of quantitative MR parameters with Gleason score and tumor angiogenesis. Am J Roentgenol 197: 1382-1390, 2011. 29. Woodfield CA, Tung GA, Grand DJ, et al. Diffusion-weighted
MRI of peripheral zone prostate cancer: comparison of tu-mor apparent diffusion coefficient with Gleason score and percentage of tumor on core biopsy. Am J Roentgenol 194: 316-322, 2010.
30. Liu W, Turkbey B, Senegas J, et al. Accelerated T2 mapping for characterization of prostate cancer. Magn Reson Med 65: 1400-1406, 2011.
31. Foltz WD, Chopra S, Chung P, et al. Clinical prostate T2 quantification using magnetization-prepared spiral imaging. Magn Reson Med. 64: 1155-1161, 2010.
32. Haider MA, Chung P, Sweet J, et al. Dynamic contrast-en-hanced magnetic resonance imaging for localization of recur-rent prostate cancer after external beam radiotherapy. Int J Radiat Oncol Biol Phys 70: 425-430, 2008.
Correspondence
Dr. Cem ÖNAL
Baskent Üniversitesi Tıp Fakültesi Adana Araştırma ve Tedavi Merkezi Radyasyon Onkolojisi Anabilim Dalı 01120 Balcalı
ADANA / TURKEY
Tel: (+90-322) 344 44 44 / 1304 Fax: (+90-322) 3444445 E-mail: [email protected]