See discussions, stats, and author profiles for this publication at: https://www.researchgate.net/publication/350185504
Life Satisfaction, Pro-Activity, and Employment Article in The Singapore Economic Review · March 2021
DOI: 10.1142/S0217590821500132 CITATIONS 0 READS 22 4 authors, including:
Some of the authors of this publication are also working on these related projects:
Türkiyede COVID19 Pandemisinin Tüketici Davranışı Üzerine Etkileri ve Alınması Gereken Önlemler: Turizm Sektörü Örneği View project Alpaslan Akay University of Gothenburg 36PUBLICATIONS 770CITATIONS SEE PROFILE Gokhan Karabulut Istanbul University 29PUBLICATIONS 137CITATIONS SEE PROFILE Levent Yilmaz
Turkish-German University / Türk-Alman Üniversitesi 10PUBLICATIONS 10CITATIONS
SEE PROFILE
All content following this page was uploaded by Levent Yilmaz on 19 March 2021.
DISCUSSION PAPER SERIES
IZA DP No. 14117
Alpaslan Akay Gökhan Karabulut Levent Yilmaz
Life Satisfaction, Pro-Activity, and
Employment
Any opinions expressed in this paper are those of the author(s) and not those of IZA. Research published in this series may include views on policy, but IZA takes no institutional policy positions. The IZA research network is committed to the IZA Guiding Principles of Research Integrity.
The IZA Institute of Labor Economics is an independent economic research institute that conducts research in labor economics and offers evidence-based policy advice on labor market issues. Supported by the Deutsche Post Foundation, IZA runs the world’s largest network of economists, whose research aims to provide answers to the global labor market challenges of our time. Our key objective is to build bridges between academic research, policymakers and society.
IZA Discussion Papers often represent preliminary work and are circulated to encourage discussion. Citation of such a paper should account for its provisional character. A revised version may be available directly from the author.
Schaumburg-Lippe-Straße 5–9
53113 Bonn, Germany Email: [email protected]: +49-228-3894-0 www.iza.org
IZA – Institute of Labor Economics
DISCUSSION PAPER SERIES
ISSN: 2365-9793 IZA DP No. 14117
Life Satisfaction, Pro-Activity, and
Employment
FEBRUARY 2021
Alpaslan Akay
University of Gothenburg and IZA
Gökhan Karabulut
Istanbul University
Levent Yilmaz
ABSTRACT
IZA DP No. 14117 FEBRUARY 2021
Life Satisfaction, Pro-Activity, and
Employment
*Using longitudinal data from the German Socio-Economic Panel (GSOEP), this paper investigates how pro-active time-use (e.g., in sports/arts/socializing) relates to subjective well-being of the unemployed and their probability of finding a new job. Allowing for a variety of socio-demographic and -economic observed characteristics, we find that pro-activity is negatively associated with the well-being loss upon unemployment. That is, the negative unemployment shock on their well-being is mitigated through various stress-reducing activities including, in particular, art participation, socializing, going on trips, and visiting a church. We also find that the probability of returning to the labor market later is positively associated with proactivity during the unemployment period. The results are robust to various checks including estimators, measures, and individual personality characteristics which can correlate with time-use activities.
JEL Classification: I31, J64, J69
Keywords: life satisfaction, pro-activity, employment, labor markets
Corresponding author: Alpaslan Akay Department of Economics University of Gothenburg PO Box 100, SE-405 30 Vasagatan 1 Gothenburg Sweden E-mail: [email protected]
* We sincerely thank Guido Friebel, Michael Kosfeld, Wiebke Homann for their valuable ideas and comments. We have also benefited from many helpful comments by workshop and seminar participants at the Goethe-University Frankfurt and University of Innsbruck. Financial support from the German Research Foundation DFGANR project (FR2822/1-1) is gratefully acknowledged.
2
1. Introduction
There is a vast literature, both in economics and in psychology, on the negative effects of unemployment on individuals’ subjective well-being (SWB hereafter). Overall, SWB (measured in life satisfaction or happiness) of unemployed individuals is significantly lower than that of employees (for an overview see e.g., Feather, 1990; Hartley, 1980; Darity and Goldsmith, 1996; Eichhorn, 2013; Richter et al. 2020). Another strand of literature also suggests that the loss in well-being upon unemployment continues during the course of unemployment period (e.g., Björklund, 1985; Clark and Oswald, 1994; Winkelmann and Winkelmann, 1998; Lucas et al. 2004; Kassenboehmer and Haisken-DeNew, 2009; Green, 2011; Wulfgramm, 2014; Grün et al., 2010; Helliwell and Huang, 2014; Chen and Hou, 2019). There are several attempts in the literature that aim to explain why unemployment leads to such a large reduction in well-being (Jahoda, 1982; Warr, 1987; Goldsmith et al., 1996; Paul and Moser, 2009). To this end, the theory of ‘latent function’ suggested by Jahoda (1982) gives a general overview and states that individuals have a need for employment because it satisfies five important psychological functions including time structure, social contact, collective purpose, social identity/status, and activity. Therefore, the absence of these functions during unemployment might lead to lower SWB (e.g., Feather and Bond, 1994; Wanberg et al. 1997; McKee-Ryan et al., 2005; Paul and Moser, 2009; Goodman et al., 2017).1
1 There is bulk of studies investigating how ‘latent functions’ relate to the well-being of unemployed.
Paul and Moser (2009) find that when people lose their job, they also lose some dimensions of latent functions, and their well-being and mental health declines. McKee-Ryan et al. (2005) show that individuals who keep higher levels of ‘time structure’ maintain higher levels of well-being during unemployment. Using alternative scales to measure latent functions (see, e.g., Bond and Feather, 1988; Feather and Bond, 1994) several studies show that maintaining time structure helps to mitigate the negative effects of unemployment representing a coping resource for buffering the negative consequences of unemployment. Indeed, Wanberg et al. (1997) use TSQ (Time Structure Questionnaire) and GHQ (General Health Questionnaire) and find that unemployed individuals have lower level of time structure leading lower levels of mental health (see also McKee-Ryan et al., 2005).
3
Certainly, life satisfaction depends on several personal or other external influences. The reduction in well-being during unemployment might be strongly related to these circumstances and also how unemployed individuals use their available time during their unemployment period. One important question in the literature is how the frequency and types of pro-active2 time-use of individuals during their unemployment
period can absorb the negative effect of unemployment on their well-being. Moreover, a related question is that whether the likelihood of returning to labor market is higher among the unemployed who are more pro-active during their unemployment period. Using long panels of unemployed individuals, this study investigates how the frequency and types of pro-active time-use of these individuals (e.g., in sport/exercise activities, participating in art, going out for drinking/eating and socializing with friends/family, visiting church among many others) relate to their life satisfaction and their likelihood of finding a new job.
The conceptual framework in our analysis focuses on the relationship between the frequency of alternative time-use activities and the well-being of individuals. Indeed, recent well-being literature suggests a close link between pro-activity and SWB. Wang et al. (2019) show pro-active personality is positively related to life satisfaction in general. Jawahar and Liu (2017) also find that pro-active people are more satisfied with their jobs, career, and life in general (c.f., Prabhu, 2007; Li et al., 2010). Carrying this idea forward, we argue that the level of well-being might differ among unemployed individuals depending on what they do and how they spend their time during the unemployment period. That is, the pro-active unemployed individuals might use their activities to compensate for the lack of latent functions (e.g. concentrating on sports,
2 In this paper, we use the term ‘pro-activity' in a very broad sense. This term summarizes all activities
that have goal-oriented positive effects, for instance, positive impacts on health (e.g., sports), education (i.e., cultural activities), social contact or skills (i.e., visiting friends/family) (e.g. Stebbins, 1982; Fryer and Payne, 1984; Waters and Moore, 2002).
4
arts, or socializing more). Knabe et al. (2010) already show that even though unemployed individuals feel worse compared to employed people who are engaged in similar activities, the former are able to equalize this difference by spending time on more enjoyable activities. Focusing on the type and length of activities, the existing small literature also suggests that pro-active unemployed individuals are less affected by psychological deprivation during unemployment (e.g., Fryer and Payne, 1984; Evans and Haworth, 1991; Haworth and Ducker, 1991; Allan et al., 2018). In addition, there are alternative approaches on how time-use activities might relate to well-being of unemployed. For instance, Waters and Moore (2002) investigate the role of ‘meaningful’ leisure activities which reduce the negative effects of unemployment. It is documented that ‘active’ or ‘meaningful’ leisure (Stebbins, 1982) activities lead to a larger improvement of well-being among the unemployed compared to ‘passive’ activities (e.g. watching television). Schmiedeberg and Schröder (2017) also find that meeting with friends, doing sports and going to vacation contributes positively to life satisfaction while watching TV negatively relates with life satisfaction. Lechner and Leopold (2015) find that higher frequency of church attendance moderates the reduction in life satisfaction due to unemployment.
Using long panels of SWB from 1984 to 2009 (German Socio-Economic Panel - GSOEP), this paper first investigates whether the well-being loss due to unemployment is significantly absorbed by pro-active time-use and which types of activities are more effective in compensating for the well-being loss. Secondly, we direct our attention to how the reemployment probability of individuals is associated with the frequency and type of pro-active time-use during their unemployment period. The results in this paper can be summarized as follows. We first show that individuals who are pro-active during their unemployment period indeed have a higher level of overall life satisfaction, which is used as a proxy for SWB in this paper. The most important activities for well-being
5
are the ones correlated with lower levels of stress including sports/exercise, arts/music, going out/trips, socializing, and church-going. The results are highly in line with the idea that unemployed individuals compensate for the lack of psychological functions due to lack of work with pro-active time-use. Yet, we find that pro-active time-use only partially compensates the well-being loss due to unemployment. Finally, our paper demonstrates that the likelihood of finding a job is higher when individuals use their time pro-actively during their unemployment period. The results are robust with respect to estimators and measures. Allowing for first differences in life satisfaction or panel data fixed-effects with and without time-variant personality measures hardly affects the overall results.
The paper is organized as follows: Section 2 gives a description of the dataset, empirical strategies, and potential econometric concerns. In Section 3, empirical results are presented. The section is going to first present the role of pro-active time-use on change in the life satisfaction upon unemployment and then discuss how pro-active time-use activities relate to the probability of reemployment. Finally, the last section concludes and presents a discussion on the results.
2. Data and Empirical Methods
2.1. Data, Measures, and Sample Selection
We use the German Socio-Economic Panel (GSOEP) dataset, which has been conducted annually since 1984. This dataset has been used in several well-being studies in the literature (see, e.g., Ferrer-i-Carbonell, 2005; Akay et al., 2017). It is highly representative of the entire German population. It includes about 12,000 households with more than 25,000 individuals each wave. GSOEP is one of the longest panels that
6
includes well-being information. We use 26 waves from 1984 to 2009. One of the key properties of the dataset is that it includes a rich set of variables that can make this study feasible. These variables include personal socio-demographic and -economic characteristics, household structure, health, labor market conditions, employment, income, and education information as well as pro-active time-use and SWB measures. The dataset includes information for West and East Germany. It is also shown that the attrition in the panel is very low (Knies and Spiess, 2007). To alleviate bias due to age-related confounders, we restrict our sample to people aged 18 to 65 years old. The sample is also restricted to individuals who are not out of the labor force. Depending on the empirical strategy and the sample defined, the analysis will involve different sample sizes as we describe below.
Subjective Well-Being Information. The dependent variable used in this study is
based on the ‘life satisfaction’ measure. The information about life satisfaction is obtained using the following question: “In conclusion, we would like to ask you about
your satisfaction with your life in general. How satisfied are you with your life, all things considered?” The answers are collected on an 11-point ordinal scale from 0
(“completely dissatisfied”) to 10 (“completely satisfied”). This measure has been extensively used as a proxy for the individuals’ SWB (e.g., Ferrer-i-Carbonell, 2005; Akay et al., 2017; 2020). It is also considered to be a reliable proxy for the individuals (experienced) utility (e.g., Kahneman and Sugden, 2005; Krueger and Schkade, 2008; Oswald and Wu, 2010). Life satisfaction is also found to be correlated with mental health measures (e.g., GHQ-12) and other proxies of SWB (Clark and Oswald, 1994).
Measures of Pro-Active Time-Use. Individuals state how often they participate in
social and cultural activities, such as taking part in a sport or visiting the opera. The dataset includes a large set of measures to proxy these sorts of activities. In our
7
empirical analysis, we use 11 different types of time-use activities which are measured in different waves of our data (see Appendix A1 for information about the full set of activities and the waves in which they are measured).
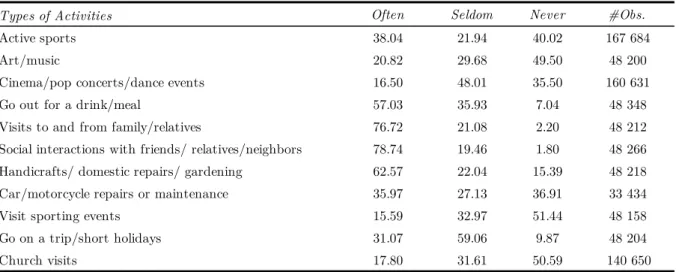
The time-use frequencies are measured using the following generic question: “Now some
questions about your free-time. Please indicate how often you take part in each activity: daily, at least once a week, at least once a month, seldom or never?” We present the
actual frequencies in Table 1 for each activity. The final column presents the number of observations specific to each activity. To simplify the scales and diminish cells with a low number of observations, we merge choices daily, at least once a week, at least
once a month into one high frequency category: ‘often’. We also note that the sample
sizes are different as some activities are asked in different waves of the dataset.
Table 1. Types of pro-active time-use and their frequencies (%)
Notes: Authors’ own calculations from the GSEOP (1984-2009). See also Appendix A1 for further details.
Types of Activities Often Seldom Never #Obs.
Active sports 38.04 21.94 40.02 167 684
Art/music 20.82 29.68 49.50 48 200
Cinema/pop concerts/dance events 16.50 48.01 35.50 160 631
Go out for a drink/meal 57.03 35.93 7.04 48 348
Visits to and from family/relatives 76.72 21.08 2.20 48 212
Social interactions with friends/ relatives/neighbors 78.74 19.46 1.80 48 266
Handicrafts/ domestic repairs/ gardening 62.57 22.04 15.39 48 218
Car/motorcycle repairs or maintenance 35.97 27.13 36.91 33 434
Visit sporting events 15.59 32.97 51.44 48 158
Go on a trip/short holidays 31.07 59.06 9.87 48 204
8
2.2. Empirical Methods
Empirical Strategy: We aim to investigate how the life satisfaction of the
unemployed is associated with the frequency of time-use activities documented in Table 1. Our main strategy is as follows. Let person i be employed during t-1 and get unemployed in time t. We then calculate the life satisfaction difference 𝛥𝐿𝑆!"
experienced by these individuals due to transiting from the state of employmentto the state of unemployment. The dependent variable that we use in our main empirical approach is then given as the following difference in life satisfaction levels.
𝛥𝐿𝑆!" = 𝐿𝑆!#" − 𝐿𝑆!$("&') (1)
The variable 𝐿𝑆!#" measures life satisfaction of individual i when they become
unemployed in time t. 𝐿𝑆!$("&') measures the life satisfaction of individual i while they
are employed in time t-1. 𝛥𝐿𝑆!"is distributed between -10 and +10 since life satisfaction
is measured between 0 (lowest) and 10 (highest). Given the findings in the literature, the sign of 𝛥𝐿𝑆!" is expected to be negative as life satisfaction is expected to be lower
due to the negative shock of unemployment.
The latent life satisfaction is measured on an ordinal scale 𝐿𝑆!" = 𝑗 and thus equation
(1), 𝛥𝐿𝑆!", is also ordinal with 𝐽 = 21 (-10, +10) points ordinal scale. A convenient
model specification in this case is an ordered probit. Yet, the literature suggests that there is only a little difference between a linear model and an ordered probit (Ferrer-i-Carbonell and Frijters, 2004). Thus, we estimate our models with OLS. Yet, results
9
from an ordered probit model are also briefly presented.3 The change in life satisfaction
at the point of t can then be estimated with equation (2).
𝛥𝐿𝑆!" = 𝑋!"𝛽 + 𝛿𝐶!"+ 𝜏"+ 𝜀!"; 𝑖 = 1, … , 𝑁; 𝑡 = 1, … , 𝑇, (2)
where the matrix 𝑋!" contains the information about the level of pro-active time-use
activities. 𝛽 is the parameter for a specific time-use activity. In our econometric
analysis, we estimate equation (2) for 11 different activities in separate regressions. The coefficient 𝛽 of a time-use activity is expected to be negative 𝛽 < 0 if high-frequency
time-use somehow absorbs the negative shock of unemployment on life satisfaction. The model specification controls for a set of SWB determinants 𝐶!", including age,
age-squared, per capita household (post governmental) income, subjective health status (measured in 5-point scale), gender (female = 1), years of education, number of friends, household size, marital status (married/cohabiting, divorced, widowed, or single), and Big-5 personality characteristics4 (e.g., extroversion, openness to experience,
conscientiousness, agreeableness, neuroticism) (McCrae and Costa, 1997). 𝜏" stands for
the year dummies and 𝜀!" is the usual error term. We cluster standard errors within
the individual level.
Unobserved Heterogeneity and Econometric Concerns. In our main empirical
strategy, we test the differences in the life satisfaction of individuals when they become
3 We have estimated alternative models. Indeed, the results of linear and ordered probit models are
highly similar in our case as well. The results from alternative model specification can be reported by authors upon request.
4 The measure is based on 15 subjective questions (see questionnaires in www.diw.de). The respondents
give their opinion about each statement on a 7-point scale where 1 means “it does not apply at all” and 7 “it applies fully”. We then sum three questions for each item in Big-5 and the scales change between 3 and 21. Only two waves (2005 and 2009) in our data include Big-5 questions. We assume that the personality measures are stable at least for a period (McCrae and Costa, 1997). We assign the values of 2005 for all waves before 2005 and assign values of 2009 for years between 2005 and 2009.
10
unemployed. This approach is straightforward, yet it might suffer from endogeneity issues. To deal with the time-invariant confounders, equation (2) already includes personality characteristics (i.e., Big-5). These personality characteristics are expected to capture the correlation between error terms and pro-activity (Boyce and Wood, 2010). Yet, to go a step further, we take another empirical strategy in which we estimate panel data life satisfaction equations so that we can deal with the endogeneity concerns further (Ferrer-i-Carbonell, 2005; Akay et al., 2017). There are three main reasons for this. First, allowing fixed-effects is crucial in this study as endogeneity is one of the important concerns. That is, endogeneity might generate inconsistency in our pooled estimators if pro-active time-use proxies are correlated with the unobserved individual characteristics beyond what personality characteristics can capture. We estimate a fixed-effects model specification in which we allow for the correlation between unemployment, pro-activity, and time-invariant individual effects. Second, in this model specification, we directly estimate the relationship between pro-active use, unemployment, and their interactions to identify the heterogenous effect of time-use on the relationship between unemployment and life satisfaction. Finally, we can also allow time-variant (see footnote 4) Big-5 personality characteristics to capture unobserved individual effects even further in this fixed-effects specification. The model specification reads as follows.
𝐿𝑆!" = 𝑋!"𝛽 + 𝛿𝐶!"+ 𝜏"+𝛼! + 𝜀!"; 𝑖 = 1, … , 𝑁; 𝑡 = 1, … , 𝑇. (3)
The symbols given in equation (3) are the same as in equation (2) except 𝛼! which
stands for the time-invariant unobserved individual effects. Next, we focus on the heterogeneity by different types of pro-activity measures on the relationship between unemployment and life satisfaction. Accordingly, we test the differences in the life satisfaction of unemployed individuals depending on the frequency of different
11
activities. To identify the heterogenous effect of pro-active time-use, we define a dummy variable for each time-use activity as 𝐷!" , indicating whether the individual is
highly active (𝐷!" = 1, active “often”, see Table 1) or not active (𝐷!" = 0, active
“seldom” or “never”, see Table 1). Then, we estimate the linear model (3) by replacing
𝛽= 𝛽)!*)𝐷!"+ 𝛽+,-(1 − 𝐷!") to obtain the heterogeneous effect of unemployment on life satisfaction by low and high activity. To test whether there is a significant heterogeneity, we test the null as 𝐻.: 𝛽)!*) = 𝛽+,-.
3. Results
The strategy of presenting our results is as follows: first, to get a general overview of the selected sample and measures used, we present some statistics and also descriptive results. Second, we present econometric models in which we investigate the change in life satisfaction upon unemployment and also panel data fixed-effects models where we investigate the heterogeneity by pro-active time-use. Finally, we present an additional analysis focusing on the reemployment probability of unemployed in relation to their pro-active time-use.
3.1. Descriptive Analysis
Becoming Unemployed and Life Satisfaction. First, we present some statistics and unconditional results. It is important for our analysis to identify the relationship between unemployment and life satisfaction. There is a bulk of papers in the literature showing that unemployment leads to a large drop in well-being (e.g., Winkelmann and Winkelmann, 1998; Kassenboehmer and Haisken-DeNew, 2009). To show the association between life satisfaction and alternative states of labor market status, we consider four groups of individuals. The first state includes individuals in the last year
12
of their work – next year they all become unemployed. The second stage includes all individuals in their first year of unemployment. The third stage includes all individuals in their last year of unemployment before they return to work. Finally, the last stage includes all individuals in the first year they return to work.
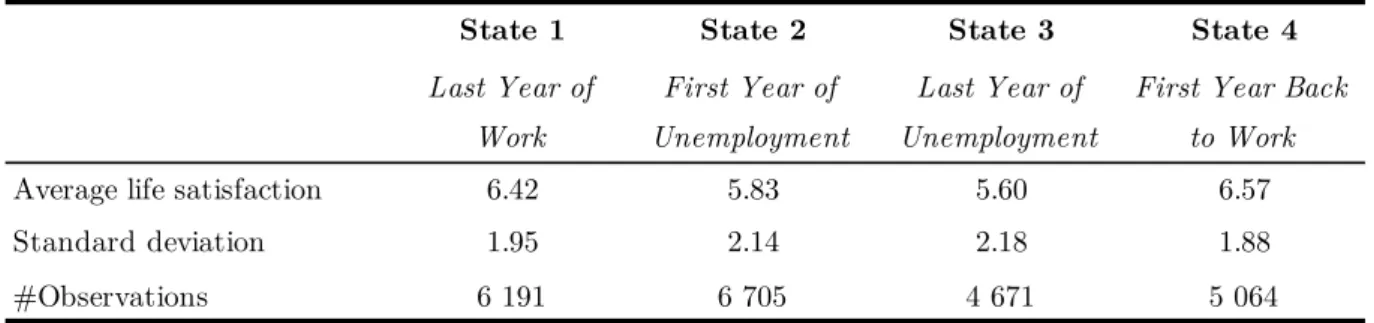
Table 2. Average life satisfaction, unemployment, and reemployment
Notes: Authors’ own calculations from the GSEOP (1984-2009).
Table 2 presents the average life satisfaction of these groups of individuals. We show here the general extent to which life satisfaction changes over two events if individuals’ status changes from being employed to becoming unemployed and vice versa switches. The average life satisfaction is significantly higher in the last year of work (State 1, 6.42) compared with the life satisfaction of individuals in the year in which they become unemployed (State 2, 5.83) (t-test p-value < 0.001). In line with previous studies, average life satisfaction indeed significantly decreases when people lose their job (e.g. Clark and Oswald, 1994; Kassenboehmer and Haisken-DeNew, 2009). Comparing the life satisfaction of the first year of unemployment (State 2) with that of the last year of unemployment (State 3), we find no difference. Life satisfaction increases during the first year after entering the labor market again as expected. Life satisfaction in the last year of unemployment is 5.60 on average. In contrast, in the first year of returning to work individuals have higher life satisfaction on average (6.57). This difference is highly significant based on the usual t-test (p-value < 0.001).
State 1 State 2 State 3 State 4
Last Year of Work First Year of Unemployment Last Year of Unemployment
First Year Back to Work
Average life satisfaction 6.42 5.83 5.60 6.57
Standard deviation 1.95 2.14 2.18 1.88
13
Pro-Activity and Life Satisfaction. Having presented the unconditional relationship between states of employment and life satisfaction, we now turn our attention to the unconditional association between the types of pro-activate time-use and life satisfaction by the frequency of activity. For each type of activity, the proxies measure three different levels of activity: ‘often’ (“daily”, “once a month”, “less than
once a month”), ‘seldom’, and ‘never’ (see Table 1). In the first part of Table 3, we
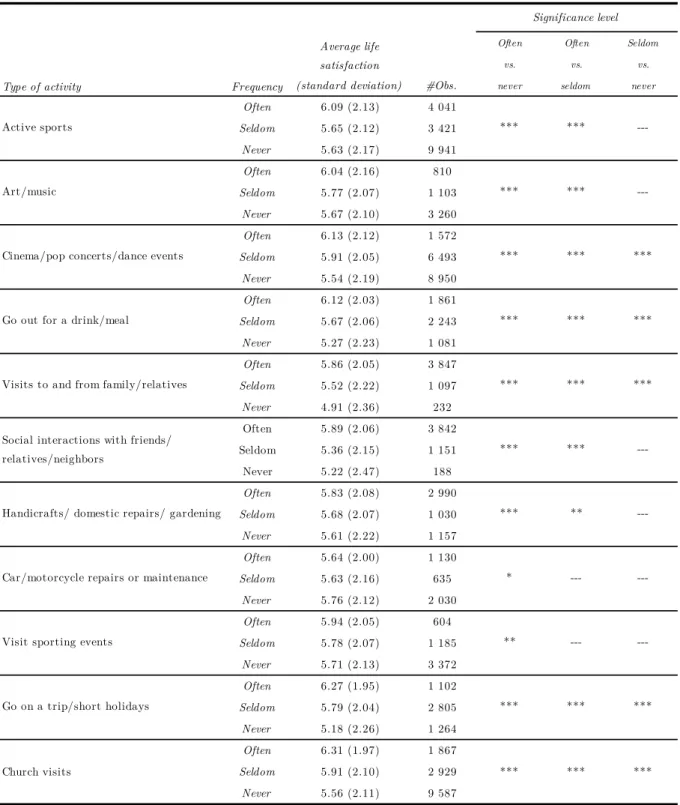
compare the average life satisfaction of unemployed people at these different activity levels for each type of time-use activity. In the second part of Table 3, we give the binary tests that compare the mean satisfaction levels occurring among unemployed people who are highly active ‘often’, partially active ‘seldom’, or not active ‘never’. For instance, the first row of Table 3 shows that unemployed individuals who often participate in ‘active sports’ during their time of unemployment have a life satisfaction of 6.09 on average. The average life satisfaction of these unemployed individuals is significantly higher than the life satisfaction of unemployed individuals who seldom or never participate in active sports; in contrast, the average life satisfaction is only 5.65 for the former group and 5.63 for the latter group (t-test: for both tests p-value < 0.01, two-tailed). We find no significant difference between the individuals who seldom take part in ‘active sports’ and those who never do so. The rest of the results in the table can be interpreted in the same fashion. Overall, we find significant differences at the 1% level between individuals who participate in an activity ‘often’ and individuals who ‘never’ participate in an activity (except car and motorcycle repairs or maintenance (10%) and visiting sporting events (5%)).
14
Table 3. Average life satisfaction of unemployed individuals by time-use activities
Notes: Authors’ own calculations from the GSEOP (1984-2009).
The mean life satisfactions are reported. Standard deviations are in parentheses. *, **, and *** represent significance levels 0.10, 0.05 and 0.01, respectively
A similar result is also obtained when we compare people with activity level ‘often’ and ‘seldom’ except car and motorcycle repairs or maintenance and visiting sporting
Often Often Seldom
vs. vs. vs.
(standard deviation) #Obs. never seldom never
Often 6.09 (2.13) 4 041 Seldom 5.65 (2.12) 3 421 Never 5.63 (2.17) 9 941 Often 6.04 (2.16) 810 Seldom 5.77 (2.07) 1 103 Never 5.67 (2.10) 3 260 Often 6.13 (2.12) 1 572 Seldom 5.91 (2.05) 6 493 Never 5.54 (2.19) 8 950 Often 6.12 (2.03) 1 861 Seldom 5.67 (2.06) 2 243 Never 5.27 (2.23) 1 081 Often 5.86 (2.05) 3 847 Seldom 5.52 (2.22) 1 097 Never 4.91 (2.36) 232 Often 5.89 (2.06) 3 842 Seldom 5.36 (2.15) 1 151 Never 5.22 (2.47) 188 Often 5.83 (2.08) 2 990 Seldom 5.68 (2.07) 1 030 Never 5.61 (2.22) 1 157 Often 5.64 (2.00) 1 130 Seldom 5.63 (2.16) 635 Never 5.76 (2.12) 2 030 Often 5.94 (2.05) 604 Seldom 5.78 (2.07) 1 185 Never 5.71 (2.13) 3 372 Often 6.27 (1.95) 1 102 Seldom 5.79 (2.04) 2 805 Never 5.18 (2.26) 1 264 Often 6.31 (1.97) 1 867 Seldom 5.91 (2.10) 2 929 Never 5.56 (2.11) 9 587
Type of activity Frequency
Significance level
Active sports *** ***
---Average life satisfaction
Art/music *** ***
---Cinema/pop concerts/dance events *** *** ***
Go out for a drink/meal *** *** ***
Visits to and from family/relatives *** *** ***
Social interactions with friends/
relatives/neighbors *** ***
---Handicrafts/ domestic repairs/ gardening *** **
---Car/motorcycle repairs or maintenance * ---
---Visit sporting events ** ---
---Go on a trip/short holidays *** *** ***
15
events.5 The fall in life satisfaction resulting from the loss of work and the pro-activity
is weaker among people who are active ‘seldom’ and ‘never’ active. Descriptive statistics suggest that the results are in line with the theory of pro-active unemployed individuals (Fryer and Payne, 1984) or meaningful activities (Waters and Moore, 2002). The loss in life satisfaction upon unemployment is mitigated by the frequent pro-active time-use during leisure.
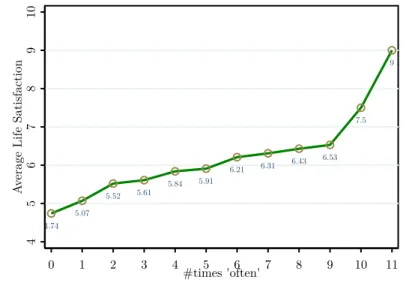
Figure 1: Highly pro-active unemployed individuals and their life satisfaction
Note: The figure is created using the data in Appendix Table A2. The horizontal axis shows the accumulated sum of the times that people often do any of the 11 time-use activities. The vertical axis shows the average life satisfaction.
Another way of showing how high-activity relates to well-being among the unemployed is to focus on how ‘often’ unemployed people do any of the activities. Figure 1 and Table Appendix A2 show the relationship between average life satisfaction and the number of activities unemployed enjoy ‘often’ in their leisure. For example, in 124 cases unemployed individuals never state that they take part in any activity ‘often’. The average life satisfaction of these individuals is 4.97 on average, which is very low
5 This might be explained by the fact that repairs are mostly connected with preceding negative factors
(e.g. the car broke down). With this background, it is not surprising that we find that unemployed individuals who face reparation problems don't have higher life satisfaction.
4.74 5.07 5.52 5.61 5.84 5.91 6.21 6.31 6.43 6.53 7.5 9 4 5 6 7 8 9 10 Av
erage Life Satisfaction
16
compared to the average life satisfaction of 6.96 in the overall sample (the average life satisfaction is about 7 in Germany as shown by several other studies in the literature, cf., Ferrer-i-Carbonell, 2005). Importantly, we observe an increasing trend in the average life satisfaction depending on the number of times an individual participates in an activity ‘often’.6 This positive trend is highly in line with the idea in this paper:
the well-being of unemployed significantly benefits from pro-active time-use activities and these activities might partially or fully mitigate the well-being loss from unemployment. In the analysis below, we are going to investigate this point using econometric models where we control for observed and unobserved characteristics of individuals.
3.2. Pro-Active Time-Use and the Change in Life Satisfaction
Main Results: The unconditional analysis above suggests that there is a strong
positive correlation between the level of life satisfaction and being pro-active during unemployment. In the next step, we investigate this association using econometric strategies described above. We focus on our first strategy where we investigate the change in life satisfaction depending on the change in labor status. In particular, we test whether the negative shock an individual experienced from job loss differs when the individual uses his or her time pro-actively. We now estimate equation (2) for each activity type in a separate regression. To be brief, we only present the parameter estimates of time-use activities 𝛽. The equation is estimated with pooled OLS where
we also control the full set of control variables as well as for the Big-5 personality characteristics. In these regressions, the dependent variable is the change in life satisfaction from the period t - 1 in which individuals work and the period t when they
6 We note that pro-active time use is productive among employed individuals as well. Yet, the pattern
17
became unemployed. The regressions control for the socio-demographic and -economic characteristics usually estimated in well-being regressions (see Dolan et al., 2008). These include age, gender, marital status, years of education, household income, household size, number of kids at home, and most importantly subjective health status (see Appendix A1 for the definition of variables used in the study). Importantly, we also control for whether the unemployed participate in work-related activities in which unemployed individuals are allowed to work, i.e., ‘one-euro/mini job’, as a part of the labor market programs.7
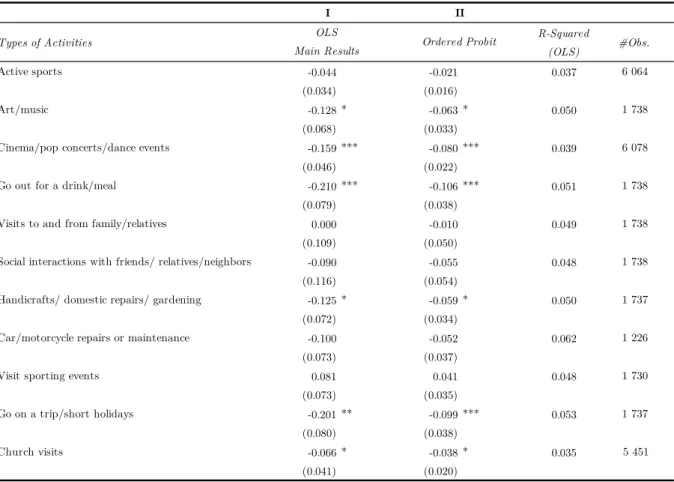
The main results are summarized in Table 4. Column I presents the results from OLS estimation. The models are estimated separately for each time-use activity. First of all, the parameter estimates of all time-use activities are negative. We interpret this as follows: a higher level of pro-active time-use absorbs the negative effect of unemployment on life satisfaction, at least partially. Second, there are several time-use activities that have a statistically significant relationship with the change in life satisfaction experienced upon unemployment. Among them ‘going out to eat/drink’ or ‘going on trips/holidays’ are large in magnitude and are highly statistically significant. They are followed by other stress releasing activities such as going out for ‘cinema/pop concerts/dance events’ and ‘arts/music’. The same holds for activities including handicrafts, gardening and church visits. Column II presents an initial sensitivity check with respect to estimators. This specification considers the fact that change in life satisfaction is an ordered variable. Results from the ordered probit model is virtually
7 Unemployed individuals could participate in state job programs (so-called ‘one-euro jobs’). Besides
students or retirees, in Germany, unemployed people are allowed to work maximum 15 hours a week and to get a total monthly wage of about EUR 160 alongside unemployment benefits. They could also work independently in a ‘mini-job’ (low-paying jobs, e.g. at a fast-food restaurant, at a supermarket or at a call center) and receive a wage of EUR 400 maximum per month. Note also that each euro earned over this exemption reduces the unemployment benefits.
18
the same as OLS. The signs and significance are highly comparable while the magnitudes of these two models cannot be directly compared.
Table 4. Main results I: coefficients of pro-active time-use on change in life satisfaction upon unemployment
Notes: Authors’ own calculations from the GSEOP (1984-2009).
The dependent variable is the change in life satisfaction upon unemployment. Standard errors clustered at within individual level are in parentheses.
The models include age, age-squared, gender (female=1), marital status (married/cohabited, divorced, widowed, single), health status (five dummies from bad health to good health), per capita household income, household size, years of education, one-euro/mini job dummy, number of friends, Big-5 personality characteristics (extroversion, agreeableness, conscientiousness, openness to experience, and neuroticism), and year dummies.
*, **, and *** represent significance levels 0.10, 0.05 and 0.01, respectively
Sensitivity Checks and Unobserved Heterogeneity. We investigate the
sensitivity of our results further with respect to estimators, measures, and endogeneity concerns. At this point, we define an accumulated index of pro-activity, i.e., activity
index, to summarize the time-use frequencies of 11 activities. To this end, we calculate
Types of Activities R-Squared
(OLS) #Obs.
Active sports -0.044 -0.021 0.037 6 064
(0.034) (0.016)
Art/music -0.128 * -0.063 * 0.050 1 738
(0.068) (0.033)
Cinema/pop concerts/dance events -0.159 *** -0.080 *** 0.039 6 078 (0.046) (0.022)
Go out for a drink/meal -0.210 *** -0.106 *** 0.051 1 738 (0.079) (0.038)
Visits to and from family/relatives 0.000 -0.010 0.049 1 738 (0.109) (0.050)
Social interactions with friends/ relatives/neighbors -0.090 -0.055 0.048 1 738 (0.116) (0.054)
Handicrafts/ domestic repairs/ gardening -0.125 * -0.059 * 0.050 1 737 (0.072) (0.034)
Car/motorcycle repairs or maintenance -0.100 -0.052 0.062 1 226 (0.073) (0.037)
Visit sporting events 0.081 0.041 0.048 1 730
(0.073) (0.035) Go on a trip/short holidays -0.201 ** -0.099 *** 0.053 1 737 (0.080) (0.038) Church visits -0.066 * -0.038 * 0.035 5 451 (0.041) (0.020) OLS
Main Results Ordered Probit
19
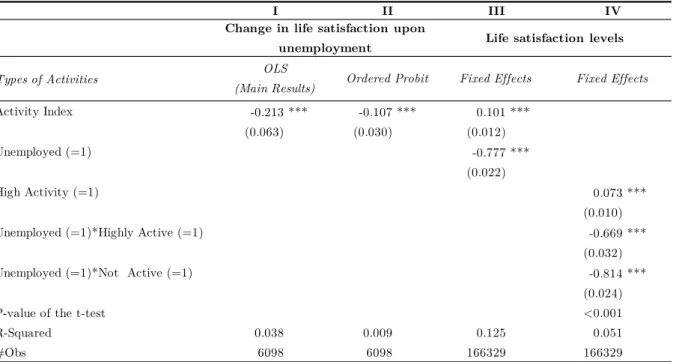
the mean frequency of time-use for each individual for each year. Table 5 presents results from alternative model specifications in which we estimate the association between activity index, change in life satisfaction (equation 2), and life satisfaction directly (equation 3). In Column I, we find that activity index is negative and highly statistically significant on the change in life satisfaction upon unemployment, as expected. The estimated coefficient is -.213 (s.e., .063), which is highly in line with the results in Table 4. Among the unreported results, we also use a factor analysis to define the activity index. The results are found to be highly similar to that of reported here. Column II presents results from the ordered probit model. The results are highly similar. These results suggest that pro-active time-use is indeed productive in terms of absorbing the negative well-being effect of an unemployment shock.
Table 5. Main results II: coefficients of pro-active time use on change in life satisfaction upon unemployment
Notes: Authors’ own calculations from the GSEOP (1984-2009).
The dependent variable is the change in life satisfaction upon unemployment (Column I and II) and life satisfaction level (Column III and IV). Standard errors clustered at within individual level are in parentheses. The models control for the full set of characteristics (see Table 4)
*, **, and *** represent significance levels 0.10, 0.05 and 0.01, respectively
Types of Activities Activity Index -0.213 *** -0.107 *** 0.101 *** (0.063) (0.030) (0.012) Unemployed (=1) -0.777 *** (0.022) High Activity (=1) 0.073 *** (0.010) Unemployed (=1)*Highly Active (=1) -0.669 ***
(0.032)
Unemployed (=1)*Not Active (=1) -0.814 ***
(0.024)
P-value of the t-test <0.001
R-Squared 0.038 0.009 0.125 0.051
#Obs 6098 6098 166329 166329
OLS
(Main Results) Ordered Probit Fixed Effects Fixed Effects
I II III IV
Change in life satisfaction upon
20
Column III presents results from equation (3) where we use life satisfaction levels of each individual – not the change in life satisfaction – and control for the unemployment and activity index conditional on all other determinants of life satisfaction (see the note under the table). This model is estimated using the fixed-effects specification to allow for the time-variant unobserved individual heterogeneity as well as time-variant personality characteristics (changes in two waves) to alleviate the potential endogeneity concerns.8 The results are in the expected direction: the activity index is positively
associated with life satisfaction while the dummy of unemployment is negative and large in magnitude.
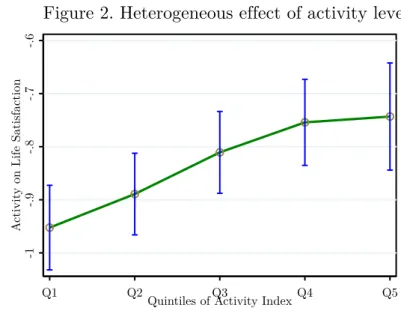
Figure 2. Heterogeneous effect of activity levels
Note: The figure is obtained by estimating fixed effects models where we control for the full set of characteristics (see the note under Table 4). Horizontal axis shows the 5 quintiles of the activity index and the vertical axis shows the association between unemployment and life satisfaction. The vertical lines represent %90 confidence intervals drawn using clustered standard errors at the individual level.
This model specification also allows us to use interactions between high-frequency pro-activity and unemployment. To define high level of pro-activity, a dummy is created among
8 The results of other control variables are highly in line with the literature (e.g., Ferrer-i-Carbonell,
2005). Age and life satisfaction are related in a U-shaped pattern; income, education, married/cohabited dummy, and good health dummies are positively correlated with life satisfaction. The full estimation results are available upon request.
-1 -.9 -.8 -.7 -.6 A ctivit y on Life Satisfaction
21
individuals who score more than 2 in their activity index, which corresponds to the median pro-activity level. The interaction results are given in Column IV. Importantly, the size of the drop in the life satisfaction is smaller among highly active people compared to less or not active individuals (-.669 vs. -.814). The difference in the estimated coefficients is highly statistically significant (p-value<0.001). In Figure 2, we present the heterogeneity of time-use activities by using alternative levels across the distribution of the activity index. Overall, the figure suggests that a higher level of activity is associated with a higher level of life satisfaction. Yet, the pattern seems to be concave as the benefit decreases for very high levels of activity.
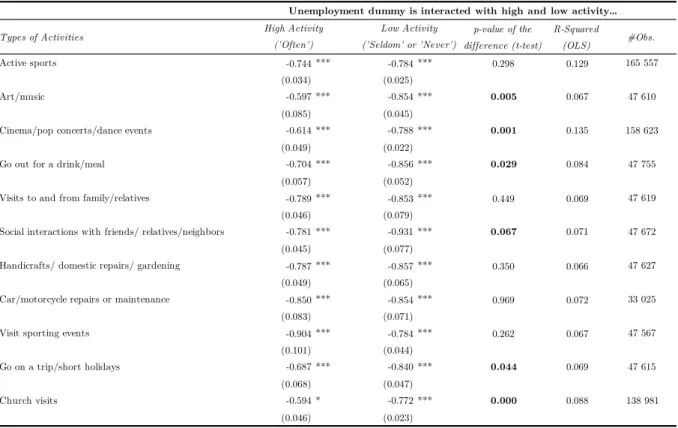
Table 6. Heterogeneity by types of activities
Notes: Authors’ own calculations from the GSEOP (1984-2009).
The dependent variable is life satisfaction. The models are estimated with fixed effects. Each row represents a different regression. Standard errors clustered at within individual level are in parentheses. See Table 4 for the control variables used in the regressions.
*, **, and *** represent significance levels 0.10, 0.05 and 0.01, respectively
Types of Activities p-value of the
difference (t-test) R-Squared (OLS) #Obs. Active sports -0.744 *** -0.784 *** 0.298 0.129 165 557 (0.034) (0.025) Art/music -0.597 *** -0.854 *** 0.005 0.067 47 610 (0.085) (0.045)
Cinema/pop concerts/dance events -0.614 *** -0.788 *** 0.001 0.135 158 623
(0.049) (0.022)
Go out for a drink/meal -0.704 *** -0.856 *** 0.029 0.084 47 755
(0.057) (0.052)
Visits to and from family/relatives -0.789 *** -0.853 *** 0.449 0.069 47 619
(0.046) (0.079)
Social interactions with friends/ relatives/neighbors -0.781 *** -0.931 *** 0.067 0.071 47 672 (0.045) (0.077)
Handicrafts/ domestic repairs/ gardening -0.787 *** -0.857 *** 0.350 0.066 47 627
(0.049) (0.065)
Car/motorcycle repairs or maintenance -0.850 *** -0.854 *** 0.969 0.072 33 025
(0.083) (0.071)
Visit sporting events -0.904 *** -0.784 *** 0.262 0.067 47 567
(0.101) (0.044) Go on a trip/short holidays -0.687 *** -0.840 *** 0.044 0.069 47 615 (0.068) (0.047) Church visits -0.594 * -0.772 *** 0.000 0.088 138 981 (0.046) (0.023) High Activity ('Often') Low Activity ('Seldom' or 'Never')
22
The result presented in Column IV of Table 5 and Figure 2 above suggests that the negative effects of unemployment is heterogenous by the high and low levels of pro-active time-use. To go one step further, we also explore the heterogeneity generated by each time-use activity. Table 6 presents results from the fixed-effects life satisfaction models (equation 3). Indeed, activities including art/music, cinema/pop concerts/dance events, going out for a drink/meal, social interactions with friends/relatives/neighbors, going on a trip/holiday, and church visits are significantly able to partially absorb the negative effect of unemployment.
3.3. Pro-Active Time-Use and the Probability of Finding a Job
We now aim to investigate the link between individuals’ pro-activity and their probability of finding a job in the next periods. That is, we test whether unemployed individuals who use their time pro-actively have a higher probability of finding a job compared to unemployed individuals who are less active during their unemployment period. There can be alternative channels through which pro-activity types might relate to market reentry. On one hand, individuals who are actively using their time might also be the ones who are using their time actively searching for jobs, and thus their probability of finding a job might be higher. On the other hand, as previous results indicate, lower life satisfaction might push less pro-active people to find a job faster. Indeed, as Clark (2003) suggests, for example, it might be that individuals with lower well-being find a new job faster because these individuals receive greater damage from unemployment, and therefore they are more interested in filling the gap (see also Gielen and van Ours, 2014; Mavridis, 2015). Additionally, very active unemployed individuals who have a high level of life satisfaction might be prisoners of a lock-in effect (see Lechner et al., 2011; McCall et al, 2016). Unemployed individuals who compensate for their loss of work with their leisure activities are more satisfied with their life and they
23
may not search for a job hard enough. Therefore, the direction of the relationship is unclear and we explore this empirically below using probability models.
To investigate how pro-activity during unemployment is associated with the likelihood of finding a job, we estimate the following probability model.
𝑑(𝑈!("&') → 𝐸!") = 1(𝑋!"𝛽 + 𝛿𝐶!"+ 𝜏"+𝜀!" > 0). (4)
The model specification (4) aims to investigate the probability of making a transition to employment 𝐸!" (State 4 in Table 2) at the time point t from unemployment 𝑈!("&')
at the previous period t-1 (State 3 in Table 2). The symbols given in equation (4) are the same as in equation (2). The model includes the full set of control variables used in previous estimations. Additionally, we include the length of unemployment duration into the model specification. The model is estimated with a probit specification where error term 𝜀!" is assumed to be normally distributed with unit variance.
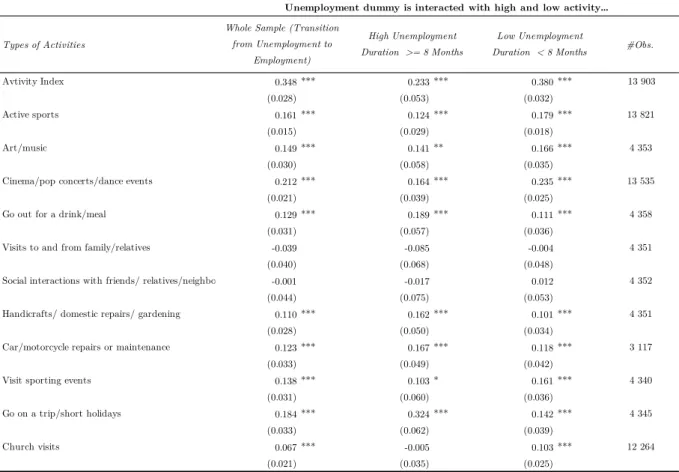
The results of the probit regressions are presented in Table 7 where we also present results for individuals who experienced a long or a short unemployment duration before transiting to employment. We aim to investigate whether pro-active time-use generates alternative associations among people who had short and long unemployment durations. Specifications show a strong positive correlation for most of the activities. Results with the activity index is given in the first row of the table. The result suggests that being pro-active during the unemployment period is positively associated with the probability of finding a job in the next period. The rest of the results give the results for each 11 activity types. Among the 11 activities, only ‘visits to and from friends or relatives’ and ‘social interactions with family or relatives’ have no statistically significant association.
24
Table 7. Pro-activity and employment probability
Notes: Authors’ own calculations from the GSEOP (1984-2009).
The dependent is an indicator variable taking the value 1 if the individual makes a transition from unemployment to employment. Each row represents a different probit regression. Standard errors clustered at within individual level are in parentheses.
See Table 4-6 for the control variables used. Additionally, Column I includes unemployment duration and squared.
*, **, and *** represent significance levels 0.10, 0.05 and 0.01, respectively
Finally, we use the employment duration just before the reentry to employment to investigate how pro-active time-use relates to employment probability for longer and shorter unemployment spells before making a transition to employment. The median unemployment duration is 8 months. We split the data into two equal parts for individuals with long and short unemployment spells. These results are given in Columns II and III of Table 7. There is a clear pattern: the association between pro-active time-use during unemployment period and the likelihood to be reemployed is stronger for shorter unemployment spells. Yet, the coefficients for pro-activity on
Types of Activities #Obs.
Avtivity Index 0.348 *** 0.233 *** 0.380 *** 13 903 (0.028) (0.053) (0.032) Active sports 0.161 *** 0.124 *** 0.179 *** 13 821 (0.015) (0.029) (0.018) Art/music 0.149 *** 0.141 ** 0.166 *** 4 353 (0.030) (0.058) (0.035)
Cinema/pop concerts/dance events 0.212 *** 0.164 *** 0.235 *** 13 535
(0.021) (0.039) (0.025)
Go out for a drink/meal 0.129 *** 0.189 *** 0.111 *** 4 358
(0.031) (0.057) (0.036)
Visits to and from family/relatives -0.039 -0.085 -0.004 4 351
(0.040) (0.068) (0.048)
Social interactions with friends/ relatives/neighbors -0.001 -0.017 0.012 4 352
(0.044) (0.075) (0.053)
Handicrafts/ domestic repairs/ gardening 0.110 *** 0.162 *** 0.101 *** 4 351
(0.028) (0.050) (0.034)
Car/motorcycle repairs or maintenance 0.123 *** 0.167 *** 0.118 *** 3 117
(0.033) (0.049) (0.042)
Visit sporting events 0.138 *** 0.103 * 0.161 *** 4 340
(0.031) (0.060) (0.036)
Go on a trip/short holidays 0.184 *** 0.324 *** 0.142 *** 4 345
(0.033) (0.062) (0.039)
Church visits 0.067 *** -0.005 0.103 *** 12 264
(0.021) (0.035) (0.025)
Whole Sample (Transition from Unemployment to
Employment)
Low Unemployment Duration < 8 Months
Unemployment dummy is interacted with high and low activity…
High Unemployment Duration >= 8 Months
25
employment probability are statistically significant for both short and long unemployment spells.
4. Conclusion
This paper shows that the time-use activities unemployed individuals participate may mitigate the large fall in life satisfaction upon unemployment and these activities might also lead to a faster reentry into the labor market. To test this, we have exploited a long SWB data (German Socio-Economic Panel – GSOEP) including information on the types of pro-active time-use and labor market status of individuals. We have estimated specifications involving changes in life satisfaction upon unemployment and fixed-effects panel data models to allow for unobserved individual effects.
As previously reported in several studies, we also demonstrate that unemployed individuals experience a large drop in their life satisfaction. Our main findings suggest that there is a significant correlation between the frequency of pro-active time-use (e.g. on active sports, arts, or short trips) and well-being shock of unemployment. We report that more active unemployed individuals state higher life satisfaction on average. Our findings corroborate previous studies with respect to the importance of unemployed individuals’ time-use (e.g. Fryer and Payne, 1984; Waters and Moore, 2002). The result shows a large heterogeneity. In general, the activities relating to releasing stress (e.g., going out for drinking/meals, church visits, etc.) are more important to compensate for the well-being loss caused by unemployment shock. Furthermore, in an additional analysis, we also show a positive relationship between pro-activeness and the probability of entering the labor market later. The more actively an unemployed individual uses his or her time, the higher is the probability of finding a job in the next period, even after controlling for the personality characteristics of individuals.
26
Overall, the paper reports consistent evidence on the positive association between individuals’ pro-activity and their life satisfaction, as well as their probability of finding a job during next periods, which we believe has important implications for both welfare and labor market policies. Considering that selective pro-active time-use mitigates the huge well-being loss due to unemployment, it is crucial to give people opportunities to spend their time more pro-actively and a large degree of freedom to realize this. Labor market programs might consider observing and supporting time-use patterns of people during their unemployment period. From the policymakers’ point of view, the important question is how to make people more active in their unemployment period. To make unemployed people more active, governments might provide subsidies for sport or other activities i.e. free/subsidized gym, free/subsidized tickets for cinema etc.9
However, care should be taken when using these policy tools due to the locked-in effect of unemployment (McCall et al., 2016). Our results provide evidence for this point by focusing on unemployment duration and find that probability to reentry to market is stronger among pro-active unemployed individuals for shorter unemployment durations. This might suggest that policymakers may consider limiting the subsidies for a certain period of time, especially for the early unemployment period.
We highlight the fact that this study also has important limitations. First, the question of causality is still open and studies using experimental tools should investigate this issue further. Second, an important issue left for the future research is the potential well-being adaptation to unemployment (Di Tella et al., 2010), which can bias our results if pro-active time-use correlates with the speed of adaptation. Nevertheless, we
9 Similar strategies have already been used in some countries. For instance, there are welfare recipient
discounts for various activities such as local public transport, cultural activities (theater, philharmonic orchestra concerts, opera houses, and concerts), sports, zoo, art education or museums (see
27
believe that our results are important for analyzing the situation of unemployed individuals and their expectations to come back to work. Economists strive for individuals’ highest level of life satisfaction. Our findings provide initial evidence that pro-active time-use mitigates the negative effect on life satisfaction after job loss and furthermore that the probability of finding a job increases in relation to a higher level of pro-activity, which deserve further investigations in future studies.
References
Akay, A., Bargain, O., Zimmermann, K.F. (2017). Home sweet home? Macroeconomic conditions in home countries and the well-being of migrants. Journal of Human Resources, 52(2): 351–373.
Akay, A., Bargain, O., Elsayed, A. (2020). Global terror, well-being and political attitudes. European Economic Review, 123: 1-16
Björklund, A. (1985). Unemployment and mental health: some evidence from panel data. Journal of Human Resources, 20(4), 469–483.
Allan, B.A., Rolniak, J.R., and Bouchard, L. (2018). Underemployment and Well-Being: Exploring the Dark Side of Meaningful Work. Journal of Career Development, 47(1), 111–125.
Bond, M.J., and Feather, N.T. (1988). Some correlates of structure and purpose in the use of time. Journal of Personality and Social Psychology, 55(2), 321.
Boyce, C.J., and Wood, A.M. (2010). Money or mental health: The cost of alleviating psychological distress with monetary compensation versus psychological therapy. Health Economics, Policy & Law, 5, 509.
Chen, W.H., and Hou, F. (2019). The effect of unemployment on life satisfaction: a cross-national comparison between Canada, Germany, the United Kingdom and the United States. Applied Research in Quality of Life, 14(4), 1035-1058. Clark, A. E. (2003). Unemployment as social norm: psychological evidence from panel
data. Journal of Labor Economics, 21(2), 323–351.
Clark, A.E. and Oswald, A.J. (1994). ‘Unhappiness and Unemployment,’ Economic Journal, 104(424), 648–659.
28
Darity, W.Jr. and Goldsmith, A.H. (1996). Social psychology, unemployment and macroeconomics. Journal of Economic Perspective, 10(1), 121–140.
Di Tella, R., New, J.H.-D., and MacCulloch, R., (2010). Happiness adaptation to income and to status in an individual panel. Journal of Economic Behavior and Organization. 76 (3): 834–852.
Dolan, P., Peasgood, T., and White, M. (2008). Do we really know what makes us happy? A review of the economic literature on the factors associated with subjective well-being. Journal of Economic Psychology, 29(1), 94-122.
Eichhorn, J. (2013). Unemployment needs context: How societal differences between countries moderate the loss in life-satisfaction for the unemployed. Journal of Happiness Studies, 14(6), 1657-1680.
Evans, S.T. and Haworth, J.T. (1991). Variations in personal activity, access to categories of experience and psychological well-being in young adults. Leisure Studies, 10(3), 249–264.
Feather, N., and Bond, M. (1994). Structure and purpose in the use of time. Psychology of Future Orientation, 32, 121-140.
Feather, N.T. (1990). The psychological impact of unemployment. New York: Springer-Verlag.
Ferrer-i-Carbonell, A. (2005). Income and well-being: an empirical analysis of the comparison income effect. Journal of public economics, 89(5-6), 997-1019. Ferrer‐i‐Carbonell, A., and Frijters, P. (2004). How important is methodology for the
estimates of the determinants of happiness? The Economic Journal, 114(497), 641-659.
Fryer, D., and Payne, R. (1984). Proactive behaviour in unemployment: Findings and implications. Leisure Studies, 3(3), 273–295.
Gielen, A.C. and J.C. van Ours (2014). Unhappiness and job finding, Economica, 81, 544‐565.
Goldsmith, A.H., Veum, J.R., and Darity Jr.W. (1996). The psychological impact of unemployment and joblessness. The Journal of Socio-Economics, 25(3), 333-358. Goodman, W. K., Geiger, A. M., and Wolf, J. M. (2017). Leisure activities are linked to mental health benefits by providing time structure: comparing employed, unemployed and homemakers. Journal of Epidemiology & Community Health, 71(1), 4-11.
29
Green, F. (2011). Unpacking the misery multiplier: How employability modifies the impacts of unemployment and job insecurity on life satisfaction and mental health. Journal of Health Economics, 30(2), 265-276.
Grün, C., Hauser, W., and Rhein, T. (2010). Is any job better than no job? Life satisfaction and re-employment. Journal of Labor Research, 31(3), 285-306. Hartley, J.F. (1980). The impact of unemployment upon the self-esteem of managers.
Journal of Occupational Psychology, 53(2), 147–155.
Haworth, J.T. and Ducker, J. (1991). Psychological well-being and access to categories of experience in unemployed young adults. Leisure Studies, 10(3), 265–274. Helliwell, J.F., and Huang, H. (2014). New measures of the costs of unemployment:
Evidence from the subjective well‐being of 3.3 million Americans. Economic Inquiry, 52(4), 1485-1502.
Jahoda, M. (1982). Employment and unemployment: A social-psychological analysis. Cambridge University Press, Cambridge.
Jawahar, I.M., and Liu, Y. (2017). Why are proactive people more satisfied with their job, career, and life? An examination of the role of work engagement. Journal of Career Development, 44(4), 344-358.
Kahneman, D., and Sugden, R. (2005). Experienced utility as a standard of policy evaluation. Environmental and resource economics, 32(1), 161-181.
Kassenboehmer, S.C., and Haisken-DeNew, J.P. (2009). You're fired! The causal negative effect of entry unemployment on life satisfaction. The Economic Journal, 119(536), 448–462.
Knabe, A., Rätzel, S., Schöb, R., and Weimann, J. (2010). Dissatisfied with life but having a good day: time-use and well-being of the unemployed. Economic Journal, Royal Economic Society, 120(547), 867–889.
Knies, G., and Spiess C.K. (2007). Regional data in the German Socio-economic Panel Study (soep). No. 17. DIW Data Documentation.
Krueger, A.B., and Schkade, D.A. (2008). The reliability of subjective well-being measures. Journal of Public Economics, 92(8-9), 1833-1845.
Lechner, M., Miquel, R., and Wunsch, C. (2011). Long-run effects of public sector sponsored training in West Germany. Journal of the European Economic Association 9(4), 742–784.
Lechner, C.M., and Leopold, T. (2015). Religious attendance buffers the impact of unemployment on life satisfaction: Longitudinal evidence from Germany. Journal for the Scientific Study of Religion, 54(1), 166-174.
30
Li, N., Liang, J., and Crant, J.M. (2010). The role of proactive personality in job satisfaction and organizational citizenship behavior: A relational perspective. Journal of Applied Psychology, 95(2), 395-404.
Lucas, R.E., Clark, A.E., Georgellis, Y., and Diener, E. (2004). Unemployment alters the set point for life satisfaction. Psychological Science, 15(1), 8-13.
Mavridis, D. (2015): The unhappily unemployed return to work faster. IZA Journal of Labor Economics 4, 1‐22.
McCall, B., Smith, J. A., and Wunsch, C. (2016). Government-sponsored training for adults. In: Hanushek, E., Machin, S., Wössmann, L. (eds). Handbook of the Economics of Education, Volume 5. North Holland: Elsevier.
McCrae, R.R., and Costa, P.T.Jr. (1997). Personality trait structure as a human universal. American Psychologist, 52(5), 509-516.
McKee-Ryan, F., Song, Z., Wanberg, C.R., and Kinicki, A.J. (2005). Psychological and physical well-being during unemployment: a meta-analytic study. Journal of Applied Psychology, 90(1), 53-76.
Oswald, A.J., and Wu, S. (2010). Objective confirmation of subjective measures of human well-being: Evidence from the USA. Science, 327(5965), 576-579.
Paul, K.I., and Moser, K. (2009). Unemployment impairs mental health: Meta-analyses. Journal of Vocational Behavior, 74(3), 264-282.
Prabhu, V. (2007). Understanding the effect of proactive personality on job related outcomes in an organizational change setting (Doctoral dissertation).
Richter, E. P., Brähler, E., Stöbel-Richter, Y., Zenger, M., and Berth, H. (2020). The long-lasting impact of unemployment on life satisfaction: results of a longitudinal study over 20 years in East Germany. Health and Quality of Life Outcomes, 18(1), 1-7.
Schmiedeberg, C., and Schröder, J. (2017). Leisure activities and life satisfaction: An analysis with German panel data. Applied Research in Quality of Life, 12(1), 137-151.
Stebbins, R.A. (1982). Serious leisure: a conceptual statement. The Pacific Sociological Review, 25(2), 251–272.
Wanberg, C.R., Griffiths, R.F., and Gavin, M.B. (1997). Time structure and unemployment: A longitudinal investigation. Journal of occupational and organizational psychology, 70(1), 75-95.
31
Wang, Z., Yu, K., Xi, R., and Zhang, X. (2019). Servant leadership and career success: The effects of career skills and proactive personality. Career Development International, 24(7),717-730.
Warr, P. (1987). Work, unemployment, and mental health. Oxford University Press. Waters, L.E. and Moore, K.A. (2002). Reducing latent deprivation during
unemployment: The role of meaningful leisure activity. Journal of Occupational and Organizational Psychology, 75(1), 15–32.
Winkelmann, L. and Winkelmann, R. (1998). Why are the unemployed so unhappy? Evidence from panel data. Economica, 65(257), 1–15.
Wulfgramm, M. (2014). Life satisfaction effects of unemployment in Europe: The moderating influence of labour market policy. Journal of European Social Policy, 24(3), 258-272.
32
Appendices
A. Additional Tables
Table Appendix A1. Definitions of variables and waves in the GSOEP
Variables Description Survey
Big five factor model:
Conscientiousness Big five factor - Scale: 1 ('does not apply to me at all') to 7 ('applies to me perfectly') 2005, 2009 Extraversion Big five factor - Scale: 1 ('does not apply to me at all') to 7 ('applies to me perfectly') 2005, 2009 Agreeableness Big five factor - Scale: 1 ('does not apply to me at all') to 7 ('applies to me perfectly') 2005, 2009 Openness to experience Big five factor - Scale: 1 ('does not apply to me at all') to 7 ('applies to me perfectly') 2005, 2009 Neuroticism Big five factor - Scale: 1 ('does not apply to me at all') to 7 ('applies to me perfectly') 2005, 2009
How often you take part in each activity:
Active sports
Active sport: often, seldom or never.
1984-1986, 1988, 1990, 1992, 1994-1999, 2001, 2003, 2005, 2007-2009
Art/music Artistic and musical activities: often, seldom or never. 1990, 1995, 1998, 2003, 2008 Cinema/pop concerts/dance events
Visiting cinema, pop, jazz concerts, disco: often, seldom or never.
1985, 1986, 1988, 1992, 1994, 1996, 1997, 1999, 2001, 2005, 2007
Go out for a drink/meal Go out for eating-drinking: often, seldom or never. 1990, 1995, 1998, 2003, 2008 Car/motorcycle repairs or maintenanceVehicle maintenance, repairs: often, seldom or never. 1998, 2003, 2008 Visit sporting events Attending a sporting event: often, seldom or never. 1990, 1995, 1998, 2003, 2008 Go on a trip/short holidays Excursions, short trips: often, seldom or never. 1990, 1995, 1998, 2003, 2009
Church visits Going to church, visiting religious events: often, seldom or never. 1992, 1994, 1996, 1997, 1999, 2001, 2005, 2007 Activity Index Average of all activities
Additional controls:
Age age of the individuals in years in years Female Dummy for females, 1 Female, 0 Male yearly Mini job Working in a mini job: 1 Yes, 0 No 2001-2009 One-euro-job Working opportunities with additional cost compensation: 1 Yes, 0 No 1992-1995, 1996-2009 Household Income Montly household income yearly
Number of Friends
Number of close friends
1985, 1986, 1988, 1992, 1994, 1996, 1997, 1999, 2001, 2005, 2007, 2009
Marital Status of Individuals 1 Married, 2 Single, 3 Widowed, 4 Divorced, 5 Separated.. yearly Education 1 Secondary school leaving certificate, 2 Middle school leaving certificate, 3 University entrance qualification, 4 High School, 5 Different degree, 6 Leave without graduation,
7 No graduation yet
yearly Health Satisfaction Health satisfaction - Scale: 0 ('completely dissatisfied') to 10 ('completely satisfied') yearly Number of person in household Integer yearly Number of children in household Integer yearly
33
Table Appendix A2. Highly pro-active unemployed and their life satisfaction
Notes: Authors’ own calculations from the GSEOP (1984-2009).
How many Number Average Standard
times people state ‘often’ of observations life satisfaction deviation
0 124 4.74 2.09 1 309 5.07 2.1 2 645 5.52 2.08 3 785 5.61 2 4 715 5.84 1.93 5 529 5.91 1.99 6 305 6.21 2 7 177 6.31 1.93 8 75 6.43 1.74 9 17 6.53 1.12 10 4 7.5 1.29 11 1 9 .
34
Figure A1: Highly pro-active employed individuals and their life satisfaction
Note: The horizontal axis shows the accumulated sum of the times that employed people often do any of the 11 time-use activities. The vertical axis shows the average life satisfaction.
5.98 6.43 6.73 6.9 7.1 7.23 7.37 7.5 7.61 7.72 8.09 8.5 4 5 6 7 8 9 10 Av
erage Life Satisfaction
0 1 2 3 4#times 'often'5 6 7 8 9 10 11
View publication stats View publication stats