Original article
The relationship between advanced oxidation protein
products (AOPP) and biochemical and histopathological
findings in patients with nonalcoholic steatohepatitis
Seren OZENIRLER,* Gulbanu ERKAN,§Ceyla KONCA DEGERTEKIN,†Ugur ERCIN,‡Mustafa CENGIZ,*
Ayse BILGIHAN,‡Guldal YILMAZ¶& Gulen AKYOL¶
Departments of *Gastroenterology,†Endocrinology,‡Biochemistry,¶Pathology, Faculty of Medicine, Gazi
University Hospital, and§Department of Gastroenterology, Faculty of Medicine, Ufuk University Hospital,
Ankara, Turkey
OBJECTIVE: To investigate the correlation between advanced oxidation protein products (AOPP) levels and biochemical and histopathological findings in patients with nonalcoholic steatohepatitis (NASH). METHODS: Sixty biopsy-proven NASH patients and 60 individuals with ultrasonographically healthy liver (the control group) were included in the study. AOPP levels were determined in all the participants and liver histopathological examination based on liver biopsy was performed in NASH patients. The NASH activity score (NAS), hepatosteatosis, liver inflammation and fibrosis were evaluated.
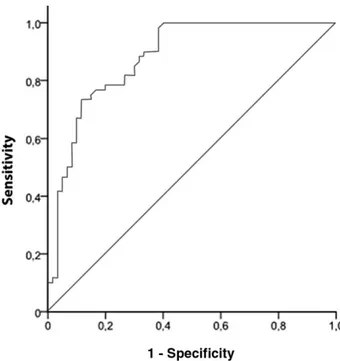
RESULTS: Serum AOPP level was significantly higher in the NASH group than that in the control group (461.8± 201.9 μmol/L vs 191.7 ± 152.5 μmol/L, P < 0.001). The receiver operating characteristic (ROC)
curve revealed a sensitivity of 73.3% and a specificity of 88.3% for the diagnosis of NASH with an AOPP cut-off value of 332μmol/L (the area under ROC curve 0.88, 95% confidence interval 0.82–0.94, P< 0.01). AOPP levels were positively correlated with NAS (r= 0.27,
P= 0.035), fibrosis (r = 0.27, P = 0.037) and
inflam-mation (r= 0.34, P = 0.008), but not the grade of steatosis (r= 0.02, P = 0.83) or ballooning (r = 0.02,
P= 0.55).
CONCLUSIONS: AOPP levels are significantly
higher in patients with NASH than in those with ultrasonographically healthy liver. AOPP levels are positively correlated with biochemical and histo-pathological findings (NAS, liver inflammation and fibrosis), indicating that AOPP may play a role in the development of liver fibrosis and inflammation and may predict liver histopathology in NASH.
KEY WORDS: advanced oxidation protein products, fibrosis, inflammation, nonalcoholic fatty liver disease, nonalcoholic steatohepatitis.
INTRODUCTION
The diagnosis of nonalcoholic fatty liver disease (NAFLD) is based on the presentation of hepa-tosteatosis, employing either histopathological or ultrasonographic evidence after the exclusion of secondary hepatosteatosis caused by viral hepatitis,
long-term alcohol consumption, drug intake,
parenteral nutrition or genetic disorders, etc.
Correspondence to: Gulbanu ERKAN, Department of Gastroenterology, Faculty of Medicine, Ufuk University Hospital, Ufuk Üniversitesi Mevlana Bulvarı (Konya Yolu) 86–88, 06520 Balgat, Ankara, Turkey. Email: [email protected]
Conflict of interest: None.
© 2013 Chinese Medical Association Shanghai Branch, Chinese Society of Gastroenterology, Renji Hospital Affiliated to Shanghai Jiaotong University School of Medicine and Wiley Publishing Asia Pty Ltd
Histopathologically, NAFLD is classified into nonalcoholic fatty liver (NAFL) and nonalcoholic steatohepatitis (NASH).1 NAFL is defined as simple
steatosis in the absence of hepatocyte injury or liver fibrosis, while NASH presents as hepatosteatosis and hepatocyte injury with or without liver fibrosis. There-fore, patients with NASH are more likely to progress to liver cirrhosis, hepatocellular carcinoma and even liver-related death.2,3
The pathogenesis of NASH remains unclear but mul-tiple factors have been reported to be involved, in which oxidative stress (OS) is believed to play an important role. OS is an increased production of reac-tive oxygen species (ROS) due to the disturbance of the balance between oxidants and anti-oxidants, which may lead to sustained hepatocyte injury in patients with NASH.4 Previous studies4,5 have also
reported increased levels of OS markers as well as reduced antioxidants in serum and tissues in patients with NASH, which further confirms this theory. Advanced oxidation protein products (AOPP), which were first reported in 1996 by Witko-Sarsat et al.,6are
formed by the action of chlorinated oxidants during OS. The increase of AOPP can also be observed in diseases such as diabetes, uremia and cardiovascular diseases,7–9 which are closely associated with OS.
However, whether the AOPP level is related to NASH remains unknown.
In this study, we aimed to determine the serum AOPP levels in patients with NASH as well as in those with ultrasonographically diagnosed normal liver, and to investigate whether the AOPP levels were correlated with the degree of liver steatosis, inflammation and fibrosis.
PATIENTS AND METHODS Patients
Data of the patients with histologically confirmed NASH (the NASH group) who had undergone ultrasonography-guided liver biopsy and the individu-als with a normal liver under ultrasonography (the control group) at the Gazi University Hospital (Besevler, Ankara, Turkey) and the Ufuk University Hospital (Balgat, Ankara, Turkey) from September 2010 to June 2012 were retrospectively reviewed. The study protocol was approved by the Institutional Ethics Committee of both hospitals in accordance with the latest Declaration of Helsinki, and written informed consent was obtained from each patient with NASH prior to their liver biopsy.
The NASH group included patients with abnormal serum alanine aminotranferase (ALT) levels (>40 U/L) persisting for more than 6 months,
ultrasonography-diagnosed fatty liver and histopathologically
confirmed hepatosteatosis and liver injury. All these patients underwent a complete laboratory examina-tion before liver biopsy, such as ALT, asparate aminotransferase (AST), alkaline phosphatase (ALP), γ-glutamyltransferase (γ-GT) and hepatitis viral markers, to exclude other possible etiologies including viral hepatitis, autoimmune hepatitis, primary biliary
cirrhosis, primary sclerosing cholangitis,
α1-antitrypsin deficiency, Wilson’s disease and hemo-chromatosis. Those who had been treated for hepatosteatosis during the previous 6 months before they were enrolled in the study, having clinical evidence of liver decompensation and with a history of previous or ongoing alcohol consumption (exceeding 20 g/day) were also excluded from the study.
In contrast, individuals in the control group were found to be free of viral hepatitis and alcohol-related hepatitis, etc., and had normal liver function. Ultrasonography confirmed that all these individuals had apparently healthy liver.
Physical examination and diagnosis of diabetes Body weight of the participants was classified as
follows: underweight, body mass index (BMI)
< 18.5 kg/m2; normal, BMI 18.5–24.9 kg/m2;
over-weight, BMI 25–29.9 kg/m2; obese, BMI≥ 30 kg/m2.
Diabetes was diagnosed if there was a history of using anti-diabetic medication, or fasting plasma glucose
(FPG)≥ 7.0 mmol/L or random plasma glucose
≥11.1 mmol/L on two separate tests. The remaining individuals underwent a standard 75 g oral glucose tolerance test (OGTT) and were classified as normal, impaired glucose tolerance (IGT) or diabetes based on the American Diabetes Association guidelines.10
More-over, on the basis of FPG and OGTT results, the fol-lowing classification was made: (i) normal glucose level: FPG< 5.6 mmol/L; (ii) impaired fasting glucose: FPG 5.6–6.9 mmol/L; and (iii) IGT: 2-h plasma glucose 7.8–11.1 mmol/L during OGTT.
AOPP
AOPP levels were determined using the spec-trophotometric method, as mentioned by Witko-Sarsat et al.6A total of 40μL plasma was diluted in
dilu-tion 1:5; Merck, Darmstadt, Germany), and was added to 10μL of 1.16 mol/L potassium iodide (KI; Merck) and 20μL acetic acid 96% (Merck). The samples were mixed using Velp Scientifica 2X3 Vortex Mixer (Velp Scientifica, Usmate Velate, Italy) and the absorbance was read at 340 nm by Hitachi Double Beam Spectrophotometer (U-2900; Hitachi, Tokyo, Japan). The formation of AOPP was quantified by the forma-tion of triiodide ion through the oxidaforma-tion of potas-sium iodide with chloramine-T (Sigma-Aldrich, St. Louis, MO, USA). The absorbance of triiodide ion at 340 nm formed a linear calibration curve in a range of 0–100 mmol/L of chloramine-T. AOPP levels were recorded as chloramine-T (mmol/L).
Liver ultrasonography
Liver ultrasonography was performed in all the partici-pants by a single gastroenterologist who was experi-enced in liver ultrasonography using a 3.0–6.0 MHz convex probe (Hitachi, Tokyo, Japan). Hepatosteatosis was diagnosed according to the following criteria:11
grade I (mild steatosis), slightly increased liver echogenicity, slightly exaggerated discrepancy of liver and kidney echoes, and relative preservation of echoes from the portal vein walls; grade II (moderate steatosis), loss of echoes from the walls of the portal vein, especially from the peripheral branches, leading to a featureless appearance of the liver with addition-ally greater posterior beam attenuation and more pro-nounced discrepancy between hepatic and renal echoes; grade III (severe steatosis), a significant reduc-tion in beam penetrareduc-tion, loss of echoes from most of the portal vein walls including the main branches, and a major discrepancy between hepatic and renal echoes.
Histopathology
Percutaneous liver biopsy was performed using a Menghini type needle (Hepafix 16 G, 1.6 mm; B. Braun Melsungen, Melsungen, Germany) with the guidance of ultrasound. A single specimen≥1.5 cm in length was obtained from the right hepatic lobe of the patients. The specimens were fixed in formalin, embedded in paraffin, and stained with hematoxylin and eosin (HE) and Masson trichrome. An experienced digestive pathologist who was blinded to the clinical character-istics of the participants reviewed all the specimens. Steatosis was graded based on the percentage of hepatocytes containing macrovesicular fat droplets: 0, <5%; 1, 5–33%; 2, >33–66%; and 3, >66%. Lobular
inflammation was scored as: 0, no foci; 1,<2 foci per 200× field; 2, 2–4 foci per 200× field; and 3, >4 foci per 200× field. Ballooning was scored as: 0, none; 1, few ballooned cells (rare but definite ballooned hepatocytes as well as cases that were diagnostically borderline); 2, many cells/prominent ballooning. The NASH activity score (NAS)12was calculated by the sum
of hepatosteatosis, ballooning and lobular inflamma-tion, with a range of 0–8. NAS≥ 5 was defined as NASH, while NAS< 3 was not likely to be NASH. Fibrosis was scored as:120, no fibrosis; 1, perivenular
or perisinusoidal; 1A, mild, zone 3, perisinusoidal; 1B, moderate, zone 3, perisinusoidal; 1C, portal/ periportal; 2, perisinusoidal and portal/periportal; 3, bridging fibrosis; and 4, cirrhosis.
Statistical analysis
Statistical analyses were performed using SPSS 17.0 (SPSS Inc., Chicago, IL, USA). Normally distributed parameters were expressed as mean± standard devia-tion, whereas non-normally distributed or ordinal variables were expressed as median and range. The former variables were analyzed with Kolmogorov– Smirnov or Shapiro-Wilk tests. AOPP levels of the NASH group and the control group were compared using the Mann–Whitney U–test. To investigate the correlation coefficients and their significance between AOPP levels and NAS, liver inflammation, steatosis, ballooning or fibrosis, we performed the Spearman’s correlation, and for normally distributed variables
such as ALT, AST, ALP and γ-GT levels we used
Pearson’s correlation test. All categorical variables between NASH and control groups were compared withχ2test. The capacity of AOPP levels to predict the
presence of NASH was analyzed using the receiver operating characteristic (ROC) curve and the area under ROC curve (AUROC) was calculated. Sensitivity and specificity were determined based on the cut-off
values. P≤ 0.05 was regarded as statistically
significant. RESULTS
Characteristics of the participants
A total of 60 patients with biopsy-proven NASH and
60 individuals with ultrasonography-diagnosed
healthy liver were finally included in the study. There were no significant differences in age (47.4± 9.8 years
vs 48.8± 13.6 years, P = 0.56) and gender (male: 22
[36.7%] vs 17 [28.3%], P= 0.33) between the two groups. BMI was higher in the NASH group than in the
control group (29.3± 4.2 kg/m2vs 28.9± 3.62 kg/m2, P< 0.01). The proportion of obese (40.0% [24/60] vs
21.7% [13/60], P< 0.05) and overweight (55.0% [33/ 60] vs 41.7% [25/60], P< 0.05) participants were sig-nificantly higher in the NASH group than that in the control group. The proportion of participants with a normal glucose level, IGT and diabetes were signifi-cantly different between two groups (NASH vs control: 50.0% vs 86.6% for normal glucose levels, 21.6% vs 8.4% for IGT and 28.4% vs 5.0% for diabetes, respec-tively, P= 0.001).
Biochemical findings
Serum levels of ALT, AST, ALP, γ-GT, total cholesterol, low-density lipoprotein (LDL) cholesterol and triglyc-eride were significantly higher in the NASH group than those in the control group (Table 1, all P< 0.01). In contrast, high-density lipoprotein (HDL) choles-terol was lower in the NASH group than that in the control group, but the serum bilirubin and albumin levels did not differ between the two groups.
Serum AOPP level was significantly higher in the NASH group than that in the control group (461.8± 201.9μmol/L vs 191.7 ± 152.5 μmol/L, P < 0.001),
and was positively correlated with BMI (r=
0.43, P< 0.01), AST (r = 0.61, P < 0.001), ALT
(r= 0.63, P = 0.001), ALP (r = 0.22, P = 0.016), γ-GT (r= 0.59, P < 0.001), FPG (r = 0.33, P < 0.001), total cholesterol (r= 0.32, P < 0.01), LDL (r = 0.32,
P< 0.001) and triglyceride (r = 0.45, P < 0.001). There
was a negative correlation between AOPP and HDL (r= −0.25, P = 0.006), but no correlation between
AOPP and bilirubin (r= 0.16, P = 0.08) or albumin levels (r= −0.1, P = 0.90). A cut-off value for AOPP of 332.0μmol/L for the diagnosis of NASH had a sensi-tivity of 73.3% and a specificity of 88.3%, with an AUROC of 0.88 (95% confidence interval [CI] 0.82– 0.94, P< 0.01; Fig. 1). There was a positive correlation between the ultrasonographic steatosis grade and AOPP levels (r= 0.67, P < 0.01).
Table 1. Biochemical findings of the study population
Parameters (mean± SD) NASH group (n= 60) Control group (n= 60) P value
ALT (U/L) 79.1± 35.6 26.8± 12.4 <0.01 AST (U/L) 47.6± 26.3 24.4± 8.3 <0.01 ALP (U/L) 96.5± 37.5 82.3± 20.4 <0.01 γ-GT (U/L) 72.4± 69.1 30.8± 19.0 <0.01 Bilirubin (μmol/L) 13.3± 10.9 11.6± 2.9 0.055 Albumin (g/L) 46.6± 5.3 45.4± 2.8 0.42 Fasting plasma glucose (mmol/L) 6.1± 1.5 5.9± 1.0 >0.05 Total cholesterol (mmol/L) 5.3± 0.9 4.7± 1.0 <0.001 LDL (mmol/L) 3.39± 0.99 2.96± 0.77 <0.01 HDL (mmol/L) 1.16± 0.26 1.17± 0.15 0.022 Triglyceride (mmol/L) 2.0± 1.0 1.5± 0.5 <0.01 AOPP (μmol/L) 461.8± 201.9 191.7± 152.5 <0.001
γ-GT, γ-glutamyltransferase; ALP, alkaline phosphatase; ALT, alanine aminotransferase; AOPP, advanced oxidation protein products; AST, aspartate aminotransferase; HDL, high-density lipoprotein; LDL, low-density lipoprotein; NASH, nonalcoholic steatohepatitis; SD, stan-dard deviation.
Figure 1. The area under the receiver operating characteris-tic curve for serum advanced oxidation protein products for the diagnosis of nonalcoholic hepatosteatosis.
Histopathology
NAS was positively correlated with serum ALT (r= 0.40, P = 0.001) and AST (r = 0.56, P < 0.001). AOPP levels were significantly and positively corre-lated with NAS (r= 0.27, P = 0.035), liver fibrosis (r= 0.27, P = 0.037) and inflammation (r = 0.34,
P= 0.008). Nevertheless, there was no significant
cor-relation between AOPP levels and the grade of steatosis (r= 0.02, P = 0.83) or ballooning (r = 0.02,
P= 0.55).
DISCUSSION
The prevalence of NAFLD varies worldwide and ranges from 6% to 35% with a median of 20% in the general population; however, that of NASH in the USA is very low (range 3–5%).2,3To our knowledge, the prevalence
of NASH in Turkish adults has not yet been reported. In a recent study from Turkey,13 after retrospectively
reviewed the medical records of 330 individuals aged 2–20 years in whom autopsy was performed, the authors found that the prevalence of fatty liver was 6.0%, and was higher in the overweight group than that in the normal weight group (10.6% [7/66] vs 4.9% [13/264], P< 0.001). Additionally, simple
steatosis was detected in 7 individuals while
steatohepatitis was found in 13.
The pathogenesis of NASH has been reported to be affected by multiple factors. One hypothesis is the two-hit theory. The first hit is most likely an initial metabolic disturbance that causes the deposition of triglycerides in hepatocytes; and a second hit, consist-ing of OS, diminished ATP production in the liver, secretion of inflammatory cytokines, alcohol-related liver disease or drug intake and so on, causes hepatocyte injury and inflammation, finally resulting in NASH.14,15
Oxidized human serum albumin is the primary com-ponent of AOPP, and its clearance depends mainly on the liver. Therefore, the liver plays a crucial role in the elimination of AOPP.16 Liu et al.17 reported that
AOPP were suitable for identifying OS in patients with acute-on-chronic liver failure, and elevated AOPP levels might predict a poor prognosis. To the best of our knowledge, few reports on serum AOPP levels and their correlation with biochemical and histological findings in patients with NASH have been published.
Liver biopsy is reliable in confirming
hepa-tosteatosis, hepatocyte injury and fibrosis in patients with NAFLD; however, its high cost, invasiveness,
sam-pling errors as well as the complications during and after the procedure, such as hemorrhage and even death, limit its clinical application. Hence, noninva-sive serum markers, algorithms and diagnostic modalities to differentiate between patients with NASH and those with simple hepatosteatosis have been the focus of interest, including the enhanced liver fibrosis panel, the NAFLD fibrosis score and tran-sient elastography.1,3Currently, circulating cytokeratin
18 (CK18), which has been reported to be elevated in patients with NASH, is regarded as a biomarker to detect hepatosteatosis in NAFLD patients.1Recently a
meta-analysis showed that using the plasma levels of CK18 to predict NASH had a sensitivity of 78% and a specificity of 87%, and its AUROC was 0.82 (95% CI 0.78–0.88).3On the other hand, OS plays an
impor-tant role in the conversion of simple hepatosteatosis to steatohepatitis.14,18Therefore, we concluded that it
would be useful to determine whether AOPP, a marker of OS, might be a viable biomarker for predicting liver histology in patients with NASH.
In our study, AOPP level in the NASH group was sig-nificantly higher than that in the control group, sup-porting the hypothesis that components of OS were increased in patients with NASH. It was also found to be positively correlated with AST, ALT, ALP, γ-GT, total cholesterol, LDL and triglyceride levels, but negatively correlated with HDL. We also concluded that AOPP levels were positively correlated with NAS, liver inflammation and fibrosis, that is, the histopathological findings of NASH. Nevertheless, there were no significant correlations between AOPP and the grade of hepatosteatosis or ballooning, indi-cating that AOPP might play a role in the development of fibrosis and inflammation in NASH.
Ultrasonography is a useful tool for the diagnosis of NAFLD, although liver biopsy remains to be the gold standard for quantifying fat accumulation in the liver.1
Moreover, ultrasonography is operator-dependent and shows interobserver and intra-observer variability.19,20
This might explain why the AOPP levels were correlated with the grade of ultrasonographic steatosis but not with that of histopathological steatosis in our study.
In our study, AOPP showed a sensitivity of 73.3% and a specificity of 88.3% with a cut-off value of
332.0μmol/L for the diagnosis of NASH, and the
AUROC was 0.88, which is comparable to that of CK-18, as mentioned above. We therefore postulated that AOPP might be a new biomarker for the predic-tion of NASH.
There were some limitations in our study. The main one was a lack of biopsy-proven simple hepa-tosteatosis group and ultrasound-diagnosed pure fatty liver group, which could serve as control groups to observe the changes of AOPP levels in these groups and to determine whether serum AOPP levels differed among patients with biopsy-proven simple steatosis, ultrasound-diagnosed pure fatty liver and NASH. Another limitation was the lack of data on abdominal obesity, that is, waist circumference, which is impor-tant for the diagnosis of NAFLD.
In conclusion, we found that serum AOPP levels were significantly higher in patients with NASH than those in the control group. These levels were positively cor-related with biochemical and histopathological find-ings of NASH. AOPP, or the OS they reflect, might play a role in the development of liver inflammation and fibrosis and predict the liver histopathology in NASH. Our study should be verified and the mechanisms outlined here should be elucidated in further studies.
REFERENCES
1 Chalasani N, Younossi Z, Lavine JE et al. The diagnosis and management of non-alcoholic fatty liver disease: Practice Guidelines by the American Association for the Study of Liver Diseases, American College of Gastroenterology, and the American Gastroenterological Association. Hepatology 2012; 55: 2005–23.
2 Vernon G, Baranova A, Younossi ZM. Systematic review: the epidemiology and natural history of non-alcoholic fatty liver disease and non-alcoholic steatohepatitis in adults.
Aliment Pharmacol Ther 2011; 34: 274–85.
3 Musso G, Gambino R, Cassader M, Pagano G.
Meta-analysis: natural history of non-alcoholic fatty liver disease (NAFLD) and diagnostic accuracy of non-invasive tests for liver disease severity. Ann Med 2011; 43: 617–49. 4 Basaranoglu M, Basaranoglu G, Sentürk H. From fatty liver
to fibrosis: a tale of “second hit”. World J Gastroenterol 2013;
19: 1158–65.
5 Erhardt A, Stahl W, Sies H, Lirussi F, Donner A,
Häussinger D. Plasma levels of vitamin E and carotenoids
are decreased in patients with nonalcoholic steatohepatitis (NASH). Eur J Med Res 2011; 16: 76–8.
6 Witko-Sarsat V, Friedlander M, Capeillère-Blandin C et al. Advanced oxidation protein products as a novel marker of oxidative stress in uremia. Kidney Int 1996; 49: 1304–13. 7 Witko-Sarsat V, Friedlander M, Nguyen Khoa T et al.
Advanced oxidation protein products as novel mediators of inflammation and monocyte activation in chronic renal failure. J Immunol 1998; 161: 2524–32.
8 Kalousová M, Skrha J, Zima T. Advanced glycation end-products and advanced oxidation protein products in patients with diabetes mellitus. Physiol Res 2002; 51: 597–604.
9 Skvarilová M, Bulava A, Stejskal D, Adamovská S, Bartek J. Increased level of advanced oxidation products (AOPP) as a marker of oxidative stress in patients with acute coronary syndrome. Biomed Pap Med Fac Univ Palacky Olomouc Czech
Repub 2005; 149: 83–7.
10 American Diabetes Association. Diagnosis and classification of diabetes mellitus. Diabetes Care 2009; 32 Suppl 1: S62–7. 11 Saverymuttu SH, Joseph AE, Maxwell JD. Ultrasound
scanning in the detection of hepatic fibrosis and steatosis.
Br Med J (Clin Res Ed) 1986; 292: 13–5.
12 Kleiner DE, Brunt EM, Van Natta M et al. Design and validation of a histological scoring system for nonalcoholic fatty liver disease. Hepatology 2005; 41: 1313–21.
13 Yüksel F, Türkkan D, Yüksel I, Kara S, Celik N, Samdancı E. Fatty liver disease in an autopsy series of children and adolescents. Hippokratia 2012; 16: 61–5.
14 Day CP, James OF. Steatohepatitis: a tale of two “hits”?
Gastroenterology 1998; 114: 842–5.
15 Rolo AP, Teodoro JS, Palmeira CM. Role of oxidative stress in the pathogenesis of nonalcoholic steatohepatitis. Free
Radic Biol Med 2012; 52: 59–69.
16 Iwao Y, Anraku M, Hiraike M et al. The structural and pharmacokinetic properties of oxidized human serum albumin, advanced oxidation protein products (AOPP).
Drug Metab Pharmacokinet 2006; 21: 140–6.
17 Liu H, Han T, Tian J et al. Monitoring oxidative stress in acute-on-chronic liver failure by advanced oxidation protein products. Hepatol Res 2012; 42: 171–80.
18 Koek GH, Liedorp PR, Bast A. The role of oxidative stress in non-alcoholic steatohepatitis. Clin Chim Acta 2011; 412: 1297–305.
19 Saadeh S, Younossi ZM, Remer EM et al. The utility of radiological imaging in nonalcoholic fatty liver disease.
Gastroenterology 2002; 123: 745–50.
20 Strauss S, Gavish E, Gottlieb P, Katsnelson L. Interobserver and intraobserver variability in the sonographic assessment of fatty liver. AJR Am J Roentgenol 2007; 189: W320–3.