ss o g ^ z s
ELECTORAL POLITICAL BUSINESS CYCLES IN TURKEY A Master’s Thesis by MINE ERGUN Department o f Economics Bilkent University Ankara April 2000
ELECTORAL POLITICAL BUSINESS CYCLES IN TURKEY
The Institute o f Economics and Social Sciences o f
Bilkent University
by
MINE ERGUN
In Partial Fulfillment o f the Requirements for the Degree o f MASTER OF ARTS IN ECONOMICS
in DEPARTMENT OF ECONOMICS BiLKENT UNIVERSITY ANKARA April 2000
QOOV
SZ‘%0%z
IH
I certify that I have read this thesis and have found that it is fully adequate, in scope and in quality, as a thesis for the degree o f Master o f Economics.
Supervisor ( ijr c J . D o c . D t.
I certify that I have read this thesis and have found that it is fully adequate, in scope and in quality, as a thesis for the degree o f Master o f Economics.
Examining Committee Member
(
boc. hr. ¿erthr
)
I certify that I have read this thesis and have found that it is fully adequate, in scope and in quality, as a thesis for the degree o f Master o f Economics.
Examining Committee Member
Approval o f the Institute o f Economics and Social Sciences
ABSTRACT
ELECTORAL POLITICAL BUSINESS CYCLES
IN TURKEY
Ergtin, Mine
M.S., Department o f Economics
Supervisor: Asst. P ro f Hakan Berument
April 2000
There is an extensive empirical literature testing Political Business Cycles
hypothesis for major developed countries. This study differs from those ones at three
points. Firstly, this paper is one o f the first empirical studies testing Electoral Political
Business Cycles in Turkey that is a developing country with developing markets and
institutions. Secondly, the data set includes all the important economic policy
instruments and indicators, especially the paper uses o f extensive budget terms. Finally,
the literature studies uses annually or quarterly data, but this paper uses monthly data.
The empirical results provide significant evidence o f expansionary fiscal and monetary
policies prior to elections, leading to a significant increase in output growth.
Moreover, pre-election expansionary policies result as higher inflation after elections.
Thus, the empirical results suggest that like some o f the developed countries Turkey
has Electoral Political Business Cycles.
ÖZET
TÜRKİYE’DE SEÇİME BAĞLI POLİTİK İŞ DÖNGÜLERİ
Ergün, Mine
Master, Ekonomi Bölümü
Tez Yöneticisi; Yrd. Doç. Dr. Hakan Berument
Nisan 2000
Literatürde Politik İş Döngüleri birçok gelişmiş ülke için ampirik olarak test
edilmiştir. Bu çalışma, onlardan üç noktada farklılaşmaktadır. Öncelikle, bu çalışma
Seçime Bağlı Politik İş Döngüsüleri’nin, gelişen market ve kurumlaşma yapısıyla,
gelişmekte olan bir ülke konumundaki Türkiye için test edildiği ilk çalışmalar arasında
yer almaktadır. İkinci olarak, çalışmada kullanılan veri seti bütün önemli ekonomik
politika enstrümanlarını ve göstergelerini, özellikle detaylı bütçe verilerini içermektedir.
Son olarak, literatürde yıllık veya üç aylık frekansta veriler kullanılırken, bu çalışmada
aylık frekansta veri kullanılmıştır. Ampirik sonuçlar seçim öncesi dönemde gelişleyici
bütçe ve para politikalarının uygulandığına dair anlamlı kanıtlar sunmakta ve bunun
sonucunda üretimde anlamı bir artış gözlenmektedir. Bununla beraber, seçim öncesi
uygulanan genişleyici politikalar, seçim sonrası dönemde yüksek enflasyon olarak
etkilerini göstermektedir. Özetle, ampirik sonuçlar birçok gelişmiş ülke gibi Türkiye
için de Seçime Bağlı Politik İş Döngüleri’nin varlığını göstermektedir.
ACKNOWLEDGMENTS
I would like to thank especially Asst. Prof. Hakan Berument for his helpful
guidance throughout the whole research. I owe a great deal to all my colleagues in
SPO for their encouragement. Last, I would like to thank my parents, my sister and
Nergiz for all their endless support. Without them this thesis could not have been
TABLE OF CONTENTS
ABSTRACT... iii ÖZET. IV ACKNOWLEDGMENTS... v TABLE OF CONTENTS... vi LIST OF T A B L E S... ix LIST OF FIGURES... xiCHAPTER 1; INTRODUCTION AND LITERATURE REVIEW. CHAPTER 2: HISTROCIAL BACGROUND AND TURKISH STUDIES. CHAPTER 3: DATA DESCRIPTION... 12
3.1 Fiscal D ata... 13
3.1.1 Revenue Terms... 13
3.1.1.1 Total Revenues... 13
3.1.1.1.a Tax Revenues... 13
3.1.1.1 .al Direct Tax Revenues... 14
3.1.1.1. a2 Indirect T ax Revenues... 14
3.1.1. Lb Non-tax Revenues... 14
3 . 1 . 1 . 1 . C Other Revenues... 14
3.1.1.1. d Central Bank Short Term Advances.. 14
3.1.2 Expenditure Terms... 15
3.1.2.1 T otal Expenditures... 16
3.1.2.1 .a Non-Interest Expenditures... 16
3.1.2.1. a 1 Personnel Expenditures... 16
3.1.2.1. a2 Investment Expenditures... 18
3.1.2.1. a3 Other Current Expenditures... 18
3.1.2.1. a4 Transfers to SEEs Expenditures... 18
3.1.2.1 .aS Other Transfers... 18
3.1.3 Deficits... 19 3.2 Monetary D ata... 20 3.2.1 Monetary A ggregates... 20 3.2.1 Interest Rates... 20 3.3 Inflation Indicators... 21 3 .4 Output Indicators... 22
4; METHODOLOGY AND MODEL SPECIFICATION... 23
5: EMPIRICAL EVIDENCE AND DISCUSSION... 27
5.1 Election Effects on Fiscal Policy... 27
5.1.1 Pre-electoral Effects on Fiscal Policy... 27
5.1.2 Post-electoral Effects on Fiscal Policy... 32
5.2 Election Effects on Monetary Policy... 36
5.2.1 Pre-electoral Effects on Monetary Policy... 36
5.2.1 Post-electoral Effects on Monetary Policy... 39
5.3 Election Effects on Inflation... 41
5.3.1 Pre-electoral Effects on Inflation... 41
5.3.2 Post-electoral Effects on Inflation... 43
5.4 Election Effects on Output... 46
CHAPTER 6: CONCLUSION... 48
BIBLIOGRAPHY... 52
APPENDICES... A. ADF Unit Root Tests... 55
B: Descriptive Statistics... 56
C: Tables of the Effects o f Elections on Policy Variables and Macroeconomic Indicators... 58
1 Number Deputies and Share o f Total Votes in General Elections... 9
2 The Ratios o f Consolidated Budget Revenue Terms to GN P... 15
3 The Ratios o f Consolidated Budget Expenditure and Deficit Terms to GN P... 17
4 Effects ofElections on Expenditures in the Pre-Election Period... 29
5 Hausman F-Test Statistics for Revenues... 30
6 Effects ofElections on Revenues in the Pre-Election Period via IV ... 30
7 Effects of Elections on Revenues in the Pre-Election Period via OLS.. 31
8 Effects ofElections on Deficits in the Pre-Election Period... 32
9 Effects ofElections on Expenditures in the Post-Election Period... 33
10 Effects of Elections on Revenues in the Post-Election Period... 35
11 Effects ofElections on Deficits in the Post-Election Period... 35
12 Effects ofElections on Monetary Aggregates in the Pre-Election Period... 37
13 Effects of Elections on Interest Rates in the Pre-Election Period... 38
14 Effects ofElections on Monetary Aggregates in the Post-Election Period... 39
15 Effects of Elections on Interest Rates in the Post-Election Period... 40
16 Hausman F-Test Statistics for Inflation and O utput... 41
17 Effects ofElections on Inflation and Output in the Pre-Election Period
LIST OF TABLES
via IV ... 42
18 Effects o f Elections on Inflation and Output in the Pre-Election Period
v iaO L S ... 43
19 Effects o f Elections on Inflation and Output in the Post-Election
P e rio d ... 44
20 Effects of Elections on the Gap Between Public and Private Sector
LIST OF FIGURES
Monthly Increase in Public Sector WPl. 44
CHAPTER 1
INTRODUCTION AND LITERATURE REVIEW
Economic performance has always been an important criterion from voters’ point o f view to evaluate the performance of the government. Governments that come to power through democratic elections usually have incentives to manipulate the economy through fiscal and monetary policies to create a favorable economic environment for their supporters. Hence, Political Business Cycles (PBC) theory argues that the incumbent government aims to influence the voters prior to elections with the help o f the economic manipulations (see, Nordhaus, 1975 and Lindbeck,
1976).
This paper aims to find out if Turkish governments applied opportunistic fiscal or monetary policies prior to elections to increase their chances o f reelection during the 1987 and 1999 period. The paper further investigates the post-election effects o f the way fiscal and monetary instruments were used just prior to elections by using key indicators o f economic performance. This paper differs from the literature studies at three points. Firstly, although there exists an extensive empirical literature testing PBC hypothesis for major developed countries, there is a serious lack o f similar studies for developing countries and emerging markets with developing markets and institutions. The motivation of the paper is to fill this gap in literature. In fact, this paper is one o f the first empirical studies that discuss electoral PBC in Turkey -a developing country and an emerging market- by making a particularly extensive use o f budget terms. ^ Secondly, this paper uses an extensive data set including all the important economic policy instrument and indicators, especially for budget terms. Finally, the data set is
monthly. The empirical results suggest that like some o f the developed countries Turkey has electoral PBC.
There are two main strands o f thought that discuss the common notion o f politic intervention into the conduct of economic policy. The first line of thought in the area o f politic intervention into the economy is Partisan PBC, initiated by Hibbs (1977), dealing with characteristic differences of the economic policies of the governments according to their ideological preferences. By this line of thought, governments apply fiscal and monetary policies to favor their supporters, and economic outcomes such as the level o f output, inflation and unemployment fluctuate along time as a function o f the party’s ideology in power. However, Partisan PBC will not be considered in this paper, because Sayan and Berument (1997) tested Partisan PBC in Turkey for the time period 1957-1994, and their results have no significant evidence of Partisan PBC. Hence, this study is mainly concerned with the validity, within the Turkish context, o f the other line of thought, namely Electoral PBC.
Initiated by Nordhaus (1975) and Lindbeck (1976), Electoral PBC hypothesis argues that a strategic incumbent government would like to show a good economic performance before elections and would apply expansionary economic policies in order to influence the voters and maximize its chance o f reelection. Typically, the incumbent government is expected to influence the voters by adopting policies to increase output or decrease unemployment using the exploitable Phillips curve trade-off. Furthermore, the opportunistic manipulations done in the pre-electoral period may have important effects on the post-electoral economic performance. For instance, when the rate o f inflation begins to rise after the elections as a result o f expansionary fiscal and monetary policies, the incumbent government would try to decrease inflation by applying post-electoral contractionary fiscal and monetary policies leading to a recession in the post-election period. As a result, the economy would contract and will
be ready for a new pre-election upswing for the next elections. Hence, Electoral PBC theory suggests that there are systematic variations at some certain macroeconomic indicators, coinciding with election periods.
Empirical studies testing Electoral PBC hypothesis have been carried out for major developed counties (see, McCallum, 1978; Alesina and Sachs, 1988; Rogoff, 1990; Alesina and Roubini, 1992 and Alesina, Roubini and Cohen, 1997). These studies commonly consider first economic policy instruments such as expenditures, taxes, transfers and monetary supply in the empirical analysis and conduct tests to see if electoral PBC are applicable to countries in question. Secondly, they consider such macroeconomic outcomes as the level o f output or the rate of inflation as the
indicators o f economic performance and test policy outcomes tests with respect to the level of output growth, unemployment and inflation. The results of the empirical studies, however, are mixed and they provide little or no evidence in support o f Electoral PBC hypothesis.
Rogoff and Sibert (1988), considering economic policy instruments, state that incumbent government reduces taxes or increases government spending before elections to be seen as “more competent” than opposition. As a consequence o f signalling, an electoral cycle arises in fiscal variables, which is called “Budgetary PBC”. Although the voters dislike deficits^ (Tabellini and Alesina, 1990), all traditional and recent versions o f Budgetary PBC claim that an increase in fiscal deficits should be observed before elections, because the incumbent government will cheat by applying expansionary or loose fiscal policies before elections (Laney and Willett, 1983; Alesina, Roubini and Cohen, 1997). There is no agreement on the source o f this fiscal deficit, as either the reduction in taxes or the increase in government expenditures can be the reason. Both o f these above two policies can be observed simultaneously as well.
While Alesina and Roubini (1992) find that government spending has a tendency to increase and tax revenues have a tendency to decrease before elections, the electoral dummies do not turn out to be statistically significant in their analysis. Besides, using the US (1960-1993) data, Alesina, Roubini and Cohen (1997) find that deficits are higher in election years, but the pre-electoral dummy is again not statistically significant. However, they find significant evidence for OECD countries supporting the hypothesis of PBC that the deficit increases prior to elections. They find not only an increase in government spending, but also a decrease in tax revenues in OECD
countries. Unfortunately, the estimated coefficients o f the government spending and tax revenues are not statistically significant. Furthermore, they test subcomponents of government spending as government transfers and social security expenditures, but find no significant evidence o f Electoral PBC. Rogoff (1990) considers components o f government spending and claims that pre-electoral signalling will increase the government spending and this will lead to reductions in public investment spending, because budget cycle will appear as the distortions in the allocation of the public resources. However, the voters can recognize o f investment spending only with a lag, therefore, instead o f spending on investment projects, the incumbent government favors transfers for programs whose effects are more quickly visible. Ito and Park (1988) consider Japan and they find no significant evidence o f loose fiscal policy before elections.
Laney and Willett (1983) consider US and claim that over the 1960 1976 period, the federal deficit was related to the presidential electoral cycle and half of the deficit was monetized. Furthermore, Rogoff and Sibert (1988) also state that deficits before elections are monetised, but the voters can understand the effects of monetization on inflation only with a lag. Alesina, Roubini and Cohen (1997) consider monetary policy and find statically significant evidence o f monetary expansion in OECD countries, but not in US. While Ito and Park (1988) study Japan and find no
evidence o f expansionary monetary policy, Heckelman and Berument (1998) find significant evidence o f loose monetary policy before elections in Japan.
Alesina (1989), Alesina and Roubini (1992), Alesina, Cohen and Roubini (1993), Alesina, Roubini and Cohen (1997) consider policy outcome tests and reject the main implications of increasing growth and decreasing unemployment in election years. Alesina, Roubini and Cohen (1997) test electoral PBC for both the US and some OECD countries, but they find no evidence of increasing output growth and decreasing unemployment for both cases. Besides, Heckelman and Berument (1998) find no evidence of increasing output in Britain and Japan. Alesina, Roubini and Cohen (1997) also consider inflation, but find no evidence o f decreasing inflation prior to elections neither in the US, nor in OECD countries. However, they find evidence o f increasing inflation in the post-election period in OECD countries.
Ito and Park (1988) suggest an alternative hypothesis. Opportunistic Election Timing (OET) hypothesis, under election system that has varying election timing. OET hypothesis suggests that instead of manipulating the economy, the incumbent government can call an early election when the economic performance is good. In fact, this is easier than manipulating the economy, moreover, there is no risk of inflation after elections. Ito and Park test the implications o f OET for Japan and find that Japan is more likely to call early elections when the growth is high. While Alesina, Cohen and Roubini (1993) reject OET for all the OECD countries except Japan in their data, Heckelman and Berument (1998) consider Japan and Britain and find significant evidence supporting OET hypothesis for monetary growth in Japan contrary to Ito and Park. They also found significant evidence supporting OET in inflation, but the in regression, the coefficient o f inflation is opposite to the prediction o f PBC hypothesis.
The rest o f the study is organized as follows. Chapter 2 gives information about Turkish political life and elections, Chapter 3 describes the data, and Chapter 4 discusses the methodology. Empirical findings are reported in Chapter 5 and Chapter 6 concludes.
CHAPTER2
HISTORICAL BACKGROUND AND TURKISH STUDIES
Before discussing the effects of elections on the economic variables, it is necessary to have a sight at the history o f elections and the characteristics of the elections. Even though Turkey is parliamentary democratic republic, there have been three military interruptions in the democratic process in the history o f Turkish Republic. ^ Even so, the democratic parliamentary system has been working efficiently since the last military interruption in 1980. In fact, before the elections on October 6, 1983, a military government was governing Turkey, therefore, it did not need to manipulate the economy to impress the voters. Besides, there was lack of politic competition amongst the parties in this election due to the prohibition of some ex party leaders from making politics. When the referendum allowing pre-1980 era party leaders to make politics took place (Onis 1997) in 1987, the full politic competition in Turkey restarted. Thus, this paper deals with the time period including full politic competition and studies on the period 1985-1999 with monthly data. In fact, full politic competition is needed to test PBC, because under lack of politic competition, the performances o f different parties can not be compared in a right way. The absence o f full politic competition may lead the incumbent government to decide on economic policies and outcomes without wondering about the votes he will take in the next elections. Therefore, he may not find it worthwhile to show his best performance, because he will realize that he has no strong opposition.
There are four elections in the time period the paper considers. The first one was on November 29, 1987. The second one was on October 20, 1991. The third and
^ The first interruption was on May 27, 1960. The second and third ones were on March 12, 1971 and September 12, 1980, respectively.
the fourth ones were on December 24, 1995 and April 18, 1999, respectively. The competition at the first election, which was also the first election after 1983 elections, was mainly between two major parties; incumbent right-wing Motherland Party (Anavatan Partisi, ANAP) and left-wing Social Democratic Populist Party (Sosyal Demokrat Halkci Parti, SHP). The winner o f this competition was ANAP, and ANAP has controlled the prime ministership for four years between 1987-1991. However, restarting of politic competition resulted as party fragmentation in Turkey'". At the same time, high party fragmentation caused big parties to lose their votes. Consequently, it became difficult to have a one-party government in Turkey, and the era o f the coalitions began. Furthermore, the conflicts between coalition parties and pressure of the opposition parties that give support to the government cause the life o f coalitions to be short. As a consequence, in the second election, none o f the parties managed to get the majority of the seats in the parliamentary, therefore, the new government was founded as a coalition by the right-wing True Path Party (Dogru Yol Partisi ,DYP) as the dominant partner of the coalition and SHP, the minor partner o f the coalition. This coalition has controlled country for four years.
The third election took place on December 24, 1995. At this election, the two ex-governmental parties lost some o f their popularity and new government was founded as a coalition by two right-wing parties. Welfare Party (Refah Partisi, RP) as the dominant partner and DYP as the minor partner o f the coalition. Due to the conflicts between the two governmental parties, the government resigned and new government was founded by ANAP and Democratic Left Party (Demokratik Sol Parti, DSP) with the support o f Republican People’s Party (Cumhuriyet Halk Partisi, CHP) and Democratic Turkey Party (Demokratik Türkiye Partisi, DTP). But, there had been some politic scandals that caused the government to resign, and a minority government by DSP governed Turkey until April 18, 1999 early elections. The results
' For instance, there were 12 different parties participating in 1995 elections and only 5 of them could enter into the parliamentary'.
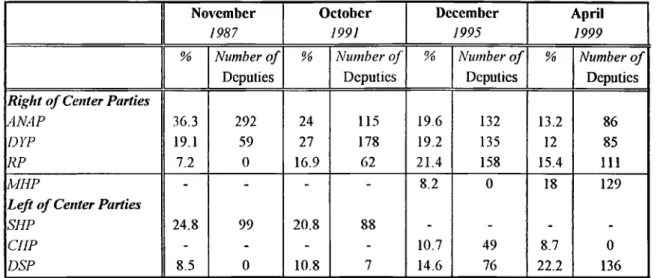
o f the last election were not again permitting for a majority government, therefore new coalition was founded by DSP, Nationalist Action Party (Milliyetci Hareket Partisi, МНР) and ANAP. The number o f deputies and the percentage o f the votes parties took in the elections are represented in Table 1.
Table 1- Number of Deputies and Share of Total Votes in General Elections
November October December April
1987 1991 1995 1999
% Number o f
%
Number o f % Number o f%
Number o fDeputies Deputies Deputies Deputies
Right of Center Parties
ANAP 36.3 292 24 115 19.6 132 13.2 86
DYP 19.1 59 27 178 19.2 135 12 85
RP 7.2 0 16.9 62 21.4 158 15.4 111
МНР - - - - 8.2 0 18 129
Left of Center Parties
SHP 24.8 99 20.8 88
CHP - - - - 10.7 49 8.7 0
DSP 8.5 0 10.8 7 14.6 76 22.2 136
Note: ANAP (K4otherland Party), DYP (True Path Party), RP (IVelfare Party)MHP( Nationalist Action Party), SHP (Social Democratic Populist Party), CHP (Republican People \s Party), DSP (Democratic Left Party)
The government has changed after two o f the four elections (1991 and 1995),
and accordingly the economic policies applied by the governments have differed. The
high election frequency^ therefore, leads to the different applications and priorities in
the economic policies. Turkish election system is flexible, therefore, the government
has the chance of calling early election. All the elections, except the one in 1987, were
early and they were announced approximately three or four months before election
dates.
Although the electoral system o f each election differs at some stages, their
characteristics are the same. To be represented in the parliamentary, there was a 10
per cent barrier for the parties in all o f the four elections. In other words, to be
represented in the parliamentary, a party must take at least 10 per cent o f the votes
around the country. High party fragmentation made it difficult for the parties to
overcome this barrier, therefore some of the parties made election agreements.^ In
fact, some old ex-parliamentary parties who did not make election agreements could
not overcome 10 per cent barrier and could not be represented in the parliamentary in
1991, 1995 and 1999 elections^
Under the scope of the historical political background, now a recent study will
be discussed. Ozatay (1999), considering a quarterly data set from 1985 to 1995,
found some evidence of PBC in fiscal and monetary policies prior to elections in
Turkey. As monetary instruments he tested net domestic assets and monetary base
and he found evidence o f monetary expansion (in net domestic assets) prior to
elections. As fiscal instruments he considered total government expenditures and
other transfers. In fact, he found that other transfers term, increased significantly prior
to elections. Thus, he concluded that politicians manipulated the economy using fiscal
and monetary policies. However, he only considered a limited number of fiscal and
monetary variables. In fact, he did not consider budget deficits or tax revenues or
personnel and investment spending which are channels for the government to signal
^ In 1991 election МНР made an election agreement with RP, whereas BBP (Great Unity Party) made an election agreement with ANAP in 1995 election.
’For instance, in 1995 election МНР and ini 999 elections CHP could not enter parliamentary because of 10 per cent barrier.
his competency. Besides, he did not consider about the interest rate as a monetary
instrument. However, Berument and Malatyali (1998) claimed that Turkish Central
Bank used interbank rate as an instrument to target M2Y. Besides, Ozatay tested
inflationary effects in the post-election period due to the expansionary fiscal and
monetaiy policies done in the pre-election period. Hence, he found evidence of
increasing inflation in the post-election period. However, he did not consider the post-
electoral behaviour o f fiscal and monetary variables. Finally, he tested if the price of
public goods and services are manipulated before elections and concluded that the gap
between the rate of increase in public and private sector prices increased prior to
elections, although this gap is eliminated just after the elections.
Ozatay considers not only general elections, but also the municipal elections in
his analysis. But, in this paper it is assumed that the economic policies applied for
general and municipal elections differ. In fact, general and municipal elections are
considered separately. However, the municipal elections have no significant effect on
policy instruments and economic indicators, on the contrary general elections have
significant effects. The reason can be the fact that, in the municipal elections, the
allocation o f the expenditures of government along the country changes rather than
the amount of the expenditures. Thus, in the study the empirical results o f the effects
o f general elections are discussed.
CHAPTER 3
DATA DESCRIPTION
The data set includes monthly data for fiscal and monetary policy indices and measures of economic performance such as, inflation and output indicators between 1985:1 and 1999:5. The first reason o f choosing the period is the data availability of fiscal and monetary figures and inflation and production indicators are only efficiently available after 1985. The second reason is to see the pre-electoral effects of 1987 elections. Final reason is the existence of full politic competition discussed in section 2. Monthly data is not generally studied in literature. But, using high frequency data increases the number of observations and provides to examine the policies applied by the government more sensitively. For instance, suppose there is a significant increase in one o f the expenditure terms just one or two months before elections. If low frequency data (quarterly or annual) is studied, the significant fiscal manipulation may not be detected; however, studying with higher frequency data (such as monthly) may increase the probability to detect the significance change in variables.
Turkey has been governing by coalition governments for nine years and there always exist conflicts between the partners o f the coalitions. Consequently, there exists high politic instability in Turkey during the time period the paper concerns. In fact, the government has changed for three times between 1995-1999, because o f conflicts between the coalition partners. Thus, monthly data provides to examine the economic behaviour o f frequently chancing government.
In the following subsections the data set will be described extensively. In section 3.1 fiscal data, in section 3.2 monetary data, in section 3.3 inflation indicators
and 3,4 section output indicators are described. All the variables in the data set are tested for unit roots and the results of ADF tests are presented in Appendix A. Moreover, the standard statistical properties o f the data are presented in Appendix B.
3.1 Fiscal Data
Fiscal data consists o f central government’s consolidated budget with both revenues and expenditure terms. All the fiscal variables are used as a ratio o f revenues in the analysis. The reason of this will be discussed later in section 5.1. Fiscal data set is taken from Turkish Ministry of Finance, General Directorate o f Public Accounts Monthly Bulletins and Turkish Central Bank Electronic Data Delivery System (CBEDS) including 1985:1 and 1999:5. The revenue and expenditure terms o f the budget will be discussed in section 3.1.1 and 3.1.2, respectively. Section 3.1.3 discusses the deficits.
3.1.1 Revenue Terms 3.1.1.1 Total Revenues
The revenue terms of the consolidated budget, which are in the concern o f this paper, are discussed below. The ratios of revenue terms to GNP are presented in Table 2.
3.1.1.1.a Tax Revenues
Tax revenues are the major term o f revenues. In fact, between 1987-1998, the average ratio o f tax revenues to GNP is 13.4 per cent, where the average ratio o f total revenues to GNP is 16.8 per cent.
3.1.1.1. a l Direct Tax Revenues
Direct tax revenues include revenues o f taxes on income and wealth. Direct tax revenues constitute approximately half o f tax revenues. In fact, the average ratio of direct tax revenues to GNP is 6.3 per cent between 1987 and 1998.
3.1.1.1. a2 Indirect Tax Revenues
Indirect tax revenues include revenues o f taxes on goods and services. The average ratio o f indirect taxes to GNP is 7.1 per cent between 1987-1998.
3.1.1.1. b Non-tax Revenues
Non-tax revenues usually include portfolio and interest revenues of Treasury, fine revenues, rent revenues, revenues of sales of immovables.
3.1.1.1. C Other Revenues
Other revenues include revenues from budgetary funds and transfers from some special funds.
3.1.1.1. d Central Bank Short Term Advances
Another budget revenue term is the central bank short time advances. To be more clear, central bank provides short-term credit with low interest rates to the Treasury. The limit o f this credit is determined with a ratio of the budget deficit by regulations. Although after 1995 new low obligatory limits were set for this term, between 1991 and 1996, central bank short-term advances have a significant ratio to
GNP; in fact in 1993 its ratio to GDP is 2.7 per cent. Thus, Turkish governments made use of this monetarazation term as a budget-financing instrument in that time period. Whether there exists significant increase in financing budget by using short time advances during election times will be tested.
Table 2 -The Ratios of Consolidated Budget Revenue Terms to GNP (%)
Revenues Tax Revenues Direct Taxes Indirect Taxes Nontax Revenues Other Revenues CB Advances 1987 13.92 12.06 5.99 6.08 1.1 1.86 -1.17 1988 13.61 11.02 5.47 1.97 2.60 -0.09 1989 13.62 11.09 5.92 5.17 1.97 2.53 -0.29 1990 14.24 11.43 5.96 5.47 2.02 2.81 -0.39 1991 15.25 12.40 6.48 5.92 1.38 2.85 -0.55 1992 15.79 12.83 6.47 6.36 2.68 2.96 -1.02 1993 17.59 13.23 6.42 6.80 4.11 4.36 -0.16 1994 19.16 15.12 7.30 7.82 3.89 4.05 -0.51 1995 17.88 13.82 5.62 8.19 3.68 4.06 -0.38 1996 18.04 14.98 5.90 9.08 2.87 3.06 -0.31 1997 19.92 16.16 6.57 9.59 3.44 3.76 -0.41 1998 22.21 17.25 8.04 9.21 4.62 4.96 -0.59
For an incumbent government all the above terms are channels o f signalling by applying opportunistic policies. For instance, the government can decrease the rents o f the house provided to employees or excuse the penalties before elections concerning non-tax revenues. But, the main concern of this paper is tax, direct and indirect tax revenues. Since, they are the dominant revenue terms of the budget.
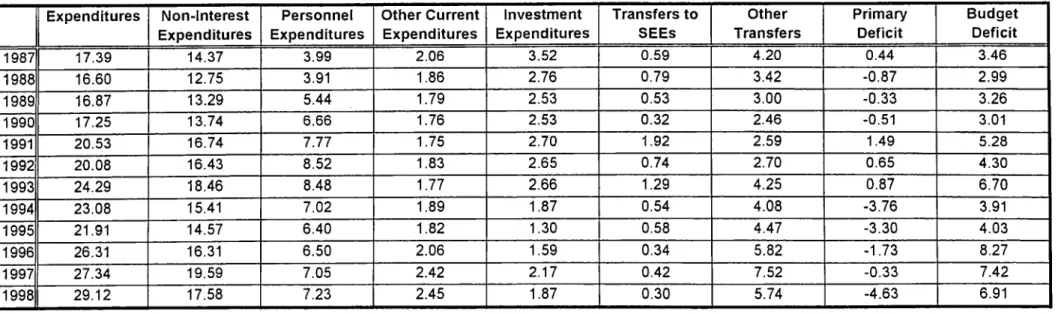
3.1.2 Expenditure Terms
The expenditure terms of consolidated budget, which are in the concern o f this paper, are discussed below. The ratios of the expenditure terms to GNP are presented in Table 3.
Government total consolidated budget expenditures mainly consist of expenditures and non-interest expenditures. However, interest payments are inherited from the past, therefore, they do not reflect the expenditures o f government and depend on the interest rates, which can not be directly controlled by the government. Moreover, interest payments depend on the borrowing strategies and policies of the ex-governments. Thus, interest expenditures do not have any implications about the policies adopted by the present government, therefore, this paper does not consider interest payment expenditures.
3.1.2.1. a Non-Interest Expenditures
Non-interest expenditures include government total consolidated budget expenditures excluding interest payment expenditures. Hence, they reflect the real current spending of the government, because interest payment expenditures are excluded as discussed above. Besides, the average ratio of non-interest expenditures to GNP is 15.8 per cent between 1987 and 1998, where the average ratio o f total revenues to GNP is 21.7 per cent. Non-interest expenditures consist of mainly 5 parts;
3.1.2.1, a l Personnel Expenditures
The large number o f governmental workers makes personnel expenditures significant for populist policies, because the incumbent government can impress the large portion o f the voters by making an improvement in their salaries. Besides, personnel expenditures is the largest non-interest expenditure term and the average ratio o f personnel expenditures to GNP is 6.6 per cent between 1987 and 1998.
3.1.2.1 Total Expenditures:
Table 3 - The Ratios of Consolidated Budget Expenditure and Deficit Terms to GNP (%)
E xp en d itu res N o n -In terest E xp en d itu res P ersonnel E xp en d itu res O th e r C u rren t E xp en d itu res Investm ent E xp en d itu res T ran sfers to SEES O th er T ran sfers P rim ary D eficit B u d g et D eficit 1987 17.39 14.37 3.99 2.06 3.52 0.59 4.20 0.44 3.46 1988 16.60 12.75 3.91 1.86 2.76 0.79 3.42 -0.87 2.99 1989 16.87 13.29 5.44 1.79 2.53 0.53 3.00 -0.33 3.26 1990 17.25 13.74 6.66 1.76 2.53 0.32 2.46 -0.51 3.01 1991 20.53 16.74 7.77 1.75 2.70 1.92 2.59 1.49 5.28 1992 20.08 16.43 8.52 1.83 2.65 0.74 2.70 0.65 4.30 1993 24.29 18.46 8.48 1.77 2.66 1.29 4.25 0.87 6.70 1994 23.08 15.41 7.02 1.89 1.87 0.54 4.08 -3.76 3.91 1995 21.91 14.57 6.40 1.82 1.30 0.58 4.47 -3.30 4.03 1996 26.31 16.31 6.50 2.06 1.59 0.34 5.82 -1.73 8.27 1997 27.34 19.59 7.05 2.42 2.17 0.42 7.52 -0.33 7.42 1998 29.12 17.58 7.23 2.45 1.87 0.30 5.74 -4.63 6.91 17
3.1.2.1. a2 Investment Expenditures
As mentioned before, RogofF (1990) asserts that investment spending o f the government decreases before elections. Thus, the total consolidated budget investment expenditures will be used to test this assertion for Turkish case.
3.1.2.1. a3 Other Current Expenditures
Other current expenditures mainly include expenditures o f security forces other agencies.
3.1.2.1. a4 Transfers to State Economic Enterprises (SEEs)
Transfers to SEEs term is significant for the analysis amongst the expenditure terms, because most of Turkish SEEs are losing money and can not compensate their expenditures, thus a significant portion of the budget is channelled to SEEs. Moreover, SEEs are channels for implementation o f social and distributive government policies. Some of the SEEs buy agricultural products of subsidized prices and sell them at market prices, therefore, they are vehicles o f subsidizing agriculture support policies (see, Atiyas and Sayin, 1998).
3.1.2.1. a5 Other Transfers
Other transfers include transfer expenditures except transfers to SEEs and interest payments. Since other transfer does not include transfers for interest payments, other transfers term is used rather than total transfers. In general, other transfers consist o f transfers to social security institutions, municipalities, agricultural subsidy institutions, support and price stabilization funds and off-duty losses. All these
terms are very crucial for the analysis, because they give opportunity to governments to apply populist policies; consequently an increase in any of them will be an indicator o f opportunistic cycle in Turkey. In fact, Ozatay (1999) points out that Turkish politicians use social security as a signalling channel and he gives the example o f the retirement age, which has been changed from time to time in Turkey. Due to the unavailability o f the monthly data for the subcomponents of the other transfers tern, they can not be tested for PBC separately. Moreover, this term is on the average second largest term among the non-interest expenditures in 1987-1998 with a ratio of 4.2 per cent to GNP.
3.1.3 Deficits
There are two deficit terms in the consolidated budget: primary and budget deficits. These figures will be to examine the interaction of the revenues and expenditures at election periods. In fact, the deficits give more information about the type o f fiscal policy (tight or expansionary). Budget deficit is defined as the difference between government expenditures and revenues and taken as positive when total government expenditures exceed its revenues, whereas primary deficit is the budget deficit excluding interest expenditures. In fact, as presented in Table 3, Turkish budget has been giving budget deficit for all the years in the concern time period, even though it usually gives primary surplus in the same period. However, in the two election years, 1987 and 1991, the budget gives primary deficit, whereas in 1995 it gives primary surplus.
in empirical tests for monetary policy, it is not clear to use monetary aggregates or interest rates as the monetary policy proxy. In literature, it is common to use monetary aggregates as the proxies o f the monetary policy, however to use which monetary aggregate as the proxy is again not clear. On the other hand, in many countries interest rates are used as the main instruments o f monetary policy during the times when monetary demand changes due to the financial innovations and deregulation (Alesina, Roubini and Cohen, 1997). Thus, in this paper both monetary aggregates and interest rates are tested for the existing of PBC not to miss any kind o f manipulations or their effects.
3.2.1 Monetary Aggregates
This paper deals with 5 different monetary supply aggregates: quasimoney, which is the sum of time deposits and liabilities o f central bank, reserve money (MO), M l, M2, and M2Y, where M2Y is the sum o f M2 with foreign time deposits. All the monetary aggregates are used as their logarithmic growth in the empirical analysis and the unit root tests are presented in Appendix A. Monetary aggregate data is taken
from International Monetary Fund’s Financial Series and includes time period 1985:1 1998:10, because of the availability o f the data.
3.2.2 Interest Rates
This paper also considers interest rates to test the election effects on monetary policy. The data set includes five different interest rates: three-month Turkish Lira (TL) time deposit rate, three month United States (US) dollar time deposit rate, nominal and real treasury rates and interbank rates, where treasury rate is calculated
3.2 M onetary Data
as the weighted average of interes7t rates o f Treasury auctions at that month. Real treasury bill rate is calculated by deflating nominal treasury rate with whole sale price index (WPI). These 5 different interest rates are chosen, because, firstly interbank rate is an instrument of the Central Bank to manipulate monetary market and reflects the short term market rate. In fact, Berument and Malatyali (1998) show that the monetary policies of Turkish Central Bank can be evaluated by looking at interbank rate instead of monetary aggregates. Moreover, they claim that Turkish Central Bank uses interbank rate as an instrument to target M2Y. Secondly, three-month TL and US time deposit rates reflect the demand for TL and foreign currency. Thirdly, although, treasury rates are not related to monetary policy and reflect only the borrowing comforts o f the Treasury, they are discussed in this section, due to being interest rate.
Interest rates, which are non-stationary, are used in logarithmic groAvths (see. Appendix A). Time deposit and foreign currency deposit rates are taken from Central Bank Electronic Delivery System (CBEDS) including 1985:1 and 1999:7 time period. Nominal treasury rates are taken from State Planning Organization (SPO) Economic Indicators including time period 1987:7 and 1999:5, whereas interbank rate is taken from IFS including time period 1985:1 and 1998:10, because of the availability o f the data.
3.3 Inflation Indicators
This paper also considers the effects o f elections on inflation. Hence, consumer price index (CPI) and WPI are used in this paper to see the effects o f pro- electoral fiscal and monetary policies on inflation. Moreover, public sector WPI and private sector WPI are used to examine the reactions of the two different sectors to
pre-electoral manipulations. Public sector WPI reflects the price level of government goods and services, whereas private sector WPI reflects the price level of private goods and services, where, WPI is the weighted average of the public and private sector whole sale price indexes. In the empirical analysis, logarithmic monthly growth o f the indexes are used, because all of the indexes are non-stationary (see. Appendix A). The three WPFs are taken for CBEDS, as the WPI calculated by Turkish Treasury including time period 1985:1 and 1999:7 and CPI is taken from Turkish State Statistics Institute (SSI) including the time period 1987:1 and 1999:5.
3.4 Output Indicators
In this paper, industrial production index is used to examine the effects of the manipulations to the economy during elections on output. Industrial production index is used a proxy for output instead of real GDP, because monthly real GDP is not available for Turkey. Similar to price indexes, monthly growth of logarithmic industrial production index is used, because industrial production index is non- stationary (see. Appendix A). Production index is taken from Turkish State Statistics Institute including time period 1986:1 and 1999:5.
CHAPTER 4
METHODOLOGY AND MODEL SPECIFICATION
This paper aims to test electoral PBC in Turkey using the monthly data from
1985;1 to 1999:5. To test the implication o f PBC theory, the following model 1 is
estimated.
T, = a + Z A - + (1) k=l, 2,...6
1=1
In Model 1, policy variable y^. is assumed to follow an autoregressive process
and this pattern is assumed to be interrupted by elections as measured by the dummy
term d,. St is the error term at time t, n is the lag order and is specified by looking at
Akaike information criterion and k is the month the dummy represents*. The primary
interest o f this paper is the coefficient 5^ o f the electoral dummy dk in this model. In
other words, the coefficient 5k is tested under the null hypothesis (Hq: 5k=0). The sign
o f 5k gives the direction o f the correlation between election periods and the policy
variables. Moreover, the significance of 5k gives information about the significance o f
the correlation and provides empirical evidence for the existing o f PBC. This type o f
specification is often used in literature (see, McCallum (1978), Alesina and Sachs
(1988), Ito and Park (1988), Alesina, Cohen and Roubini (1993) and Heckelman and
Berument (1998)).
* In fact, in empirical study effects of elections arc tested for 12 months and the corresponding results are presented in Appendix C.
An alternative methodology to see the effects of elections on yt can be estimating the above Model 1 using the sum o f the electoral dummies and considering the null hypothesis that each of the coefficient o f the dummies is equal to zero. However, there may exist multicollinearity problem amongst the electoral dummies and the policy variable yi in such a model. To avoid such a multicollinearity problem, therefore. Model 1 is used for empirical analysis.
In order to estimate Model 1, ordinary least square (OLS) regression procedure is used. But, OLS assumes the residual terms are uncorrelated with the explatonary variables in order to have unbiased estimates. However, if the explatonary variables are correlated with the residuals and accordingly with the dependent variable, then simultaneity bias problem will arise, consequently, the estimates yield by OLS will be biased. Hence, model will be misspecified and OLS will not be an appropriate process to estimate the given data.
In the concern of this paper, simultaneity bias problem may arise if the incumbent government calls an early election when the economic performance is going good as mentioned in Section 1 (Ito and Park, 1988). Hence, the considered cyclic policy variables and economic indicators may influence election timing. As a consequence, election timing will not be exogenous and estimating Model 1 via OLS will give biased estimates causing a simultaneous endogeneity problem. Ito and Park (1988) and Alesina, Cohen and Roubini (1993) suggested different procedures to test exogeneity o f elections. Later, Heckelman and Berument (1998) used Hausman Specification test procedure (1978). To decide on the exogeneity of elections for policy variable yi, they include an instrumental variable ctk, in their model and consider an F-test to test the restriction 6 \= 0 . This paper follows their methodology
to test the exogeneity o f elections. Thus, the instrument variable, is included in Model 1 as:
T, = a + Z
Piy,-i
+Sk-dk
+ + 7/, (2)/ = 1
Then, to check whether simultaneity bias problem exists Hausman’s (1978)
second test is applied under the null hypothesis (Ho=5*k). Thus, if the null hypothesis
is not rejected, election timing will be exogenous for yt and OLS estimation will give
unbiased reliable results. However, if the null is rejected, then election timing will be
endogenous for yt and model will be misspecified leading to give biased results via
OLS. In the case of endogeneity, the reliable estimates are the ones via IV. In the
concern of this paper, variables that government can not control directly or has less
power to control is expected to have endogenous election timing. Thus, elections
should be exogenous for government spending (Keil, 1988), whereas government
revenues can be endogenous since government does not have the individual power to
decide on the level of revenues. Besides, Turkish Central Bank is not considered as an
independent central bank, thus money supply equations should have exogenous
election timing. Finally, with respect to spending and money supply equations, the
equations of economic indicators as output growth and inflation are more likely have
endogenous election timing. In fact, the results of the Hausman test support this
intuition. In addition, instrument variable (IV) technique is used to estimate the
equations that have simultaneous endogeneity problem.
Finally, pre and post electoral effects o f elections on policy variables are
examined using two alternative types o f electoral dummies ¿4 and pd^. dk's are
constructed such that, they are equal to unity for the month of the election and k
months before the elections and zero otherwise. The second type of the electoral
dummies, dpus are constructed such that they are equal to unity at the election month
and k months after the elections and zero otherwise.
Meanwhile, as mentioned in section 3, there are some non-stationary variables
in the data set as can be seen in Appendix A. Therefore, the difference form of the
non-stationary series are used in the regressions to have white noise residuals.
CHAPTER 5
EMPIRICAL EVIDENCE AND DISCUSSION
In this chapter, the empirical results for the effects of elections will be discussed within the following subsections. The effects of elections on fiscal variables is discussed in section 5.1, on monetary policy is discussed in section 5.2 and on inflation and output is discussed in section 5.3 and section 5.4, respectively.
5.1 Election Effects on Fiscal Policy
Model 1 has been estimated for all fiscal variables with the electoral dummies defined in section 4 to test the hypothesis that governments apply expansionary fiscal policies before elections. In regressions, fiscal variables measured at their ratios to total government revenues, because this paper aims to test what is the behaviour of a fiscal variable compared with the behaviour o f other fiscal variables during elections. In section 5.1.1 pre-electoral and in section 5.1.2 post-electoral effects on fiscal policy variables will be discussed, respectively.
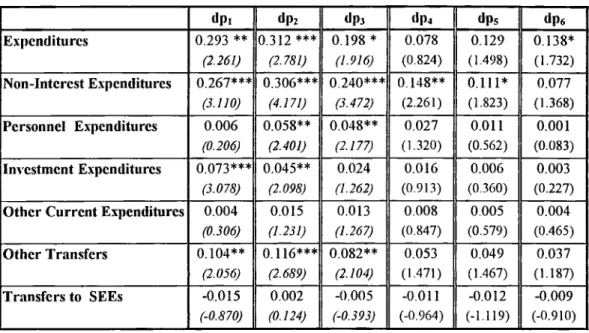
5.1.1 Pre-electoral Effects on Fiscal Policy
Table 4 presents the empirical evidence of pre-electoral effects on the terms o f government expenditures. ^ Government decides on amount of its expenditures.
’ In the empirical study, pre and post electoral effects on policy instruments and measures of economic performance is considered for 12 months and the results are presented in Appendix C.
therefore, it has the opportunity to control them. However, government can not decide on its revenues, because its revenues may change due to the factors government can not directly control*'*. In fact, simultaneous bias (endogeneity) problem may arise for revenue terms and OLS estimates may not be biased. Thus, simultaneous endogeneity is tested by applying Hausman tests and in the case of endogenous election timing, estimates via instrument variable (IV) technique will be discussed.
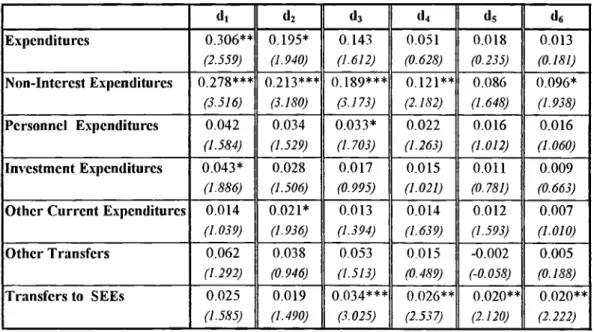
The empirical evidence presented in Table 4 suggests that government
expenditures statistically significantly increase before elections and government
expenditures have the highest correlation with the electoral dummy representing the
first month before elections. Besides, the empirical evidence also suggests that the estimated coefficient for non-interest expenditures increase statistically significantly prior to elections and non-interest expenditures have the highest correlation with the pre-electoral dummy representing the first month before elections.
Considering the subcomponents o f non-interest expenditures; personnel,
investment, other current expenditures, transfers to SEEs and other transfers are
estimated separately using Model 1. The empirical evidence suggests that the estimated coefficient o f personnel expenditures increases statistically significantly before elections and personnel expenditures have the highest correlation with the electoral dummy representing three months before elections. Besides, the estimates presented in Table 4 suggest that investment expenditures, contrary to Rogoff (1990), increase significantly prior to elections. Other current expenditures also increase statistically significantly before elections and other current expenditures have the highest correlation with the electoral dummy representing two months before elections. Moreover, our empirical evidence suggest that the estimated coefficient of
For instance, taxes such as VAT depend on the consumption behavior of the agents that government can not directly control
(ransfers to SEEs significantly increases before elections and transfers to SEEs have
the highest correlation with the pre-electoral dummy representing three months before elections. Besides, the empirical evidence suggests that the estimated coefficient of
other transfers increases before elections, but there exists no statistically significant
correlation between other transfers and pre-electoral dummies. Although other
transfers term is an appreciate term for implementing populist policies including social
security and agricultural and price subsidies, the government does not statistically significantly use this expenditure term. On the contrary, Ozatay (1999) finds statistically significant evidence of increasing other transfers prior to elections using the first difference and real forms of other transfers.
TABLE 4 - Effects of Elections on Expenditures in the Pre-Election Period
d , d2 d3 d4 ils d« Expenditures 0.306** (2.559) 0.195* (1.940) 0.143 (1.612) 0.051 (0.628) 0.018 (0.235) 0.013 (0.181) Non-Interest Expenditures 0.278*** (3.516) 0.213*** (3.180) 0.189*** (3.173) 0.121** (2.182) 0.086 (1.648) 0.096* (1.938) Personnel Expenditures 0.042 (1.584) 0.034 (1.529) 0.033* (1.703) 0.022 (1.263) 0.016 (1.012) 0.016 (1.060) Investment Expenditures 0.043* (1.886) 0.028 (1.506) 0.017 (0.995) 0.015 (1.021) 0.011 (0.781) 0.009 (0.663)
Other Current Expenditures 0.014
(1.039) 0.021* (1.936) 0.013 (1.394) 0.014 (1.639) 0.012 (1.593) 0.007 (1.010) Other Transfers 0.062 (1.292) 0.038 (0.946) 0.053 (1.513) 0.015 (0.489) -0.002 (-0.058) 0.005 (0.188) Transfers to SEEs 0.025 (1.585) 0.019 (1.490) 0.034*** (3.025) 0.026** (2.537) 0.020** (2.120) 0.020** (2.222) *** indicates 1 %, ** indicates 5 % and * indicates 10 % significance level.
Note: t-statistics are reported in parenthesis for the corresponding coefficient.
In brief, the empirical evidence suggests that more of total revenues are
channelled to the government expenditures. Thus, over all empirical evidence is
parallel with PBC theory where government adopts expansionary fiscal policies to
manipulate the economy before elections.
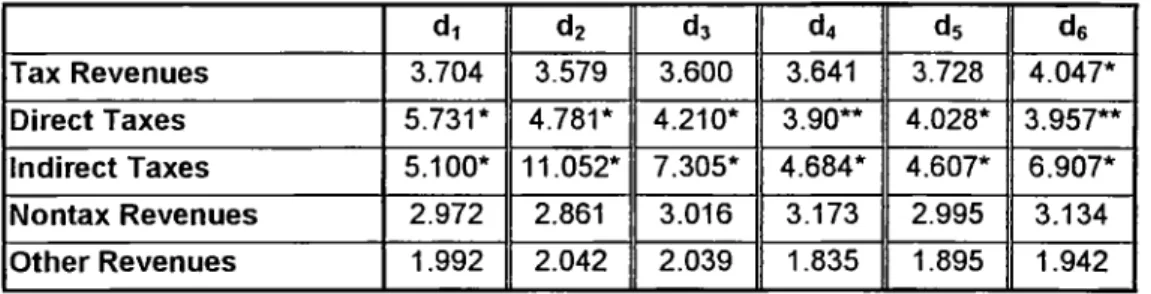
As mentioned before, simultaneous endogeneity problem may arise for revenue terms. Before discussing pre-electoral effects on revenues, Hausman test based on model 2 are applied to the revenue terms and the results are presented in Table 5. Given our choice o f instrument variables, Hausman statistics are significant for direct and indirect tax revenues, thus the elections are endogenous for them. Thus, OLS estimates are biased for direct and indirect tax revenues.
TABLE 5 - Hausman F-Test Statistics for Revenues
di dz dj d4 ds de Tax Revenues 3.704 3.579 3.600 3.641 3.728 4.047* Direct Taxes 5.731* 4.781* 4.210* 3.90** 4.028* 3.957** Indirect Taxes 5.100* 11.052* 7.305* 4.684* 4.607* 6.907* Nontax Revenues 2.972 2.861 3.016 3.173 2.995 3.134 Other Revenues 1.992 2.042 2.039 1.835 1.895 1.942
* indicates 1 % and ** indicates 5 % significance level..
TABLE 6 - Effects of Elections on Revenues in the Pre-Election Period via IV
d i di dj d4 ds d6 Tax Revenues -0.062 (-0.521) -0.032 (-0.391) -0.025 (-0.349) -0.036 (-0.565) -0.038 (-0.560) -0.060 (-0.811) Direct Taxes -0.122 (-1.404) -0.060 (-1.071) -0.034 (-0.757) -0.028 (-0.668) -0.019 (-0.457) -0.031 (-0.669) Indirect Taxes 0.276 (0.502) 0.819 (0.568) 0.325 (0.781) 0.057 (0.513) -0.018 (-0.278) -0.084 (-1.149) Nontax Revenues 0.033 (0.208) 0.001 (0.006) -0.027 (-0.264) -0.052 (-0.476) -0.019 (-0.150) -0.056 (-0.332) Other Revenues -0.020 (-0.164) -0.026 (-0.295) -0.025 (-0.354) -0.006 (-0.096) -0.013 (-0.197) -0.019 (-0.257) *** indicates 1 %, ** indicates 5 % and * indicates 10 % significance level.
Note: t-statistics are reported in parenthesis for the corresponding coefficient.
Table 6 presents the estimates of revenue terms via IV” . The empirical evidence suggests decreasing direct tax revenues prior to elections. But, the correlation between the pre-electoral dummies and direct and indirect tax revenues are not statistically significant. Thus, the empirical evidence does not provide statistically significant evidence supporting OET hypothesis for revenues o f the government.
The results of Hausman test presented in Table 5 suggest that OLS estimates o f revenue terms except direct and indirect tax revenues are unbiased. Hence, Table 7 presents empirical results via OLS for the revenue terms in the pre-election period.
TABLE 7 - Effects of Elections on Revenues in the Pre-Election Period via OLS
d, d3 d4 ds d« Tax Revenues -0.017 (-0.701) -0.012 (-0.596) -0.008 (-0.434) -0.016 (-0.957) -0.01 (-0.657) -0.011 (-0.729) Direct Taxes -0.029 (-1.398) -0.025 (-1.431) -0.022 (-1.465) -0.032** (-2.402) -0.028** (-2.298) -0.029** (-2.472) Indirect Taxes 0.016 (0.833) 0.011 (0.702) 0.011 (0.794) 0.01 (0.814) 0.008 (0.666) 0.006 (0.521) Nontax Revenues -0.003 (-0.178) -0.003 (-0.201) -0.009 (-0.613) -0.005 (-0.403) -0.007 (-0.616) -0.011 (-0.962) Other Revenues 0.016 (0.652) 0.011 (0.554) 0.007 (0.364) 0.015 (0.928) 0.009 (0.580) 0.009 (0.635) CB Advances 0.109 (1.308) 0.080 (1.163) 0.044 (0.728) 0.038 (0.690) 0.034 (0.661) 0.029 (0.606) *** indicates 1 %, ** indicates 5 % and * indicates 10 % significance level.
Note; t-statistics are reported in parenthesis for the corresponding coefficient.
The empirical evidence suggests decreasing tax revenues prior to elections, thus total tax revenues and non-tax revenues decrease in the pre-election period. However, tax revenues and non-tax revenues are not statistically significant correlated with election dummies. Besides, central hank short term advances increase prior to elections, but the estimated coefficient is not statistically significantly, either.
" In the empirical study, pre-elcctoral effects on revenue terms via IV for 12 months is also considered and the results are presented in Appendix C, Table C3.
Although, the empirical evidence is not statistically significant for revenue terms, it suggests that the ratio o f tax revenues in total revenues decrease in the pre election period, implying that the incumbent government applies loose revenue policy prior to election periods.
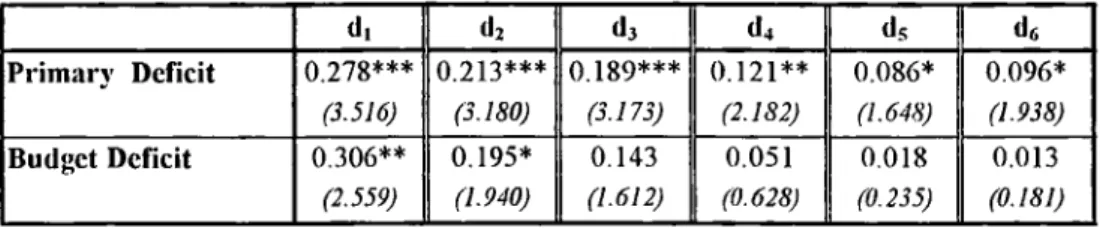
Table 8 presents the pre-electoral effects on budget deficits. As a consequence o f expansionary fiscal policies, the fiscal deficit is expected to increase prior to
elections. Hence, empirical evidence supports the hypothesis of PBC that budget deficit increases prior to elections. Although Turkish budget gives usually primary surplus, empirical evidence suggests that the estimated coefficient of primary deficit statistically significantly increases in the pre-election period. Furthermore, it also suggests that the estimated coefficient of budget deficit statistically significantly increases in the pre-election period. In fact, both primary and budget deficits have the highest correlation with the electoral dummy representing one month before elections. The reason o f the increase in deficit is the statistically significant increase in government spending, since the decrease in tax revenues is not statistically significant.
TABLE 8 - Effects of Elections on Deficits in the Pre-Election Period
d, d2 d3 d4 ds di
Primary Deficit 0.278***
(3.516)
0.213***(3.180)
0.189***(3.173)
0.121**(2.182)
0.086*(1.648)
0.096*(1.938)
Budget Deficit 0.306**
(2.559)
0.195*(1.940)
(1.612)
0.143(0.628)
0.051(0.235)
0.018(0.181)
0.013*** indicates 1 %, ** indicates 5 % and * indicates 10 % significance level. Note: t-statistics are reported in parenthesis for the corresponding coeificicnt.
5.1.2 Post-Electoral Effects on Fiscal Policy
Table 9 presents the post-electoral effects on government expenditures. Thus, the estimated coefficient for the total government expenditures increases statistically