BI-ANGULAR LENS FOR MATERIAL CHARACTERIZATION
G.G.
Yaralioglu,A.
Atalar,H.
Koymen Electrical and Electronics Engineering Department Bilkent University,06533
Bilkent, Ankara,TURKE\’
Abstract - In this paper a new lens design is pro- posed for characterization of layered materials. Lamb wave lens employs Lamb waves for this purpose since these waves propagate along interfaces. However, below cut-off angle, the critical angles of Lamb wave modes are low and the generated V(z) curves have small num- ber of oscillations, which in turn causes measurement difficulties and accuracy degradation. Bi-angular lens described in this paper, generates an extra obliquely in- cident wave, instead of normally incident beam, in order to provide the reference specular reflection. Simulation results as well as experimental results are presented and it is shown that a high sensitivity can bc obtained by using this new lens.
Introduction
It is well-known that when a solid half space, coated by a layer of material with shear velocity less than the substrate’s shear velocity, is insonified by an acoustic beam, there exists many leaky Lamb wave modes 11)-
[3]. These modes are observed as oscillations in V(z)
curves and their velocities can be calculated by spectral analysis or model based algorithms [4].
The accuracy of the Leaky wave velocity extraction methods depends on the number of oscillations in the
V(z) curve. The period of the oscillations is given by the formula:
where A0 and BM are the wavelength in the water and the mode critical angle, respectively [5]. Mode velocity is calculated by:
and W O is the sound velocity in the water. The period of the oscillations increase with the mode velocity. Hence modes that exist around longitudinal critical angles give rise to small number of oscillations. This limitation causes measurement problems and degrades the accu- racy of velocity extraction. Interference pattern in the V(z) curve obtained from conventional lenses or Lamb wave lenses are due to the interference between the nonspecular reflection and the normally incident beam. One way t o increase the difference between the angles of
1051-0117/94/0000-1397 $4.00
0
1994
IEEE
the specular and the nonspecular reflected beams, and hence to increase the number of oscillations in V(z), is to employ another obliquely incident beam as the refer- ence specular component instead of the normal beam. The incidence angle of the specular beam is chosen to maintain an angular difference] with the incidence angle of leaky component, such that best accuracy in charac- terization is achieved.
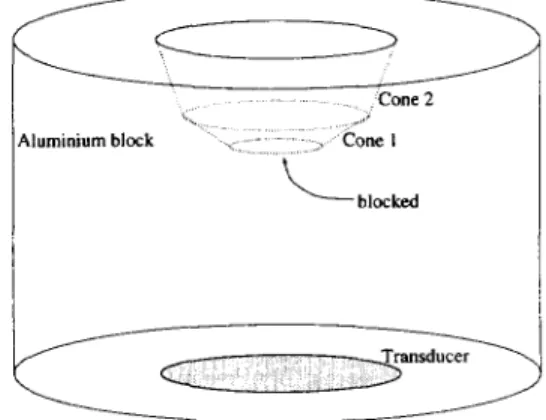
The proposed bi-angular lens contains two conical surfaces such that the vortex angle of the first surface
1s dictated by the incidence angle of the Lamb wave
mode, where as the vortex angle of the second mode is selected to provide a specular reflection a t an appro- priate incidence angle. The central part is blocked by an acoustically opaque material. In the following sec- lion, the geometry of the lens is describcd and design considerations are discussed. Then, the response of the lens as a function of defocus distance is investigated and compared with the Lamb wave lens. Theoretical simu- lations are done to deduce the performance of the lens. Experimental results are also presented and compared with the theory.
Cone 2
Uuminium block
Figure 1: Bi-angular Lens
Bi-angular Lens
Bi-angular lens is composed of two conical surfaces as depicted in Figure 1 . Sound waves are first refracted by the inclined surfaces before they reach to the object
surface. Central part of the recess is blocked. Hence, material surface is insonified by two obliquely incident beams. The inclination angle of the inner surface is set such that incidence angle of the refracted beam a t this conical surface matches with one of the mode critical angles. This beam generates a leaky Lamb wave mode on material surface. The incidence angle of the specu- lar beam is higher than the Rayleigh angle of the layer, hence the reflected field from the material surface con- tains only specular component. Interference pattern of the specular beam and the leaky field is observed as oscillations in V(z) curve. Water
I
1508.9I
€jj ... 1000.0'4r
... .i Copper Steel Figure 2: Bi-angular Lens GeometryIn Figure 2, the traces of the acoustic rays refracted at the conical surfaces are shown. If z is between fi and
f 2 , the leaky wave region, oscillations in
V(z)
curve isdue t o the interference of the leaky field and the spec- ular beam. Maximum signal amplitude is reached a t the mid-point of this region. Between f3 and f 4 , the
focus region, lens can collect only specularly reflected beam refracted at inner cone (Figure 4). Distance be- tween fi and f2 is maximized t o get more oscillations in V(z) curves and fi is placed near the aperture. To
obtain reference curve, materials whose critical angles does not match with the incidence angle of the inner cone can be used. In this case, although there is no leaky wave excitation, there exist small oscillations in leaky wave region due to the diffraction. To minimize diffraction? radius of the inner cone, Q , and the lens
aperture, ~ 3 , are chosen t o prevent interference of the
specularly reflected beams. In other words, f2 is placed before f3.
5010.0 2290.0 8933.0 I
5900.0 3200.0 7900.0
Bi-angular Lens
V.S.Lamb Wave Lens
Eli-angular lens is an extension to the Lamb wave lens
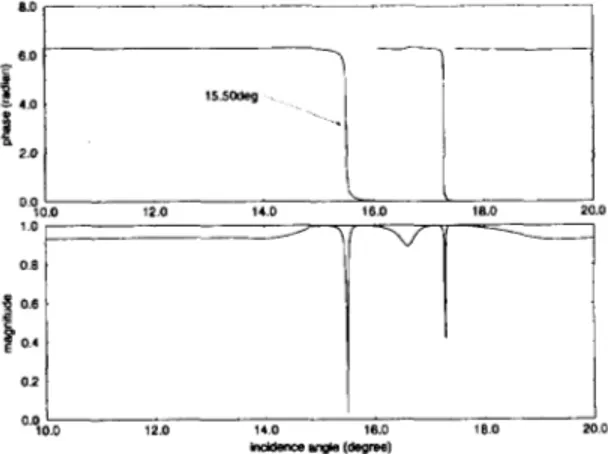
[6] and it is especially useful for material characteriza- tion by using high velocity modes. In Figure 3, cal- culated reflection coefficient for 600 micro-meter thick
copper layer on steel substrate is shown. There exists a leaky mode around the longitudinal critical angle of steel. Frequency is chosen as 24.6 MHz. The leaky Lamb wave mode is observed as a sharp phase transition
at 15.50a, and the corresponding mode velocity is 5646
meter/sec. This mode leaks both back t o the coupling medium and into the steel substrate. This phenomenon is observed as a dip in the reflection coefficient. Reflec- tion coefficient calculation is performed by employing boundary matrix method [7].
I
~ 120 14.0,,~
lS.O,,,,,
10.0 00 1 0 0 8 3 0.6 0.2 I 12.0 1 4 0 16.0 1 0 0 20 0 0.0 1 100-
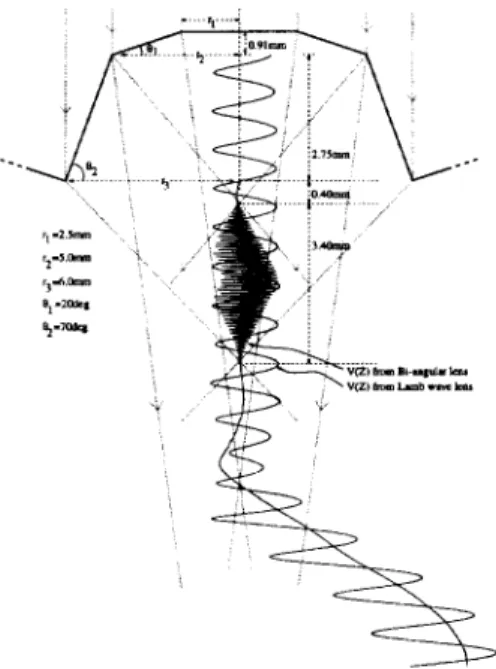
Wd0 (wm)Figure 3: Calculated reflection coefficient of 600 micro- meter thick copper layer on steel substrate at 24.6 MHz. In Figure 4, simulated V(z) curves obtained from Lamb wave lens and bi-angular lens are shown. The lens dimensions are provided in the figure. The wedge angle of the inner and the outer cones are chosen as 20.0" and 70.0', respectively. Corresponding incidence angles are 15.40' and 57.24'. For the beam refracted a t the inner cone, most of the power converted t o the leaky Lamb wave mode. In order t o obtain a V(z) from Lamb wave lens, the planar central part must be kept open. For bi-angular lens, on the other hand it must be blocked. In Figure 4, V(z) for both lenses are given. The amplitudes of the oscillations are nearly the same in leaky wave region, but the number of oscillations in- creases significantly, for the case of bi-angular lens. The period of the oscillations are calculated by using the for- mula:
(3) A0
q C o s e M - coser)
'
A Z
=where 01 is the incidence angle of the outer cone.
Figure 4: V(z) curves obtained by using Lamb wave lens and Bi-angular lens
Simulation program, that calculates V(z), is written by employing both angular spectrum methods and ray theory. The potential distribution at the transducer is propagated through the lens material by taking the Fourier transform of the field and adding phase terms. Due to the symmetry it is possible to use one dimen- sional Quasi Fast Hankel Transform to calculate two dimensional Fourier transform. After finding the po- tential distribution at the back of the recess, distribu- tion at the aperture is calculated by using ray theory. The distribution at the aperture is shown in Figure 5
for the bi-angular lens used in simulation. Ray theory analysis does not consider beam divergence due t o the diffraction. Hence, beam widths depicted in figure are less than actual beam widths.
lnddern -le (dwrae)
Figure 5 : Angular distribution a t the aperture of bi- angular lens
Experiments
In experiments, the lens whose dimensions are shown in Figure 4 is used. Center part is blocked by using polystyrene. The lens material is aluminum whose lon- gitudinal velocity is 6420 meter/sec. The alignment of the lens and the object is achieved by maximizing the transducer output voltage when z is between and f4 (Figure 2), since the maximum signal level is reached when the central part is parallel to the material sur- face.
The material under observation is 600 micro-meter thick copper layer on steel substrate. Copper is plated on steel electrochemically.
Z-scan is achieved by using a computer controlled motor with 0.1 pmeter accuracy and V ( z ) is taken at 1000 points over a defocus range of 4 mm.
-2u I I..
-9.0 -8.0 -7.0
-35 I ' ' ' ' .
-10.0 0
z lmm)
Figure 6: V(z) from bi-angular lens. Object is 600
micro-meter thick copper layer on steel substrate The experimental d a t a depicted in Figure 6 is fil-
tered by a band pass filter whose cut-off angles are at
5" and 50" in angular domain. Base-line variations of V(z) curve are due to the background pulses emerge from reflected shear echoes and high frequency compo- nents are due t o the imperfection of switches. These oscillations are eliminated by band pass filtering.
In Figure 7, V(z) curves obtained from Lamb wave lens, bi-angular lens and spherical lens are shown. The apertures of the spherical and the bi-angular lens are the same. The cone angle of the spherical lens is chosen as
17'. Hence, only the mode shown in Figure 3 is excited.
The period of the oscillations from Lamb wave lens and spherical lens are the same, whereas for the bi-angular lens it is small. The amplitudes of the oscillations for Lamb wave lens and the bi-angular lens are comparable and both are an order of magnitude higher than that of the spherical lens.
Conclusion
V(z) technique for characterization of materials with high velocity modes suffers from the fact that variation
5 Lamb wave lens 1-\
0 Spherical lens Bi-angular lens
-
-5
-45 I’ //
i
of V(z) with respect t o z is slow and hence the accuracy of velocity extraction process is degraded. Proposed lens geometry overcomes this difficulty. V( z ) obtained with bi-angular lens provides a large number of oscil- lations in leaky wave region. Its leaky wave excitation efficiency is the same as the Lamb wave lens. Hence, the modulation index in the V(z) curves maintains a high signal-to-noise ratio.
The accuracies of the spectral or model based ve- locity extraction algorithms depend on the number of oscillations in V(z) curves. V(Z)’S from Lamb wave and bi-angular lenses contain two peaks in angular do- main. These peaks correspond to the base line varia- tions which we called spectral peak, and oscillations due to the leaky waves known as leaky wave peak. In the case of Lamb wave lens, for high velocity modes, these peaks are close to each other and spectral peak affects the leaky wave peak, resulting in the mis-calculation of
the place of the maximum value of the leaky wave peak.
For bi-angular lens, since the frequency of oscillations is increased, in spectral domain these peaks stay apart from each other and baseline variations do not effect the leaky wave peak.
The measurement accuracy of the bi-angular lens de- pends on the match between the incidence angle and the leaky wave critical angle, as in the case of Lamb wave lens. In velocity measurements, the absolute accuracy of Lamb wave lens is 1% [4] as long as the critical angle stays within in the angular width of the incident beam. For bi-angular lens, by a proper windowing on V(z) curve, an absolute accuracy of 0.5% can be achieved.
The proposed geometry is not suitable for the anisotropy measurements, since it has not direction sen- sitivity. A version of V-groove lens [4] with the same cross section of the bi-angular lens shown in Figure 2 can be constructed for anisotropy measurements.
References
[l] Nayfeh, A. H., Chimenti, D. E., “Reflection of fi- nite acoustic beams from loaded and stiffened half- spaces”, J. Acous. Soc. Am., Vol. 75, pp. 1360- 1368, 1984.
[2] Chimenti,
D.
E., Nayfeh, A. H., “Leaky Lamb waves in fibrous composite laminates”,J. .4ppl. Phys., Vol. 58, pp. 4531-4538.[3] Chimenti, D. E., Nayfeh, D. L., Butler, D. L.,
“Leaky Rayleigh waves on a layered halfspace”, J . Appl. Phys., Vol. 53, pp. 170-176, 1982.
(4) Bozkurt, A., Yarahoglu, G. G., Atalar, A., Koymen, H., “A new directional acoustic lens: V-groove lens”, in IEEE Ultrasonic Proceedings, 1993.
[5] Briggs, A., Acoustic Microscopy, Oxford, 1992. [6] Atalar, A., Koymen, H., Degertekin,
F.,
L., “Alamb wave lens for Acoustic Microscopy”, IEEE
Trans. UFFC, Vol. 39, No. 6 , pp. 661-667, 1992. [7] Kundu, T., Mal, A.K., Weglein, R. D., “Calcula-
tion of the acoustic material signature of a layered solid”, J. Acous. Soc. Am., type I1 reflection mi- croscope”, IEEE Trans. UFFC, Vol. 34, No.3, pp. 341-345, 1987.
[8] Atalar, A., Koymen, H., “A high efficiency Lamb wave lens for subsurface imaging”,Proc. IEEE 1989
Ultrasonics Symposium, pp. 813-816, 1989. [9] Atalar, A., ‘A backscattering formula for acoustic
transducers’, J. Appl. Phys., Vo1.51, pp.3093-3098, 1980.
[lo]
Auld, B. A., Acoustic Fields and Waves in Solids,John Wiley & Sons, 1973.
[ l l ] Kino, G.