^ ///■ .! J / ' τ κ ^
7882
.
S é SCOfwIPö
Ί i )v<, ·*'?* ;·. '··» 1 :И .:* Пxi 1, f \ Ş Ч V ’' Г \ T ‘Ί Г Μ ^ '“ϊ ' ''i / -:l / ; ! a ¿■' •■i !j j 'O· ? >1 / * - 1Л ;·; ^ Л £2?;·' :i Vi ч,л. J 4 ^y jí 'j \ J Í M U : i j o , o · lí . ■. i·.í' Ш SÜEMIT'."ED TO ϊ i" Λ * ' ■■ ’. .;' г ■·'* \'<J ; Z 'w .^· J Υ< 7./’ГГ> "tWCvvV 21-í if ..l P'COMPUTATIONALLY EFFICIENT VOICE
DIALING SYSTEM
A THESIS
SUBMITTED TO THE DEPARTMENT OF ELECTRICAL AND ELECTRONICS ENGINEERING
AND THE INSTITUTE OF ENGINEERING AND SCIENCES
OF BILKENT UNIVERSITY
IN PARTIAL FULFILMENT OF THE REQUIREMENTS
FOR THE DEGREE OF
MASTER OF SCIENCE
By
Mustafa Hakan Solmaz September 1998___
ѣ
T к
• S 6 5 ' S é s 1Э3 8 .
I certify that I have read this thesis and that in my opinion it is fully adequate, in scope and in quality, as a thesis for the degree of Master of Science.
/1 / /
Prof. Dr. Enis Çetin (Supervisor)
I certify that I have read this thesis and that in my opinion it is fully adequate, in scope and in quality, as a thesis for the degree of Master of Science.
fvi-L X l/lv. i<
Prof Dr. Miibeccel Demirekler
I certify that I have read this thesis and that in my opinion it is fully adequate, in scope and in quality, as a thesis for the degree of Master of Science.
Assist.Prof Dr. Orhan Arikan
Approved for the Institute of Engineering and Sciences:
Prof Dr. Mehmet onray
Director of Institute of Engineering and Sciences
ABSTRACT
COMPUTATIONALLY EFFICIENT VOICE
DIALING SYSTEM
Mustafa Hakan Solmaz
M.S. in Electrical and Electronics Engineering
Supervisor: Prof. Dr. Enis Çetin
September 1998
Subband based feature parameters are becoming widely used for speech recognition purposes. In this thesis a subband-based, small-vocabulary, speaker-dependent, isolated-word recognition system is proposed. The most distinctive property of the proposed system is its low computational cost which enables it to run at real-time on a simple microcontroller. The system is used as the core of a voice dialer which is designed to work together with Karel switchboxes. In training section first, an energy-based endpoint (startingpoint) detection method is applied for speech detection. Then feature extraction is applied on a fixed length, pcm-quantized (a-law) speech long enough to cover a single word. In recognition section template matching is used to find the most likely vocabulary element. A recognition rate of 93% is obtained in the simulations.
Keywords: Subband decomposition, endpoint detection, template matching, speech quantization.
*This project is developed in coorperation with Karel E lectronics Inc.
ÖZET
İŞLEMSEL OLARAK VERİMLİ SESLE TELEFON
ÇEVİRME SİSTEMİ
Mustafa Hakan Solmaz
Elektrik ve Elektronik Mühendisliği Bölümü Yüksek Lisans Tez Yöneticis: Prof. Dr. A.Enis Çetin
Eylül 1998
Altband öznitelik parametreleri son zamanlarda ses tanıma uygulamalarında sıkça kullanılmaya başlandı. Bu çalışmada altband öznitelik parametrelerini kullanan, kullanıcıya bağımlı, küçük sözcük dağarcıklı, ayrık sözcüklü bir ses tanıma sistemi önerilmektedir. Önerilen sistemin ayırt edici özelliği basit bir mikrokontroler üzerinde gerçek zamanda çalışmasına imkan tanıyacak kadar düşük işlem karmaşasına sahip olmasıdır. Sistem, Karel santralleriyle birlikte çalışacak bir sesle telefon çevirme cihazının özü olarak kullanılmaktadır. Eğitme kısmında önce enerji tabanlı bir ses başlangıç saptaması yapılmaktadır. Daha sonra sabit uzunlukta ve sabit sayılı PCM (a-law) olarak nicemlendirilmiş ses sinyali üzerinde öznitelik çıkartma işlemi yapılmaktadır. Tanıma kısmında şablon karşılaştırma tekniği kullanılarak en yakın sözlük kelimesi seçilmektedir. Denemelerde %93 oranında doğru tanıma yüzdesi elde edilmiştir.
Anahtar Kelimeler: Altband ayrıştırması, sesbaşlangıcı saptaması, şablon karşılaştırması, ses nicenılemesi.
*Bu çalışm a, Karel Elektronik A .Ş. ile işbirliği içinde \ apılmıştır.
Acknowledgements
I would like to use this opportunity to express my deep gratitute to my supervisor Prof. Enis Çetin and to my project manager Sinan Ikeda for their guidance, suggestions and encouragement throughout the development of the thesis.
I would like to thank Assist. Prof. Orhan Arikan and Prof. Mübeccel Demirekler for reading and commenting on the thesis.
I would like to thank Volkan Şahin and Enis Ungan at Karel for their support in the development of the hardware of the project. I feel very fortunate to meet them.
It is a pleasure for me to express my special thanks to my father, to my mother, to my uncle Nazif Solmaz and to his dear wife Ayşe Solmaz for their continuous support, encouragement and sincere love.
To my family.
Contents
Contents... vii
List of Figures...viii
List of Tables... x
1 .Introduction...1
2.Speech Recognition using PCM-data...5
2.1 Speech Quantization... 5
2.2 Endpoint Detection Method... 10
2.3 Subband Feature Parameters on PCM-data... 18
3.Simulations and Real-time System Description...27
3.1 Simulations... 27
3.2 Real-time System Description... 31
4.Conclusion... 36
Bibliography... 39
Appendix A Interactive Simulation Program Menus...42
List of Figures
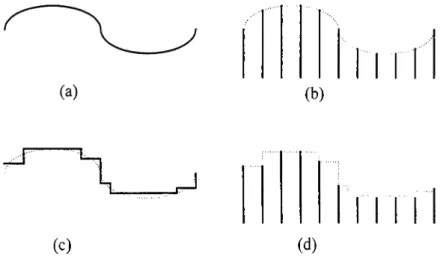
Figure 1: Four types of signals, (a) continuous time, continuous amplitude (b) discrete time, continuous amplitude (c) continuous time discrete amplitude (d)
discrete time, discrete amplitude... 6
Figure 2: Amplitude quantization... 6
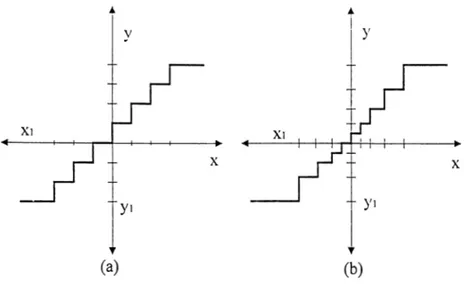
Figure 3: quantization schemes,(a) uniform quantization (b) nonuniform quantization ...8
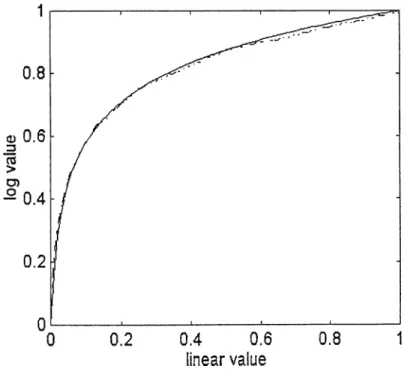
Figure 4: Logarithmic quantization methods. Dashed line: Mu-law companding. Solid line: A-law companding...9
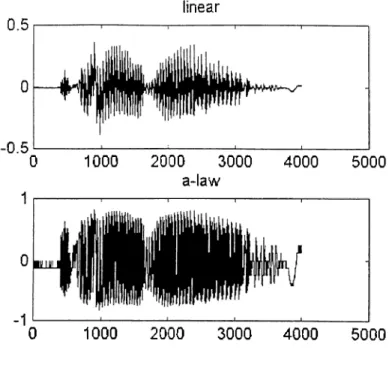
Figure 5: Sample of linear and a-law quantized speech... 11
Figure 6 :Spectrums of linearly and logarithmicaly quantized versions of a same utterance... 11
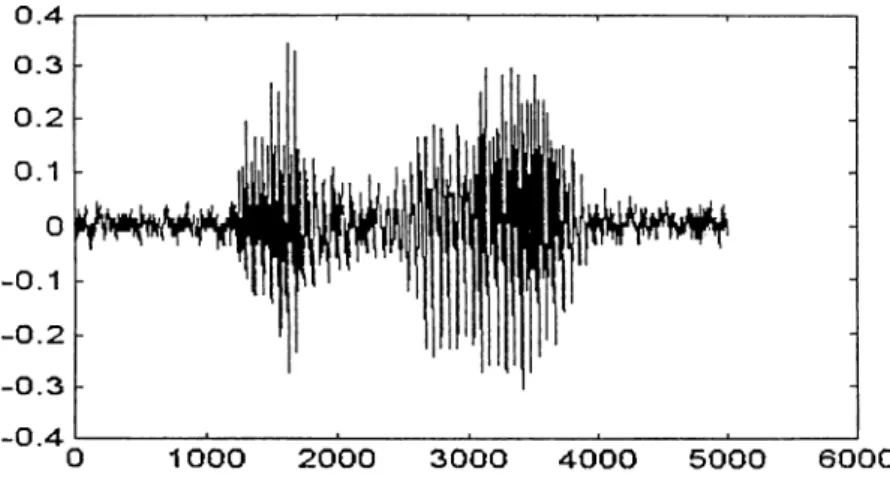
Figure 7: Waveform of the utterance 'ahmet'... 12
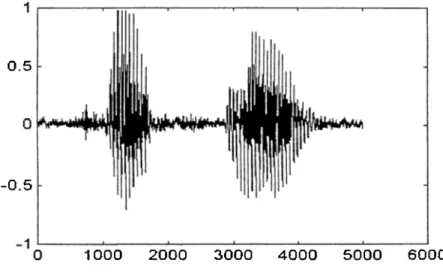
Figure 8: Waveform of the utterance ‘fatma’... 13
Figure 9: Typical example of energy and zero-crossing measurements for a word with a fricative at the beginning: ‘fatnia’...14
Figure 10: Energy comparison method which is used in this thesis for endpoint detection...16
Figure 11: Flowchart of enpoint detection algorithm used in this thesis... 17
Figure 12: Block diagram of obtaining real cepstrum... 19
Figure 13: Mel-scale filters for computing mel-cepstrum...20
Figure 14: Block diagram of obtaining mel-cepstral parameters... 20
Figure 15: Basic block of filterbank structure... 21
Figure 16: Illustration of frequency band inversion...22
Figure 17: Frequency decomposition of speech similar to mel-scale... 23
Figure 18: Filterbank structure for 21 subband decomposition... 25
Figure 19: Subband decomposition scheme in simplified system... 25
Figure 20: Frequency response of filters. Dashed line:?'*’ order filter, solid line: order filter response...26
Figure 21: Main window of interactive simulation program... 31
Figure 22: General description of real-time recognition system... 32
Figure 23: Picture of the whole system.The encircled section is the recognition hardware... 34
Figure 24: A general picture of the development environment... 35
Figure 25:Framesize and number of frames tab...42
Figure 26:Filterbank decomposition scheme selection...43
Figure 27:Endpoint detection threshold adjustment...44
List of Tables
Table 1 :Two sample vocabularies used in the simulations...28 Table 2: Simulation results for different configurations... 29 Table 3: Comparison of Erzin [12] and this project... 38
Chapter 1
Introduction
Speech is the best means of communication between human beings. Fundamentally speech processing relies on basic research in the speech and hearing sciences, some of which is centuries old.
In order for communication to take place, a speaker must produce a speech signal in the form of a sound pressure wave that travels from the speaker's mouth to the listener's ear. Speech signals are composed of a sequence of sounds that serve as a symbolic representation for a thought that the speaker wishes to relay to the listener [1]. The arrangement of these sounds is governed by rules associated with a language. The scientific study of language and these rules is referred to as linguistics. The science that studies the characteristics of human speech production is called phonetics. The field of speech processing develops algorithms for human-machine interaction and tries to incorporate linguistic and phonetical rules to realize speech recognition and sythesis systems.
In this thesis we describe a speech recognition system which is implemented using a PIC microprocessor for voice dialing applications.
The goal of speech recognition technology is to develop machines that can receive spoken information and act appropriately upon that information. Anyone who has watched science fiction movies knows that human capacity for imagining such systems is unbounded: Talking cars, robots, voice-controlled space ships, etc.
The recognition systems in real life has not reached to the level of fiction yet, but there are reliable recognition systems under limited dimensions [6].
One of the dimensions that influence the success or failure of a speech recognition system is the degree of speaker dependence[l]. A speaker dependent recognizer uses the utterances of a single speaker to learn the parameters of the speech process. The system is than used specifically for recognizing the speech of its trainer. Accordingly, the recognizer will yield relatively high results compared with a speaker-independent recognizer, which is trained by multiple speakers and used to recognize many speakers (who maybe outside of the training population). The apparent disadvantage of a speaker-dependent system is the need to retrain the system each time it is to be used with a new speaker. Beyond the accuracy/ convenience trade-off is the issue of necessity. A telephone system [9] that must respond to inquiries from the public is necessarily speaker-independent while a system used to recognize the severely dysarthric speech of a person must be trained to that person's speech [8].
Another dimension of complexity is the size of vocabulary. Speech recognition systems are classified as small, medium or large vocabulary. Small vocabulary systems are those which have vocabulary sizes in the range 1-99 words, medium 100-999 words; and large 1000 words or more. Clearly, the performance and speed of a particular recognizer degrades with increasing vocabulary size.
The most complex recognition systems are those which perform continuous-speech recognition, in which the user utters the message in a relatively unconstrained maimer.
Taking all these facts into consideration, people developed speech recognizers perfonning under certain conditions. The complexity of recognizers vary according to the requirements that they have to satisfy.
In this thesis a small vocabulary, speaker-dependent, isolated word recognition system is desribed. The most distinctive property of the algorithm is its low computational cost which enables it to run at real-time on a simple microcontroller. The project is developed in coorperation with an electronic company, Karel Electronics Inc. The system is used as the core of a voice dialer. The voice dialer is designed to work together with Karel switchboxes. The internal subscribers will train the system with their voices. In the recognition section, the system will recognize the word and will dial the number corresponding to that word.
In Chapter 2 the theoretical aspects of the recognizer is introduced. These are speech quantization, endpoint detection and feature extraction. Speech quantization is detailed in Section 2.1. The endpoint detection approach used in this thesis is described in Section 2.2. In Section 2.3 the features, subband feature parameters, are introduced and inspected. Another distinctive property of this algorithm is that feature extraction is done on PCM quantized speech. The reason for using PCM speech is that the speech digitizing chips, codecs, produce directly PCM speech. If linear speech is used, one should perform PCM to linear conversion. The performance of the algorithm on PCM speech is compared to the performance on linear speech.
In Chapter 3 the real-time, computationaly efficient, speaker-dependent speech recognition system is described. Both the hardware and software of the system is
explained to the extend without jeopardizing the commercial interests of Karel Electronics Inc.
Chapter 2
Speech Recognition using
PCM-data
In this Chapter, a coniputationaly efficient method for isolated word recognition is introduced. First, the endpoints of the words are detected. Then the feature parameters are obtained. Subband energies are used as feature parameters which are obtained by applying wavelet analysis on PCM-quantized speech. It is observed that PCM-quantized feature parameters perform as good as linearly quantized feature parameters. The feature extraction method has a number of tuning parameters that can be used to control the efficiency of the method as well as the accuracy. The nature of these parameters are also discussed in this chapter.
2,1 Speech Quantization
Information bearing signals are typically continuous-amplitude and continuous-time in nature. Hence analog-to-digital conversion is needed to produce a discrete representation of the signal. By sampling, a discrete signal is obtained but the amplitudes of these samples are still continuous. The process of amplitude
quantization is needed to limit the number of possible amplitudes to a finite value, as shown in Figure 1. The operation of sampling and quantization can be performed in either order, but in practice, sampling preceedes quantization. Amplitude quantization is a crucial step in digital communication, as it determines to a great extent the overall distortion as well as the bit rate necessary to communicate [3].
(b)
(c) (d)
Figure 1; Four types o f signals, (a) continuous time, continuous amplitude (b) discrete time, continuous amplitude (c) continuous time discrete amplitude (d) discrete time, discrete amplitude
Amplitude quantization is the procedure of transforming a given signal amplitude x(n) to an amplitude which is taken from a finite set of possible amplitudes. The quantizer output is y ,., if the input signal x(n) is between the threshold and x^,., which form the quantization interval 5^, as shown in Figure 2.
5^ :{x^ <x<x*,^i},A: = l,2,...,T
Sk
Xk-i Xk yt Xk+1 Xk+2
If there are L=2^ quantization levels then a bit rate of
R = log, L bits/sample
is needed to represent the analog amplitude x in digital form.
When the analog amplitude is to be reconstructed; the index k is transformed into an amplitude y ,^; that represents all amplitudes in the range The amplitudes ’s are called representation levels, or reconstruction values. Thus we have an output
y = y ^ i i x e S ,
which is also represented г.sy=0(x).
There are several types of quantization methods. Quantizer design has been an important research topic [13,14]. The simplest types of quantizers are unifomi quantizers. One uniform and one nonuniform quantizer characteristics are shown in Figure 3.
There is an unavoidable error in the quantization procedure between the input x and output _y. This error is called quantization error, and can be defined as:
q = x - y = x - Q(x)
It is important to realize that quantization error is totally deterministic when the input signal is deterministic. But when the input is an outcome of a random variable, than the quantization en'or is also a random variable. For this reason the term quantization noise is used to describe the errors introduced by quantization.
Figure 3: quantization schemes,(a) uniform quantization (b) nonuniform quantization
For uniform quantization of a bounded input, with step size A , the quantization error variance is A^/12 [11]. Notice that the quantiztion error can be reduced by decreasing the step size which means increasing the number of bits required to represent a sample.
For variance optimized quantizers, the SNR value is at its maximum for one specific variance. In situations such as speech, the exact value of the input variance is not known in advance. In such situations an SNR ratio that is constant over a broad range of input variances can be obtained by logarithmic quantization [11].
Speech signals have the characteristic that small-signal amplitudes occur more frequently than large-signal amplitudes. Furthermore human hearing system exhibits a logaritmic sensitivity to amplitude and frequency. For a logarithmic quantizer with L levels, the resulting quantization error is smaller then L-level uniform quantizer for speech signals [1].
A logaritlmiic quantizer employed in North American telecommunication systems is called ¡j. - Jaw and has the following relationship:
log(l + /i IX I) log(l + ju )
the value ¡j. = 255 has been accepted as a standard in the United States and Canada. [10]. This method results in about 24 dB reduction in the quantization noise power relative to uniform quantization .
The logarithmic compressor used in European telecommunication systems is called A-law and is defined as:
I l_ l + log^|x 1 + log^
where A is chosen as 87.56. Although the relationship seems different their compression characteristics are very similar as shown in Figure 4.
Figure 4: Logarithmic quantization methods, Dashed line: Mu-law companding, Solid line: A-law companding
A sample utterance of word "karel" is shown in Figure 5. Notice that in logarithmic companding low amplitude signal values are emphasized.
As far as we know in most of the speech recognition applications , feature extraction is carried on uniform quantized speech. Today there are chips which produce directly logarithmic companded signals such as TP3057 from National Semiconductors. One must convert these signals to linear data before feature extraction. Although there are piecewise linear approximations of these coders, they increase the computational burden of the resulting scheme. In this thesis, all of the analysis is done on A-law companded speech, without converting it to linear speech. It is observed that the performance do not degrade for speaker-dependent case.
It is observed that high frequency components in the spectrum of a-law quantized signal are deemphasized. In Figure 6 the linear and logaritmic spectrums of a sample utterance are seen. From this figure it is seen that one should divide the low'er frequencies into more subbands. For linearly quantized speech it is already known that lower frequencies includes more information. Figure 6 verifies that this is also the case for logaritmically quantized speech.
2.2 Endpoint Detection Method
The problem of locating the beginning and end of a speech utterance in a natural environment is of importance in many areas of speech processing. In particular, in automatic recognition of isolated words, it is essential to locate regions of a speech signal that correspond to each word.
linear
0 1000 2000 3000 4000 5000
a-law
0 1000 2000 3000 4000 5000
Figure 5: linear and a-law quantized speech
spectrum of linear speech
Figure 6 :Spectrums o f linearly and logarithmicaly quantized versions o f a same utterance.
The problem of discriminating speech from background noise is not trivial, except in the case of extremely high signal-to-noise ratio acoustic environments. For such high signal-to-noise ratio environments, the energy of the lowest speech sounds (e.g., weak fricatives) exceeds the background noise energy, and thus a simple energy measurement suffices. However, such ideal recording conditions are not practical for most applications.
1000 2000 3000 4000 5000 6000
Figure 7: Waveform o f the utterance 'ahmet'
It is easy to locate the beginning of an utterance for words like ‘ahmet’, (Figure 7). In this case a radical change in the wavefonn energy between the background noise and the speech is an important cue to the beginning of utterance. But an example of a case in which it is diffucult to locate the beginning of the speech signal is given Figure 8. This figure shows the waveform for the utterance ‘fatma’. Since the word begins with the weak fricative HI it is very difficult to precisely identify the beginning point. In general it is difficult to locate the beginning and end points of an utterance if there are :
1. weak fricative (/f/, /tli/, /li/) at the begimiing or end.
2. weak plossive bursts (/p/, III, /k/) at the beginning or end,
3. nassals at the end,
4. voiced fricatives which become devoiced at the end of words, and
5. trailing of wovel sounds at the end of an utterance [2].
0.5
-0.5
1000 2000 3000 4000 5000 6000
Figure 8: Waveform o f the utterance ‘fatma’.
The traditional approach used for endpoint detection is based on two simple time- domain measurements, the energy and the zero-crossing rate.
In spite of the difficulties, energy and zero-crossing measures are combined to serve as the basis of a useful algorithm. One such algorithm was studied by [7] in the context of an isolated word recognition system [24]. In this system a speaker utters a word during a prescribed interval, and the whole inter\'al is sampled and stored for processing. The purpose of the algoritlmi is to find the beginning and end of the w'ord.
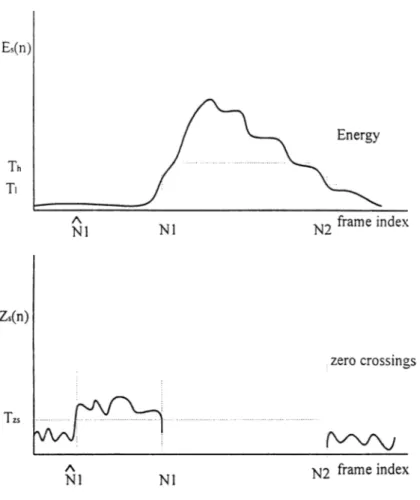
Figure 9: Typical example o f energy and zero-crossing measurements for a word with a fricative at the beginning: ‘fatma’.
The algorithm can be described by reference to Figure 9. The average magnitude and zero-crossing rates are measured with a 10 msec window. Both functions are computed for the whole interval at a rate of 100 times/sec. It is assumed that the first 100 msec of the interval contains no speech. The mean and standart deviation of the average magnitude and zero-crossing rate are computed for this interval to obtain a statistical characterization of the background noise. These statistics are used to compute the zero-crossing and energy thresholds. The energy profile is searched for an inter\'al in which it always exceeds the higher threshold, Th. Then working backwards, the point which first exceeds the lower tlireshold, Tl, is selected as speech beginning, (labelled as N1 in Figure 9). The endpoint is also detected in the
same way. At this stage, it is reasonably safe to assume that speech signal is between N1 and N2.
The next step is to move backward from N1 (forward from N2) in the zero-crossing rate plot. If the zero-crossing rate exceeds the zero-crossing threshold in this interval, the beginning point is moved back to N \ . Otherwise N1 is chosen as the speech beginning. A similar procedure is applied at the end. This approach is good for locating the fricatives at the beginning and end of a word.
In this thesis, a similar approach is applied for endpoint detection, by ‘endpoint’ we imply ‘starting point’ in this thesis. But there are some limitations due to real-time implementation. Moving back in time requires a memory buffer which is not available in this project. Using two thresholds is not possible due to the same reason. The important point is that the endpoint detection algorithm should be consistent both in training and recognition. In other words, if it misses a fricative in both training and recognition this may not cause any degradation in the recognition performance.
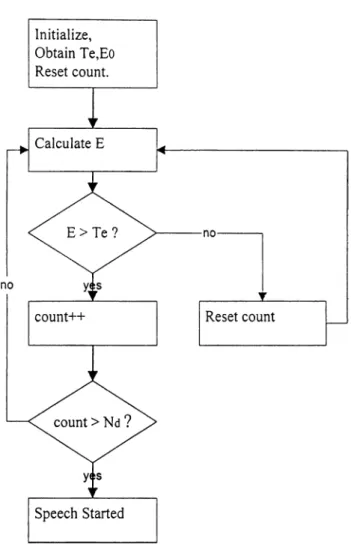
The endpoint detection algoritlim in this thesis may be described with reference to Figure 10. 100 msec of silence assumption is also valid for this method. In this period the energy of the environment is measured as follows:
£ . = - E u(oi
n to
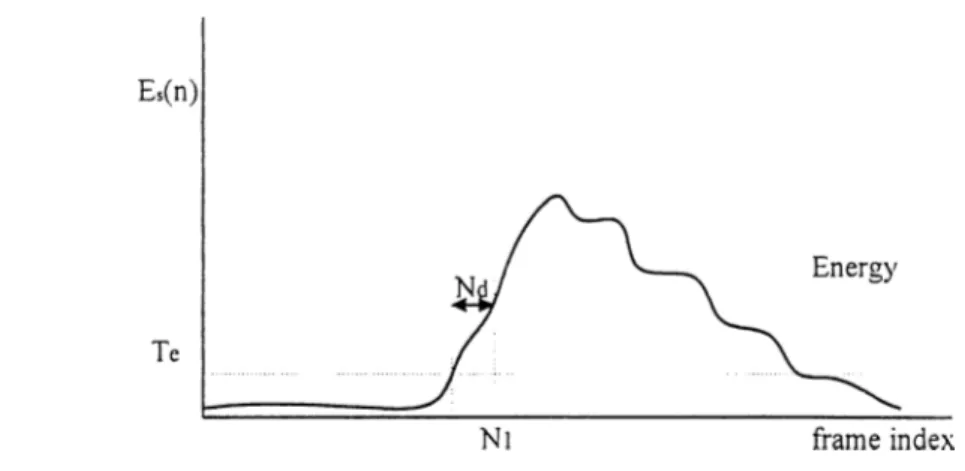
Figure 10: Energy comparison method which is used in this thesis for endpoint detection.
Here s is the speech signal, n is the number of samples in the silence period. For 8 kHz sampling rate, 100 msec speech signal includes 800 samples. The threshold Te is obtained by using Eo. After this initialization the average energy, E, of each new frame is obtained as:
1
E = - S l î ( i ) l in ^
Here m is the number of samples in each frame. If the average energy stays over the threshold, Te, for a predefined time, it is decided that speech has started. Illustration of the algoritlim is shown in Figure 10. A flowchart for the real-time implementation of this method is seen in Figure 12.
From Figure 10, it is evident that the algorithm misses the fricatives in the beginning of a word. For example, the word ‘hüsnü’ is analyzed as ‘üsnü’ in this algorithm. In the simulations it appears that loosing the first consonant of a word does not result into performance degradation, because both the training and recognition tokens loses their first letters.
The overall system makes sure that the utterances "hüsnü" and "üsnü" can not be in the vocabulary at the same time. In this way, missing a fricative in the beginning of a word does not cause a problem.
Figure 12: Flowchart o f enpoint detection algorithm used in this thesis.
There are two parameters affecting the performance of enpoint detection: One is the tlireshold value,Te, the other is the decision delay, Nd. These parameters are shown in Figure 10. For small values of both of these parameters, the accuracy of enpoint detection is very high. All enpoints are detected successfully, however there are some false detections which is not desired at all. For example, if the delay value is kept small, impulsive noises are recognized as starting points of the speech utterance.
On the other hand, if the parameters are kept large, speech detection is done with a delay. Therefore, there is a trade-off here, and the parameters are experimentally determined as Te= 3.2 and Nd -4 frames. For w'ords starting with fricatives, it is observed that endpoint detection may miss the first letters of the words.
2.3 Subband Feature Parameters on
PCM-data
Many feature parameter sets including linear predictive coding parameters, line spectral frequencies and cepstral parameters are used for speech recognition in the past [25, 26, 27]. Mel-cepstral parameters are the most frequently used parameter in speech recognition applications. This is due to the fact that mel-cepstral parameters are most compatible with the human auditory system. Subband based cepstral parameters were introduced in [12]. In this thesis a modified version of these parameters are used as the feature parameters for speech recognition.
In [12] subband based cepstral parameters (SUBCEPS) were introduced. They appear to be more robust than mel-cepstral parameters, especially under noisy conditions . In this thesis, subband based feature parameters are used to reduce the complexity. For these parameters, the performance of the system is in the order of 92% for speaker-dependent case.
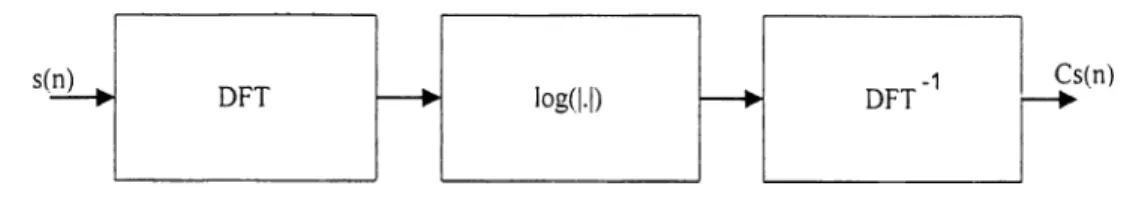
The real cepstrum of a speech sequence s(n) is defined as
c,(«) = F-' {log|F{j(,i)}|l= ^ |log|S(i..)^"Viv
log|S(\v)|
Figure 14: Block diagram o f obtaining real cepstrum
The block diagram of this computation is shown in Figure 14.
Mel-cepstral parameters are obtained by weighting the log energies with critical band filters. These filters are arranged linearly below 1 kHz, and then increasing logarithmically above 1 kHz as shown in Figure 15. This distribution is called the mel-scale. The block diagram of this computation is shown in Figure 16. Notice that one more box is added after log energies. Although practical computations are slightly different, the mel-cepstral approach operates on frequency domain and computational cost of this task is very high.[l]
The Fourier analysis provides information about the frequency content of the signal but it does not give any temporal information. To obtain temporal information, Fourier analysis is done on overlapping windows. On the other hand wavelet analysis is very suitable for the extraction of frequency information together with temporal knowledge of the signal [12]. Wavelet analysis associated with a subband decomposition teclinique was proposed and widely discussed in the literature [16- 22].
Figure 15: Mel-scale filters for computing mel-cepstrum
log|S(w)|
Figure 16: Block diagram o f obtaining mel-cepstral parameters.
The basic building block of a wavelet transform is realized by a subband decomposition filter bank as shown in Figure 17. The filter bank structure consists of a high-pass and a low-pass filter both of which are followed by a decimator which picks one sample and drops the other. In this way, two subsignals containing low and high components of the original signal are obtained. The filterbank structure provides a frequency decomposition of (0-tx/2) and (7t/2-7i). Each of the subsignals can be
further decomposed into other subsignals until a desired frequency decomposition is obtained.
sh(n)
sl(n)
Figure 17: Basic block o f filterbank structure.
There is one point which is to be mentioned here: The process of high-pass filtering followed by decimation inverts the frequency spectrum [16]. To compansate the effect of this inversion, the low-pass and high-pass filters following a high-pass filter are switched as shown in Figure 18. For example the subsignal has the
frequency content 7)7r
T ' ^ of the original speech signal.
These subsignals constitute the wave-packet representation which uniqely characterizes the original signal [17]. The original signal can be reconstructed with a proper choice of the low-pass and high-pass filters [17,18].
shh(n)
shl(n)
slh(n)
sll(n)
Figure 18: Illustration o f frequency band inversion
One of the possible choice is using a filter bank corresponding to a biorthogonal wavelet transform [19]. In this thesis we use the following low-pass //(,(2) and high-pass filter (z) pairs:
and
//,(z) = -z -'+ i5 (z ')(l + z4j=)).
One type of filters satisfying the above relations is the maximally flat Lagrange filter [18,19]. A 7'’’ order Lagrange filter has the transfer function:
1_ j2 Note that this can be put into the above form by choosing:
A{z-) = ^i ^ + z - - ) - ^ ( z - + z - ' ) and 5 (z') = ^(l + z '')
The speech signal is decomposed into L=21 subband signals as shown in Figure 19. The tree structure for this decomposition is shown in Figure 20. This decomposition approximates the logarithmic mel-scale.
21 subbands
I . L I . I I I__ L
IkHz 2kHz 4kHz
Figure 19: Frequency decomposition o f speech similar to mel-scale.
After obtaining the subsignals a feature parameter e, is defined over a time window of seconds:
1 w,
e, = — X |i,(« )| for /=7,2,i... L i ;i=l
th
where N,^ is the number of samples in the / band. The window size is chosen as 300 samples which is 37.5 msec at a sampling rate of 8 kHz.
The subband feature parameters are obtained in a computationally efficient manner. There are two reasons for this: The biorthogonal filter structure can be implemented using integer arithmetic because all of the filter coefficients are rational numbers. Another reason is due to the downsampling operation after every filter.
Upto this point the filter coefficients and subband decomposition scheme are the same as [12] which is used for a speaker independent speech recognition system at noisy environments. A cepstral analysis is also performed on the e, values and the cepstral parameters are used in the recognition process.
In this thesis a speaker-dependent, small vocabulaiy', discrete utterance speech recognition system is designed. Since the demand of the recognition system is simpler than the demand of the above project [12], it is reasonable to decrease the complexity of the speech recognition system.
In order to reduce the computational c o st, in this thesis, cepstral coefficients are not used during speech recognition. The feature parameters are directly used after a normalization to compansate the amplitude t'ariations between different utterances of the tokens.
We also simplified the recognition model of the system. Instead of using an HMM model, template matching of training tokens and recognition tokens is used. In this method feature parameters, e, 's, are extracted on fixed number of frames after speech detection. This period is adjusted to cover the utterance of a medium-sized, single word. If the uttered word is a long one, the section which falls out of analysis window is tlmown away.
In order to further simplify the sysytem, instead of dividing the spectrum into 21 subbands, 11 subbands are used. The 11 band decomposition scheme is shown in Figure 21.
s21 s20 s4 s3 s2 si
Figure 20: Filterbank structure for 21 subband decomposition
11 subbands
IkHz 2kHz 4kHz
Figure 21: Subband decomposition scheme in simplified system.
Another idea is to use a simpler filter pair. Instead of using the 7^*’ order Lagrange filter described above, the third order Lagrange filter is used for feature extraction. The dashed line in Figure 22 shows the T'*’ order Lagrange filter while the other line corresponds to the frequency characteristic of the 3^^* order Lagrange filter that is used in this thesis. The low-pass and high-pass filter pairs are:
and
The frequency responses of the filters are shown in Figure 22.
Figure 22: Frequency response o f filters. Dashed line:?'*' order filter, solid line: 3'‘* order filter response
Chapter 3
Simulations and Real-time
System Description
As it is described in Chapter 1, this project is developed in coorperation with Karel Electronics Inc. The specifications of the project is defined as:
• The recognition rate must be reliable enough to be used in practice.
• Computational cost must be low enough to be implemented on a microcontroller at real-time.
There are some implementation parameters which affect the perfonnance as ^^'ell as the cost of the algoritlim. In this chapter, first the effects of these parameters on the performance of the algoritlun are investigated then the real-time system is described.
3.1 Simulations
The voice dialing system is supposed to have a capacity of around 10 words. The user will make fast calls to the places he or she had trained before. In the simulations
15-word, 10-word and 6-word vocabularies are formed. Then both male and female speakers uttered each word 3 times. First tokens are used for training. The other two tokens are used for testing. In this way more than 500 test cases are formed. Two of the test vocabularies used in the simulations are shown in Table 1. 10-word and 6- word vocabularies are subsets of these vocabularies.
Vocabulary 1 Vocabulary 2
Aksu Limon Ahmet Hasan
Bergama Manisa Ali İnsan
Dalyan Marmaris Ayşe Karel
Didim Nane Bilkent Murat
Fener Onur Cafer Odtü
Kandil Silifke Celal Ömer
Kekik Tarçın Fatma Özgür
Kemer Hakan
Table 1 :Two sample vocabularies used in the simulations.
The important parameters of the voice dialing system are framesize, number of frames, subband decomposition scheme, endpoint detection tliresholds and filter characteristic.
Framesize and number of frames used in the analysis define the analysis window length. Since the algorithm works with isolated words, an analysis window length of 500 msec is used. This time segment is enough to utter a medium sized single word. Framesizes of 100, 200,300 and 400 samples are tried. For each of these values number of frames is adjusted to cover a 500 msecs speech.
Different subband decomposition trees are used. The spectrum divided into 7.11. 13. 17 and 21 subbands are tried in the simulations.
There is one thing to be mentioned here: When the framesize is small e.g., 100 samples, high levels of subband decomposition results into distorted subband energies. This is due to the decimation block in the filterbank scheme. The subsignals at the lower branches had a few samples, 6 or 3 samples. In this case estimated feature values are not reliable.
Simulation results for different vocabulary sizes and quantization types are shown in Table 2. From the table it is seen that a-law quantization slightly reduces the performance. There is not much difference between 15-word and 10-word vocabularies, but in 6-word vocabulary 1.5% enhancement is obser\'ed.
Vocabulary Size Quantization Method Recognition Rate %
15 words Linear quantization 92.48
15 words A-law quantization 91.31
10 words Linear quantization 92.52
10 words A-law quantization 91.35
6 words Linear quantization 94.12
6 words A-law quantization 92.81
Table 2: Simulation results for different configurations
From the simulations it is observed that if the endpoint detection of a word is successfully done in both training and recognition phases, that word is recognized correctly. The results in Table 2 also verify this observation. The wrong decisions in
these simulations correspond to words whose endpoint detections are not exact. Although the vocabulary size is reduced, the wrong decisions do not reduce that much.
At the end of simulations it is also observed that the performance of the algoritlim remained in a fixed range when framesize or subband scheme is changed.
While some of the parameters are determined by the designer, some of the parameters are imposed by the hardware. For example, it was not possible to extract more than 13 subbands at real-time. Using small values for framesize resulted into high memory requirements for feature parameters, which is not desirable.
Considering the above facts, at the end of simulations a recognition rate of 92% is obtained with the following settings: framesize=350 samples, number of frames=12, number of subbands=l 1 and filter order=3.
For a flexible performance evaluation a Windows-based program is witten. In this program the user is able to add a new word to vocabulary by simply clicking a button and uttering the word to the microphone. Erasing a word from the vocabulary is also possible at any time. Testing the algorithm is carried out again by clicking another button. It is possible to see the effect of different features of speech instanstaneously. The program is developed by using the sound utilities of Windows. All the steps of the algorithm are successfully implemented in the program; the end detection, feature extraction and recognition phases. The main window of the program is shown in Figure 23.
It is also possible to change the algoritlmi parameters easily. In the 'options' menu, there are user-friendly menus for updating the parameters. These windows are showm in Appendix A. This program is useful for obtaining optimum algorithm parameters, especially for endpoint detection tliresholds.
KAREL ELEKTRONIK Voice Dialer
m K H R c L
Vafsian-l .1 ■&> Options /Quit ...* j _ ... ... lD.Thi'0ehold:i|FmmissizeMOO #Ffame;U iSofSubbandsil?: , 1 '
- i
Figure 21: Main window o f interactive simulation program
3.2 Real-time System Description
The voice-dialer project is planned to be a feature of Karel switchboxes. There is already a microprocessor on the switchbox to manage the functions of the switchbox. If the software of the speech recognition functions were added on this microprocessor the microprocessor could not succeed to manage its own tasks. Although the computational complexity of speech recognition task is not high; the nature of real-time implementation made it necessary to process the speech signal immediately.
In order to extract features in real-time a microcontroller is used. The time consuming tasks of recognition algorithm, endpoint detection and feature extraction are implemented on this microcontroller. Management procedures, parameter storage
and recognition tasks are implemented on the host microprocessor on the sv^ itchbox. A general structure of the real-time system is sho\\m in Figure 24. In this structure the host microprocessor is not bothered with time-critical operations of speech recognition system.
Figure 24: General description o f real-time recognition system.
The software on the microcontroller is written in a custom assembly language. In the real-time code development, the nature of filter coefficients and decimation unit at every decomposition branch lead to considerable computational saving. To implement the filters, multiplication operations are carried out by using shifting operators. For decimation, instead of dropping one of two outputs, only one necessary output is calculated.
The real-time system is going to be a commercial product. For this reason it should avoid alarms. Most users can recognize at most 10 words by heart [23]. One important question which arises in this aspect is the words that are out of vocabulary;
WTiat should happen if the user tells a word out of \’ocabulary? Unless a prior measure is taken; the algorithm will blindly choose one of the words as the result.
There are two approaches for the solution of this problem. The first one is as follow's: An extra vocabulary word is formed by averaging all the features in the vocabulary. If the recognized word appears as this new word; it is decided that the word is out of vocabulary.
Another approach is setting up an in-vocabulary threshold. If the minimum distance is above this threshold it is decided that the w'ord is out of vocabulary.
In this thesis, the second approach is chosen. An emperical threshold is obtained using the simulation results.
One similar problem is observed at the training section. If the user trains two similar w'ords such as 'sinan' and 'inan', the system becomes very vulnerable. To prevent such a case a word verification procedure is applied at the training phase. This is very similar to the above process: When a new word is uttered during the training phase, its minimum distance with the current vocabulary w'ords is obtained. This distance must be above a likelihood thresold; the new word must be reasonably different from the current elements of the ^'ocabulary. If the mimimum distance is below this threshold it is decided that a similar word is already in vocabularj', so the w'ord is rejected.
Applying the above procedures made the algorithm more robust. The user is forced to use dissimilar words which directly increases the reliability of the system.
A picture of the system is shown in Figure 25. The encircled section is the only extra hardw'are used for speech recognition system. It is an 8-bit microcontroller from PIC family of Microchip.
Figure 23: Picture o f the whole system.The encircled section is the recognition hardware
The program for the system is developed using an emulator for PIC and using a monitor program for the other microprocesor. A general picture of the development environment is shown in Figure 24.
Figure 24: A general picture o f the development environment
Chapter 4
Conclusion
In this thesis, a computationally efficient speech recognition system is proposed for a real-time voice-dialer.
The voice-dialer is planned to be an attribute to Karel PBXs. In order to have a cost- efficient and computationally efficient system, the voice-dialer is designed to work on two simple microprocessors. One is the host microprocessor on the PBX, the other is a microcontroller from the PIC family.
The time-critical and computationally costly parts of the algorithm are implemented on the PIC. The parts which require high memory and high-precision data structures are implemented on the host microprocessor.
The system is designed to have a vocabulary size of about 10 words. Each of the local subscriber of the PBX will have its own vocabulary. The nature of the system requires the voice-dialer to be speaker-dependent, because each user may have different wnrds to train. Et'en for the same wnrd the system must call different numbers, e.g., the w-ord 'home' corresponds to different places for each subscriber.
In the recognition system, first an endpoint detection is performed. Energy comparison method is applied for endpoint detection. The ratio of speech energy to
en\'ironmeiit noise energ}' is measured on short frames. If this ratio remains over a predefined tlireshold it is decided that speech has started.
After endpoint detection, feature extraction is performed on fixed number of frames long enough to cover a single word. Subband feature parameters are used as the feature parameters of the recognition system. Subband feature parameters are obtained by using a computationally efficient filter bank structure. The filter bank structure divides the frequency spectrum similar to mel-scale which resembles the human auditory system.
In this thesis feature extraction is performed on PCM quantized speech. PCM quantization is a logaritlimic quantization method which increases the SNR level of speech without increasing the bit allocation for each sample. Feature extraction on PCM quantized speech resulted into computational savings because the codecs which are used in this project are producing PCM speech directly. In this way PCM-to- linear speech conversion is skipped and the system processes 8-bit data instead of 12- bit linear data. This provides significant amount of computational savings. This saving may be a matter of concern for real-time applications like this project.
In this thesis, feature extraction method is similar to [12]. Since the recognition enviroment of this project is not as noisy as [12], feature extraction parameters are chosen to reduce the computational cost. One reduction is done on the filter order. In
[12] a third order Lagrange filter is used, in this thesis a second order Lagrange filter is used. In [12], 21 subband feature parameters are used, in this thesis 11 subband feature parameters are used. A comparison of the requirements and parameters of the two project is given in Table 3. With these parameters, a recognition rate of 92% is obtained for a 10 word vocabulary in this thesis.
To increase the reliability of the system further, the user is forced to eliminate similar \^^ords during the training section. When a new word is trained, it is compared with
the current words in the vocabulary. If there is a similar w-ord. the new w^ord is rejected.
The project of E.Erzin[12] This project Speaker independent Speaker dependent
Large vocabulary Small vocabulary
21 subbands 11 subbands
SUBCEP parameters Subband feature parameters
HMM model Template matching
7*’’ order Lagrange filter 3^^* order Lagrange filter
Table 3: Comparison o f Erzin [12] and this project
If the system requirements are changed, e.g., a speaker-independent, large vocabulary system is desired, the real-time voice-dialer can be updated easily to satisfy the new requirements by increasing the filter order, number of subbands etc. The independent hardware structure makes this possible. In such a case most of the updates are needed on the off-line part. The real-time part wall stay almost the same.
One last point which I want to mention is on the university-industry collobration. This project is developed in coorperation wdth Karel Electronics Inc. I believe that such projects serve to strenghten industry and university cooperation. The theoretically developed algoritlmis are actually implemented in practical applications providing invaluable feedback for further research areas. By means of such projects, experiences of each sides are shared. Seeing aware of the needs of industry, researchers wall try to find better solutions to practical problems.
Bibliography
[1] J.R. Deller, J.G. Proakis, and J.H.L. Hansen. Discrete-time Processing o f Speech Signals. MacMillan, 1993.
[2] L.R.Rabiner and R.W. Schafer. Digital Processing o f Speech Signals. Prentice- Hall, 1978.
[3] N.S. Jayant. Digital Coding o f Speech Waveforms. Prentice-Hall, 1984.
[4] Panes E. Papamichails. Practical Approaches to Speech Coding. Prentice & Hall, 1987.
[5] Parsons Tomas. Voice and Speech Processing. McGraw-Hill, 1987.
[6] J.W. Picone “Signal modelling tecniques in speech recognition” . Proceedings o f IEEE, vol. 81, pp. 1215-1247, Sept. 1993
[7] L. Rabiner and M. R. Sambur “An algorithm for determening the endpoints of isolated utterances”. Bell System Tech., pp. 297-315, Feb. 1975.
[8] J.R. Deller, D. Hsu and L.J. Ferrier “On the use of hidden Markov modelling for recognition of dysarthric speech”. Computer Methods and Programs in Biomedicine, vol. 2,pp. 125-139, June 1991.
[9] J.G. Wilpon, R.P. Mikkilineni, D.B. Roe "Speech recogntion: From the laboratory to the real world“. AT&T System Technical Journal, ^'ol. 69 pp. 14-24, Oct 1990.
[10] N.S. Jayant “Digital coding of speech waveforms: PCM, DPCM and DM quantizers”. Proceedings o f the IEEE, vol. 62, pp. 611-632, May. 1994.
[11] N. Rydbeck and C.E.W. Sundberg. “Analysis of digital errors in nonlinear PCM systems”. IEEE Transactions on Communicaitons, pp. 59-65, January 1976.
[12] E.Erzin. New Methods for Robust Speech Recognition. Phd. Thesis. Bilkent University, 1995.
[13] E. Abhaya and G.L. Wise “Some notes on optimal quantization”. Proc. Int. Conf On Communications, pp.1-5, Denver, June 1981.
[14] T. Begger. “Optimum quantizers and permutation codes”. IEEE Trans. On Information Theoiy, pp. 759-765, November 1972.
[15] F. Jabloun, Large vocabulary speech recognition in noisy environments. Ms. Thesis, Bilkent University, July 1998.
[16] L. Rabiner and R.E. Crochiere, Multirate Signal Processing, Prentice-Hall, 1973.
[17] I. Daubechies. Ten Lectures on Waveletes. SIAM Press, Philadelphia, 1992
[18] C. W. Kim, R. Ansari and A. E. Çetin “A class of linear-phase regular biorthogonal waveletes”. Proc. o f the Int. Conf. on Acoustics, Speech and Signal Processing 1992 (ICASSP '92), vol 4, pp. 673-677,1992.
[19] S.M. Phoong. C.W. Kim, P.P. Vaidyanathan. and R. Ansari. "A new class of two-channel biorthogonal filter banks and wavelet bases“. IEEE Trans, on Signal Processing, pp. 649-665,1995.
[20] E. Erzin, A.E. Çetin and Y. Yardımcı, “Subband analysis for robust speech recognition in the presence of car noise”. Proc. o f the Int. Conf. on Acoustics, Speech and Signal Processing 1995 (ICASSP '95), vol 1, pp. 417-420,1995.
[21] A. N. Akansu and M. J. T. Smith. Subband and Wavelet Transforms, Design and Applications. Kluwer Academic Publishers, 1996.
[22] M.H. Solmaz, A.E. Çetin. “Altband enerjilerini kullanarak ses tanıma”. 6. Sinyal İşleme ve Uygulamaları Kurultayı (SIU 98), Kızılcahamam Ankara, May. 1998.
[23] P. Hoavisto, Nokia Coproration Presentation in Tempere University, June 1998.
[24] M.R. Sambur, and L.R. Rabiner, “A Speaker Independent Digit Recognition System”, Bell System TechnicalJournal, vol 54, no 1, pp. 81-102, January 1975.
[25] L.R. Rabiner, “A tutorial on hidden Markov models and selected applications in speech recognition”, Proc. O f IEEE, vol. 77, pp. 257-285, Feb 1989.
[26] F.S. Gürgen, S. Sagayama, and S. Furui, “Line spectrum frequency based distance measures for speech recognition”, Proc. Int. Conf. Spoken Language Processing, Kobe, Japan, 1990.
[27] K.K. Paliwal, “On the use of line spectral frequency parameters for speech recognition”, Digital Signal Proc. A review Jour. Vol. 2, pp. 80-87, April 1992.
Appendix A Interactive
Simulation Program Menus
This program is written to make the simulations of the algorithm interactively. In this section the adjustable parameters of the program are introduced.
Form2
Figure 25 is the menu to adjust framesize and number of frame parameters. The value is adjusted by using the sliding tick.
Form2
WindowUfl^h· Number of Subbands
I
End Detection I FilterTVpeji! s: ii« il I ii. i,? ■ T'· il If
-n-ChOO$# One of the below Subband Schemes |
;0 1 1 Subboinds ' ... ^... .... "1^’ 17 Subbands f,'»'r “i,■..'>’?■:·■'ijihcr .'·« '* OK Cancel '^'4f V''·'"'' ■' V >,
Figure 26:Filterbank decomposition scheme selection
Figure 26 is used to choose the filterbank decomposition scheme. 11, 13 and 17 subbands are available in the program.
Figure 27 is the menu to adjust the endpoint detection parameters. These are the threshold values of ‘ratio’ and ‘delay’.
Figure 28 shows the menu for choosing the filter used in the filterbanks. 2"‘* order and 3’^^' order Lagrange filters are available in the menu.
FmmZ H
j Window Length I Number of Subbands' EndDetection | Filter "rvpej; ! ~T
■' 'i
Eh^f Threshold Value for End Detection
C u rre n ^ l 79999995231628]
Enter End Detection Delay Value
All V ^ ■ Afit ti?
- '"'’.»I t|,. , ' ^ I [v” i,'
3 *#li
■.<■-Figure 27:Endpoint detection threshold adjustment
Irorml 1
j Window Lengit| i .... -... j....^
Number of Subbands 1 End Detedion Filter Type j
Figure 28:Filter selection tab