DEVELOPMENT OF METHODS FOR IDENTIFICATION AND
CHARACTERIZATION OF AUTOLOGOUS ANTIBODY RESPONSES IN SMALL CELL LUNG CANCER AND BEHCET’S DISEASE
A THESIS SUBMITTED TO
THE GRADUATE SCHOOL OF ENGINEERING AND SCIENCE OF BILKENT UNIVERSITY
IN PARTIAL FULFILLMENT OF THE REQUIREMENTS FOR THE DEGREE OF
MASTER OF SCIENCE IN
MOLECULAR BIOLOGY AND GENETICS
By
Alper Poyraz
August 2016
iii
ABSTRACT
DEVELOPMENT OF METHODS FOR IDENTIFICATION AND CHARACTERIZATION OF AUTOLOGOUS ANTIBODY RESPONSES IN SMALL CELL LUNG CANCER AND BEHCET’S DISEASE
Alper Poyraz
M.S. in Molecular Biology and Genetics Advisor: Ali Osmay Güre
August 2016
Autologous antibodies are known to be elicited in Behçet’s Disease (BD) and Small Cell Lung Cancer (SCLC). SCLC consists 15-20% of all lung cancer cases. It is follows a most aggressive course and generally patients are diagnosed at later stages. The median survival of patients is 9-12 months. Diagnostic methods such as CT and PET are somewhat useful in the diagnosis of lung cancer but not so much for SCLC as the doubling time of this tumor is very rapid. Therefore, new diagnostic tools are needed for early diagnosis and to increase median survival of patients. Behçet’s Disease is autoimmune disease and the prevalence of BD in Turkey is the highest in the world. Also autologous antibodies against various antigens associated with BD have been discovered in BD. BD has vascular, oral, cutaneous and
neuronal subtypes and autologous antibodies correlating with each subtype have been reported. However, for BD, there does not exist a diagnostic or prognostic test as none have been
developed yet. However autoantibodies can be utilized for the diagnosis and follow-up of SCLC and BD because it is known that autoantibodies are expressed well in advance of disease symptoms. The first aim of this study was to determine a correlation between antigen
expression levels in tumor tissues and the presence of autologous antibodies. The second aim of this study was to extend earlier experiments related to the characterization of autologous antibodies against known and novel antigens in SCLC and BD, utilizing high-density protein arrays (PA). The third and major aim of this study was to develop a reliable and sensitive method that could be used to evaluate protein array screening results and lastly, to validate these results by performing optimized ELISA and Western Blot experiments.
Previously, PAs were screened with 50 SCLC, 50 BD and 50 healthy serums in our laboratory, and evaluated visually utilizing no automation. Sensitivity and specificity values
iv
were calculated using custom-generated antigen panels which included 180 antigens. ELISA experiments were performed to validate antigens thus discovered. However, largely discrepant PA and ELISA results, together with inconsistent ELISA results required us to optimize ELISA conditions, as well as to generate an automated PA evaluation method that would generate numeric data. We modified ELISA by altering various parameters until we were able to obtain consistent results. We also generated a reliable method by which we could produce numeric data corresponding to antibody presence as determined from PA screening results. The method is based on the calculation of pixel intensities of sero-reactive clones on the array which are converted to numeric data, and the subsequent determination of proper cut-offs by which sensitivity and specificity of antibody responses can be generated by comparing values obtained from healthy to those obtained from diseased serum. We call this the “Digital Spot Evaluation” (DSE) tool.
DSE was performed utilizing Adobe Photoshop CS6 and parameters of the test were optimized using five replicate screens of a given serum. Pearson’s r correlation values of repeated experiments after optimization were close to 1. Also, when protein arrays are screened using DSE on different days by different researchers, results are highly concordant. We
evaluated protein array screening data obtained for SCLC and healthy sera by DSE. In particular, antibody intensities against SOX2, p53 and POLB proteins were calculated and sensitivity/specificity values were determined. With DSE based evaluation of protein arrays, we reached 44%, 6% and 20% sensitivity at 100% specificity for SOX2, p53 and POLB proteins respectively. On the other hand if we evaluate 3 proteins together as a panel, our sensitivity increases to 56% at 100% specificity, and 66% sensitivity at 96% specificity.
However, even after optimization, ELISA results showed 32%, 4% and 4% sensitivity at 100% specificity for SOX2, p53 and POLB proteins respectively, demonstrating that DSE is
significantly more sensitive than ELISA. We are planning to use DSE to evaluate PA data generated from many other types of tumors in the future and to and possibly to develop a kit based on this method to be utilized for the diagnosis and follow-up of SCLC and BD.
Keywords: Small Cell Lung Cancer, Behçet’s Disease, protein array, diagnosis, autologous antibodies, biomarker, ELISA, sensitivity, specificity
v
ÖZET
KÜÇÜK HÜCRELİ AKCİĞER KANSERİ VE BEHÇET HASTALIĞINDA OLUŞAN
OTOLOG ANTİKOR YANITININ BELİRLENMESİ VE TANIMLANMASI İÇİN YÖNTEM GELİŞTİRİLEMESİ
Alper Poyraz
Moleküler Biyoloji ve Genetik Bölümü, Yüksek Lisans Tez Danışmanı: Ali Osmay Güre
Ağustos 2016
Behçet Hastalığında (BH) ve Küçük Hücreli Akciğer Kanseri’nde (KHAK) otolog antikorların geliştiği bilinmektedir. KHAK akciğer kanser hastalarının %15-20 sini oluşturmaktadır. En agresif akciğer kanseri tipi olup genellikle son evrelerde teşhis edilmektedir. Ortalama yaşam süresi 9-12 aydır. Akciğer kanseri teşhisinde bilgisayarlı tomogrofi ve PET kısmen yararlı olsa da tümör hücrelerinin iki katına çıkma süresi çok hızlı olan KHAK için bu yöntemlerin kullanılması uygun gözükmemektedir. Bu yüzden yaşam süresini arttırmak ve erken teşhisi sağlayabilmek için yeni teşhis yöntemleri gereklidir. Behçet Hastalığı otoimmün bir hastalıktır ve dünyada Behçet Hastalığın görülme sıklığı en yüksek olan ülke Türkiye’dir. BH ile ilişikili çeşitli antijenlere karşı gelişen otolog antikorlar BH’da keşfedilmiştir. BH’nın ağız, deri, vasküler ve nöronal alt grupları bulunmaktadır. Alt grupları ile ilişki otolog antikolar daha önceki çalışmalarda gösterilmiştir. Ancak BH için prognostik ve diyagnositk kitler geliştirilmemiştir. KHAK ve BH’ının teşhisi ve takibi için otoantikorlardan faydalanılabilinir. Çünkü otoantikolar hastalık semptomları ortaya çıkmadan üretildikleri bilinmektedir. Bu çalışmanın ilk amacı tumör dokularında antijen ifade seviyesi ile otolog antikorların varlığı arasında ilişkiyi belirlemekti. İkinci amacı KHAK ve BH’nda bilinen ve yeni keşfedilmiş antijenlere karşı üretilen otolog antikoların tespiti ile ilgili önceden yapılmış deneyleri geliştirmek olmuştur. Üçüncü ve ana hedefimiz ise protein array tarama sonuçlarının değerlendirilmesinde kullanılacak hassas ve güvenilir bir metot geliştirmek ve ELISA ve Western Blot deneyleriyle de sonuçları doğrulamaktır.
vi
Protein Arrayler (PA) 50 KHAK, 50 BH ve 50 sağlıklı serumlarıyla laboratuvarımızda diğer araştırmacılar tarafından taranmış ve görsel olarak otomatikleştirilmiş metotlar
kullanılmadan değerlendirilmiştir. Hassasiyet ve özgüllük değerleri antijen panelleri oluşturularak hesaplanmıştır. Antijenlerin doğrulanması için ELISA deneyleri yapılmıştır. Ancak önceki ELISA ve protein array deney sonuçları birbirine göre oldukça farklıdır. ELISA deney sonuçlarının tutarsız olmasından dolayı ELISA deney koşullarının optimize edilmesi gerekmektedir. Ayrıca PA’de sinyallerin numerik değerlere dönüştürübilen otomatikleştirilmiş PA değerlendirme metodu geliştirilmelidir. Tutarlı sonuçlara ulaşana kadar ELISA deneyi parametreler değiştirilerek modifiye edilmiştir. PA tarama sonuçlarından antikor varlığı ile ilişkili sayısal değer oluşturabilen güvenilir PA değerlendirme metodu geliştirilmiştir. Metodun çalışması PA de bulunan reaktif klonların piksel yoğunluklarının hesaplanmasına dayalıdır. Sağlıklı ve hasta serum taramalarından elde edilen sonuçların karşılaştırılmasıyla antikor yanıtlarının hassasiyet ve özgüllük değerleri hesaplanmıştır. Bu yönteme” Dijital Spot Değerlendirmesi” (DSD) adı verilmiştir.
DSD Adope Photoshop CS6 programı alt yapısına dayalı çalışmaktadır. Programdaki parametreler 1 serum için 5 tarama yapılarak optimize edilmiştir. Tekrar deneylerinin Pearson’s r korelasyon değerleri 1’e yakındır. Ayrıca farklı günlerde farklı araştırmacılar tarafından taranan PA’lerin DSD programı ile değerlendirilme sonuçları oldukça uyumludur. DSD programı kullanılarak KHAK kanseri ve sağlıklı sera taramaları değerlendirilmiştir. SOX2, p53 ve POLB proteinlerine karşı gelişen antikor yoğunlukları değerlendirilmiş
hassasiyet/özgüllük değerleri hesaplanmıştır. DSD değerlendirme sonuçlarına göre SOX2, p53 ve POLB proteinleri için sırasıyla %100 özgüllükte, %44, %6 ve %20 hassasiyet değerlerine ulaşılmıştır. 3 proteinin panel olarak birlikte değerlendirilmesiyle %100 özgüllükte %56 hassasiyete, %96 özgüllükte %66 hassasiyete çıkmaktadır. Ancak optimizasyon yapıldıktan sonra bile, ELISA sonuçlarıyla SOX2, p53 ve POLB proteinleri için sırasıyla %100 özgüllükte, %32, %4 ve %4 hassasiyet değerleri elde edilmektedir. Sonuçlarımız DSE’nin ELISA
yöntemine göre daha hassas olduğunu göstermektedir. Bu nedenle gelecekte diğer tümör tipleri ve BH için taranmış PA’lerin hepsi DSE yöntemiyle değerlendirilmesi, KHAK ve BH’nın teşhisi ve takibi için de DSE yöntemi kullanılması prensibiyle çalışacak kit geliştirilmesi planlanmıştır.
Anahtar Kelimeler: Küçük Hücreli Akciğer Kanser, Behçet Hastalığı, protein array, teşhis, otolog antikorlar, biyobelirteç, ELISA, hassasiyet, özgüllük
vii
ACKNOWLEDGEMENTS
My sincere thanks to Assoc. Prof. Dr. Ali Osmay Güre for giving me this opportunity in his lab and sharing his valuable advices throughout my masters study. He helped me with his wide knowledge and experience. He has supported me about enterpreneurship and gave me an opportunity to discover novel possibilities for my career.
For being members of my thesis committee and valuable contributions to this work, I would like to thank Prof. İhsan Gürsel and Prof. Burçak Vural.
I would like to acknowledge Şükrü Atakan for his remarkable efforts on protein array screenings and analysis of them.
Furthermore I would like to thank all present and former members of Gure lab; Şükrü Atakan, Kerem Mert Şenses, Sinem Yılmaz Özcan, Barış Küçükkaraduman, Seçil Demirkol, Waqas Akbar, Murat İşbilen, Abbas Güven Akçay, Mehdi Ghasemi for their cooperative work during my masters study.
I would like to thank all my instructors in Bilkent MBG for their contributions to my scientific development.
I would like to thank my family for all their support and encouragement about my education and my decisions.
viii
TABLE OF CONTENTS
ABSTRACT ... iii
ÖZET ... v
ACKNOWLEDGEMENTS ... vii
TABLE OF CONTENTS ... viii
LIST OF FIGURES ... x LIST OF TABLES ... xi ABBREVIATIONS ... xii 1 INTRODUCTION ... 1 1.1 Lung Cancer ... 1 1.2 Behçet’s Disease... 2
1.3 Immune Response against Cancer ... 3
1.4 Utility of Anti-Lung Cancer Antibodies in Early Diagnosis of Cancer ... 4
1.5 Methods for Discovery of Autoantibodies ... 5
1.6 Aims of the Study ... 6
1.7 Study Design ... 6
2 MATERIALS and METHODS ... 8
2.1 Correlation between Antibody Responses and Antigen Expression ... 8
2.1.1 Patient and Healthy Controls ... 8
2.1.2 ELISA ... 8
2.1.3 Western Blot ... 9
2.1.4 Immunohistochemistry ... 9
2.1.5 Statistical Analysis ... 10
2.2 Discovery and Validation of Autologous Antibodies for Behcet’s Disease ... 10
2.2.1 Patient and Healthy Controls ... 10
2.2.2 HisTagged Protein Expression and Purification ... 10
2.2.3 ELISA ... 12
2.2.4 Western Blot ... 12
2.2.5 Statistical Analysis ... 13
2.3 Development of Methods for Evaluation of Protein Array Screening ... 13
2.3.1 Protein Array ... 13
2.3.2 Protein Array Screening ... 14
2.3.3 Evaluation of Protein Array Screening ... 15
2.3.4Calculation Panel Sensitivity and Specificity by using Monte Carlo Analysis ... 18
2.3.5 Statistical Analysis ... 18
ix
3.1 Correlation between Autologous Anti-SOX2 Antibody Response and Antigen Expression .... 19
3.2 Discovery and Validation of Autologous Antibodies for Behcet’s Disease ... 25
3.2.1 Confirmation of Earlier ELISA Results for Behçet’s Disease ... 25
3.2.2 Performing ELISA Experiments for Selected Antigens ... 26
3.2.3 Western Blot and ELISA Comparison ... 29
3.2.4 Specificity and sensitivity of Behcet related antibodies as determined by ELISA ... 30
3.2.5 Re-evaluation of Protein Array Screening Data for the Identification of Additional New Proteins in Behçet’s Disease... 31
3.2.6 ELISA Results of New Proteins ... 33
3.2.7 ROC Curves for Newly Selected Proteins ... 35
3.2.8 ELISA Values for Subgroups of Behçet’s Disease ... 36
3.3 Development of Methods for Evaluation of Protein Array Screening ... 38
3.3.1 Repeating Protein Array Screening for Consistency ... 38
3.3.2 Re-evaluation of Protein Array Screening for Antibodies in SCLC and Comparison with ELISA results ... 39
4 DISCUSSION ... 42
4.1 Correlation between Autologous Anti-SOX2 Antibody Response and Antigen Expression .... 42
4.2 Autologous Antibodies in BD ... 43
4.3 DSE based analysis of Protein Arrays as a new means for antibody discovery and testing ... 44
5 FUTURE PERSPECTIVES ... 45
Bibliography... 46
x
LIST OF FIGURES
Figure 2.1: Spotting Patterns of Clones and Example of Protein Array.. ... 14
Figure 2.2: Protein Array Result... 16
Figure 2.3: Opening Histogram Window in Photoshop. ... 17
Figure 2.4: Mean Value of Signal. Our interested protein was showed with arrow and duplicate of signal was showed with red circle ... 17
FFigure 3.1: Comparison of Old ELISA Results with New ELISA Results. ... 20
Figure 3.2: Comparison of Repeated ELISA Experiments. ... 20
Figure 3.3: SOX2 Protein Staining by IHC. ... 21
Figure 3.4: SOX2 Western Blot Results for Confirmation of anti-SOX2 Antibody ELISA Data... 23
Figure 3.5: Correlation Analysis Between Repeated Experiments for FB-1 and FB-2 proteins. ... 26
Figure 3.6: Correlation Analysis Between Repeated Experiments for FB-5 and FB-7 proteins. ... 27
Figure 3.7: Correlation Analysis Between Repeated Experiments for FB-10, FB-12 and FB-13 proteins. ... 28
Figure 3.8: Comparison of ELISA Experiments with Western Blot for 8th and 42nd sera. ... 29
Figure 3.9: ROC Curves of 3 Proteins. ... 30
Figure 3.10: ROC Curves of 3 Proteins. ... 31
Figure 3.11: Correlation Analysis Between Repeated Experiments for A-1, A-2 and A-3 proteins. ... 33
Figure 3.12: Correlation Analysis Between Repeated Experiments for A-4, A-5 and A-6 proteins. ... 34
Figure 3.13: ROC Curves of 6 Proteins. ... 35
Figure 3.14: ELISA Values for Subgroup of BD. ... 36
Figure 3.15: ELISA Values for Subgroup of BD.. ... 37
Figure 3.16: Protein Array Screening Result of Ovary Cancer Serum.. ... 38
Figure 3.17: ROC Curves of SOX2, p53, POLB Proteins. ... 40
xi
LIST OF TABLES
Table 1.1: Examples to Diagnostic Antibody Panels For Lung Cancer ... 5
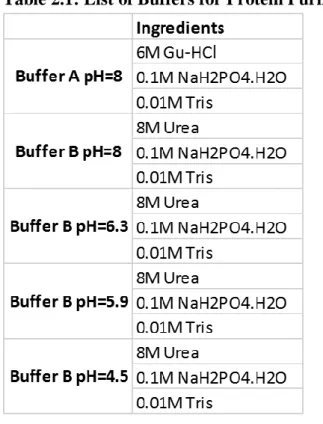
Table 2.1: List of Buffers for Protein Purification ... 11
Table 3.1: Clinical features of SCLC patients ... 19
Table 3.2: SOX2 antibody and protein staining characteristics of SCLC patients ... 22
Table 3.3: 6 Seronegative and 6 Seropositive Patient ELISA, IHC and WB Results ... 23
Table 3.4: SOX2 antibody correlates with clinical stage ... 24
Table 3.5: SOX2 antibody correlates with intensity of SOX2 protein expression ... 24
Table 3.6: Clones obtained after protein array screening evaluations ... 25
Table 3.7: Sensitivity and Specificity values of the antigen panels generated with protein array screening evaluations by Monte Carlo Method ... 25
Table 3.8: Sensitivity and Specificity Values of Newly Selected Proteins ... 32
Table 3.9: Clones obtained after re-evaluation protein array screening ... 32
Table 3.10: Pearson’s r values of Repeat Experiments ... 39
Table 3.11: Sensitivity and Specificity Values of 3 Proteins According to Protein Array Screening and ELISA Results... 41
Supplementary Table 1: SOX2 Antibody Response and SOX2 Protein Expression Characteristics for 59 SCLC patients ... 50
Supplementary Table 2: ELISA Values of SCLC Patients for SOX2 Antibody ... 52
Supplementary Table 3: ELISA Values of Controls for SOX2 Antibody... 54
Supplementary Table 4: ELISA and Protein Array Results of SOX2 Antibody Response in SCLC Patients ... 58
Supplementary Table 5: ELISA and Protein Array Results of p53 Antibody Response in SCLC Patients ... 58
Supplementary Table 6: ELISA and Protein Array Results of POLB Antibody Response in SCLC Patients ... 60
xii
ABBREVIATIONS
ANAPC5 Anaphase Promoting Complex Subunit 5
ANKS6 Ankyrin Repeat And Sterile Alpha Motif Domain Containing 6
AP Alkaline Phosphatase
BCL11A B-Cell CLL/Lymphoma 11A
BD Behçet’s Disease
CCNL2 Cyclin L2
CT Computerized Tomography
CV Coefficient of Variation
DHFR Dihydrofolate Reductase
DSE Digital Spot Evaluation
ELISA Enzyme Linked Immunosorbent Assay
FAM32A Family with Sequence Similarity 32 Member A
FB Fetal Brain
FBXO44 F-Box Protein 44,
FTH1 Ferritin, Heavy Polypeptide 1
GON4L GON-4 Like
HLA Human Leukocyte Antigen
HSP Heat Shock Protein
HSV Herpes Simplex Virus
IHC Immunohistochemistry
IL Interleukin
ING4 Inhibitor Of Growth Family Member 4
IPTG Isopropyl-beta-D-thiogalactopyranoside
LB Lysogeny Broth
LDH Lactate Dehydrogenase
LPPR3 Lipid Phosphate Phosphatase-Related Protein Type 3
MC Monte Carlo
NaOH Sodium Hydroxide
xiii
RT Room Temperature
PA Protein Array
PC Pixel Count
PET Positron Emission Tomography
PND Paraneoplastic Syndrome
PNPP para-Nitrophenyl Phosphate
POLB Polymerase (DNA) Beta
SARNP SAP Domain Containing Ribonucleoprotein
SCLC Small cell lung cancer
SD Standard Deviation
SEREX Serological Analysis of Expression cDNA Libraries
SERPA Serological Proteome Analysis
SOX2 SRY (Sex Determining Region Y)-Box2
STMN4 Stathmin 4
STUB1 STIP1 Homology And U-Box Containing Protein 1 ZIC2 Zinc Finger of the Cerebellum Protein Family Member 2
1
CHAPTER 1
1 INTRODUCTION
1.1 Lung Cancer
Cancer was the reason for over 8 million deaths worldwide in 2013 and approximately 15 million people were diagnosed with cancer in the same year. While cancer was the third leading cause of death in 1990, it was the second in 2013 [1, 2] . Despite the many novel discoveries in recent years related to cancer treatment and diagnosis, cancer related death rates keep increasing [3]. Researchers and clinicians predict that 22 million new cancer cases will occur till 2030, and that 13 million people will die in this period [4]. Until now more than 200 cancer types have been recorded and lung, prostate, breast and colon cancers are the most deadly cancer types (Cancer Research UK, National Cancer Institute). About 1.1 million men and half a million women died because of lung cancer in 2012 [4]. A main reason of lung cancer is cigarette smoking that causes 80% of lung cancer deaths in men and 50% of lung cancer deaths in women. The duration and quantity of smoking increase the risk of lung cancer [5]. Exposure to radon, air pollution, asbestos, some metals such as chromium and arsenic and radiation are other reasons of lung cancer [6] [7]. Chest radiograph, positron emission tomography, computed tomography and magnetic resonance imaging are used for diagnosis of lung cancer [8] [9] [10]. Treatment methods of lung cancer depends on tumor types and stages and include, surgery, chemotherapy and radiation therapy.
Lung cancer has two major subgroups: non-small cell lung cancer (NSCLC) and SCLC. The ratio of NSCLC patients in all lung cancer is 85%, rest of all lung cancer patients that is 15% of them are SCLC patients [11] [12]. Nowadays, the incidence of SCLC starts to decrease in some countries especially developed countries because tobacco smoking that is the major reason of SCLC, is decreasing [13]. However, about 80% of SCLC patients are diagnosed at stage IV and also metastasis is observed [14]. Generally, SCLC patients have a bad prognosis and median survival of patients with extended disease is between 9 and 12 months, but if patients could be diagnosed at limited stage, prognosis of them is better than diagnosed at extended stage. Therefore, diagnosis of SCLC at an early stage is important for increasing survival of patients [15] [16] [17]. As there are currently no reliable and cheap methods that can be used for the early diagnosis of SCLC, new methods need to be urgently developed. A candidate of diagnostic method for SCLC can be autologous anti-tumor
2
antibodies because autoantibodies are frequently observed before the onset of clinical symptoms [18] [19].
1.2 Behçet’s Disease
Behçet’s Disease (BD) was first described in 1937 by Hulusi Behçet who was a Turkish dermatologist. He characterized BD with recurrent oral, genital ulcers and eye
inflammation [20]. After the first description, many others showed that BD is a multisystemic disease. Moreover arthritis, intestinal, vascular and pulmonary involvements are observed in BD patients as well [21]. In Silk Route regions that include Japan, Middle East and
Mediterranean countries the frequency of Behçet’s Disease is higher than the other regions in the world. Although frequency of BD is 14-20/100.000 along the Silk Route, Turkey has the highest prevalence around 110-420/100.000 among the Silk Route regions [22] [23]. On the other hand prevalence of BD is 0.64/100.000 and 0.33/100.000 in UK and USA respectively [24] [25]. In Middle East countries number of men with BD is higher than women, however in Asia number of women that are diagnosed with BD is higher than men [26].
The pathogenesis of BD is not completely understood. Many researches showed that genetic factors and environmental factors including infectious agents cause BD. Example of genetic factors is HLA-B51 gene that is related with BD. In Turkey 68% of BD patients are HLA-B51 positive for familial cases [27]. Moreover, IL10, IL23R and IL12B2 genes are related with BD [28] [29] . Infectious agents such as herpes simplex virus associate with BD. In BD patients HSV-1 presence was higher than healthy controls and the difference of HSV-1 between patients and controls was statistically significant [30]. Other infectious agents are Streptococcus species. Frequent antibodies against Streptococcal antigens were observed in Behçet Disease patients [31].
For diagnosis of BD, specific laboratory tests have not been developed yet. Therefore, tried defining criteria for BD diagnosis. Three criteria lists were generated, one which was created by the International Study Group for Behçet’s Disease in 1990 [32]. A second is the International Criteria for Behçet's Disease created in 2006 and updated in 2013 [33]. Lastly The Japanese Diagnostic Criteria is useful especially in Asia as its sensitivity and specificity values are higher for Asians compared to non-Asians[34]. All lists rely on symptoms that are recurrent oral ulcer, genital ulcers, cutaneous lesions, ocular, and articular manifestations. The
3
aim of the treatment for Behçet’s Disease is suppression of inflammatory attacks to protect organs by using immunosuppressors. The selection of drugs depends on involvement type, age, gender, attack duration [35].
On the other hand, many studies have led to the discovery of autoantibodies that are produced against antigens in BD. For instance PINK1, MTCH1, HSP70, retinal S-antigen, kinectin, and alpha enolase are found as antigens that are decisive for which manifestations are seen in BD[36][37][38]. Thus, autoantibodies could be utilized for diagnosis of BD and its follow-up.
1.3 Immune Response against Cancer
A major obstacle in the field of active immunization against cancer has been the difficulty of identifying tumor specific targets which are not tolerated by the immune system. A logical approach to bypass the complex requirements for antigenicity is to characterize naturally occurring anti-tumor antibody responses.
Some of these antigens are promising therapeutic targets or diagnostic tools. SOX group B and ZIC2 antigens, however, stand out of as being dramatically different: Antibodies against these antigens are present in 48% of small cell lung cancer patients and are (1)
reactive against antigens which are expressed only by the tumors and certain neuronal cells; (2) are frequently of very high titers (over 1:106); and (3) are present only in patients with cancer and not in healthy controls[39]. In addition, not only do these antibodies correlate with lower LDH levels, limited stage disease and better response to therapy[40], but seropositive patients show a trend for longer survival and remain progression-free post therapy for longer periods when compared to seronegatives[40]. Importantly, these associations are more prominent when antibody titers are high and/or if patients have both SOX as well as anti-ZIC2 antibodies[40]. These results strongly suggest that anti-SOX and ZIC antibodies are markers of effective anti-tumor immune responses. These antibodies occur in a significant percentage of NSCLC patients in whom they correlate with longer survival at higher titers as well.
4
1.4 Utility of Anti-Lung Cancer Antibodies in Early Diagnosis of Cancer The early diagnosis of lung cancer greatly affects the outcome of the disease. While 67% of stage IA NSCLC patients are expected to survive 5 years following tumor resection, this rate is 55% for stage IIA, 25% for stage IIIA and 1% of stage IV patients[41].Yet, only 15% of NSCLC patients have stage I disease when diagnosed. The utility of CT and/or, PET scanning and sputum analysis in early diagnosis of lung cancer is being studied extensively [42] [43], albeit not without contoversy [44][45]. It is clear, however, that early diagnosis lung cancer will have a most critical effect in outcome. If naturally occuring anti-neuronal immune responses, are effective in suppressing tumor growth, one would expect that they could eliminate tumors successfully or subdue them long enough until the tumors alter their phenotypes to escape immune recognition [46]. Indeed, PND associated with such antibodies is detectable many months to years before the clinical diagnosis of cancer in about 70% of cases. The maximum lag time and frequency of PND symptoms (and related antibodies) preceding tumor diagnosis is reportedly 54 months in 70% of cases for HuD [47], 5 years in 60% for recoverin [48], 14 months for CRMP5[49], 5 years and 83% for amphiphysin [50], [51] and 4 years in 70% of cases for anti-VGCC antibodies[52]. In 70% of these cases the underlying tumor type is SCLC, and in about 10% it is NSCLC [53]. However, we think this difference between the two tumor types is due to the tight association of PND with SCLC, since some of these antibodies are readily elicited in NSCLC in the absence of PND. The calculated lag times summarized above are based on the emergence of symptoms associated with PND. It is possible that the presence of antibody might be detected even earlier. We predict anti-neuronal/anti-tumor antibodies develop significantly earlier than the development of symptoms associated with the tumor in cases without PND as well, and that this will hold true for anti-SOX group B or anti-ZIC2 antibodies since these antibodies are at their highest titers at the time of diagnosis and remain unaltered up to several months afterwards[40]. Results of several large studies on the rates of lung cancer among high risk groups are now available and the chances of developing lung cancer for any individual can be estimated [54].
On the other hand many autoantibodies were discovered for diagnosis of lung cancer. One study by Pereira-Faca et al showed that 14-3-3𝛉 autoantibody could be potential
biomarker for lung cancer. It was discovered by utilizing 2D electrophoresis, Western blotting and mass spectrometry. They evaluated 14-3-3𝛉 autoantibody in a panel alongside
5
autoantibodies to PGP 9.5 and annexin I. The sensitivity of panel was 55% at 95% specificity[55]. Other autoantibodies that might be candidate biomarker for lung cancer diagnosis are LAMR1, triose-phosphate isomerase (TPI), mitochondrial superoxide dismutase 2 (MnSOD), α-enolase1, CEA and cytokeratin fragment 21-1 (CYFRA 21-1), p53, c-myc, Her-2, NY-ESO-1, MUC1, cancer antigen 1 (CAGE), and GBU4-5 [56-59]. Also screening methods and sensitivity / specificity values of them are shown in Table 1.1.
Table 1.1: Examples to Diagnostic Antibody Panels For Lung Cancer
1.5 Methods for Discovery of Autoantibodies
Autologous antibodies are used for diagnosis and prognosis of diseases. They are critical biomarkers for especially cancer, autoimmune and autoinflammatory diseases. Many studies have aimed the identification of new and valuable autoantibody biomarkers. Scientists are used different methods such as SEREX, SERPA, MAPPing, phage display and protein array for their discovery[60]. Each of these methods have advantages and disadvantages. Although SEREX provides the discovery of many antigens in one experiment, it gives high false positive results and needed the high volume of sera from patients[60]. Phage display technique enables us to screen patient sera and healthy sera simultaneously[61]. However, post translationally modified proteins are not detected using phage display[62]. Protein arrays have many advantages compared to other techniques. For screening protein arrays volume of sera can be very small [63]. A large number of antigens are screened at the same time[64]. For protein array, recombinant proteins are produced by using E.coli, yeast and insect cells. If
Autoantibody Panel Screening Method Sensitivity (%) Specificity (%) Reference 14-3-3𝛉, PGP 9.5, annexin I Western Blotting 55 95 [55] 14-3-3𝛉, PGP 9.5, LAMR1 Microarray 51 82 [56]
TPI, MnSOD ELISA 47 90 [57]
α-enolase1, CEA, CYFRA21-1 ELISA 69 98 [58]
p53, c-myc, Her-2, NY-ESO-1,
6
yeast and insect cell are used for expression, proteins are produced with correct post translational modifications. Disadvantage of protein array is quality of protein expression. High-quality proteins are essential for protein arrays[65].
1.6 Aims of the Study
- To search correlation of antigen expression with autologous antibody responses in Small Cell Lung Cancer patients’ tumor tissues.
- To characterize autoantibodies against known and novel antigens in SCLC and Behçet’s Disease
- To develop a reliable and sensitive method for evaluation of protein array screening - To validate results of PA by performing optimized ELISA and Western Blot
experiments.
1.7 Study Design
1) Showing the correlation of antigen expression with autologous antibody responses in Small Cell Lung Cancer patients’ tumor tissues
SOX2 protein staining by IHC for SOX2 protein expression in SCLC patients’ tissue samples
Performing ELISA experiments for measuring anti-SOX2 antibody level in SCLC and Healthy Sera
Performing Western blot for validation of ELISA experiments
Making correlation analysis to show association of antigen expression with antibody response
2) Characterization of autoantibodies against known and novel antigens Behçet’s Disease
Evaluation protein array screenings visually
Choosing best antigens that have high sensitivity and specificity values according to evaluation of PA for BD
7
Performing Western blot experiments to validate ELISA experiments Generation ROC curves according to ELISA results
Comparison of ELISA results with PA results
3) Development of reliable and sensitive method for evaluation of protein array screening
Finding which program measure signals in Protein Arrays Optimization of measurement parameters in program
Showing the reproducibility by performing repeated experiments Evaluation of protein arrays by utilizing developed method Generating ROC curves according to evaluations
8
CHAPTER 2
2 MATERIALS and METHODS
2.1 Correlation between Antibody Responses and Antigen Expression 2.1.1 Patient and Healthy Controls
For this study we used 59 SCLC patients and 157 controls that were age matched controls. For SCLC patients, ethics committee approval were approved from Atatürk Chest Diseases and Chest Surgery Education and Research Hospital, Ankara, Turkey. For healthy controls ethics committee approval were approved from Çapa Chest Diseases and Chest Surgery Education and Research Hospital of İstanbul, Turkey. The diagnosis of SCLC patients was confirmed pathologically. At the diagnosis of patients, clinicians recorded clinical data that included gender, age, LDH levels, tumor stage and AP levels. Moreover, a treatment method of all patients was chemotherapy. Also, clinicians followed patients and generated survival data. Serum was collected from patients at the time of diagnosis and controls, they were split into tubes for 100 ml aliquots and stored at -80oC.
2.1.2 ELISA
For ELISA experiments, we need SOX2, p18 and DHFR proteins. p18 was used for positive, though DHFR was used for negative controls. For production of them, prokaryotic pQE expression system (Qiagen Inc., Valencia, CA, and USA) was used. We used Ninety-six well Immulon 4 HBX plates (Thermo Scientific, Lafayette, CO, USA) for ELISA plate. 0.2 μg/ ml antigen was coated and plates were incubated at 4°C for 24 hours for coating. To prevent non-specific binding, blocking was critical and 5 % non-fat milk in PBS was used for blocking the wells. Plates were incubated at 4°C for 16 hours for blocking. We used two dilutions that were 1:400 and 1:1600 for serum. We added patients or healthy serums to wells and the plates were incubated at 37°C for 2 hours. For secondary antibody we used goat antihuman IgG - AP conjugate (Jackson Immunoresearch Laboratories Inc., West Grove, PA, USA). A dilution ration of it was 1:5000 in 5 % non-fat milk in PBS. Plates were waited at
9
RT for 2 hours. For AP substrate we used PNPP tablets (Thermo Scientific, Rockford, IL, USA). One tablet was solved in 10 ml 1X substrate buffer solution, and added 100 ul to each well by using multichannel pipette. A duration of plate incubations was 1 hour at RT. To stop enzymatic reaction, we used 2N NaOH. ELISA plates were read by using plate reader
(BioTek Instruments, Inc., Winooski, VT, USA). OD405 values of each well were recorded. Each ELISA experiments were repeated two times.
2.1.3 Western Blot
For this study, we used SOX2, p18 and FB6 proteins. p18 was positive control and FB6 was negative control. We prepared 12% SDS-PAGE gels, loaded 100 ng of each protein to well. Immobilon-P PVDF membranes (Milipore, St. Charles, MO, USA) were used for transfer proteins from the gel by using semi-dry transfer system (BioRad, Hercules, CA, USA). For blocking the membranes, 5% non-fat milk in PBS was used. The dilution ratio of serum was 1:3000. The membranes incubated with serum at 4°C for 16 hours. Also, the membranes washed with TBS-T. For secondary antibody goat anti-human IgG (Fc-specific)-HRP (Sigma, St. Louis, MO, USA) was used and the duration of incubation with secondary antibody was 2 hours. To visualize signals from membranes we used ECL-Plus Western Blotting system (GE Healthcare, Buckinghamshire, UK).
2.1.4 Immunohistochemistry
For IHC we need formalin-fixed paraffin embedded tumor tissue samples that were taken from patients at the time of diagnosis. Although our number of samples were 59, the IHC results of 55 samples were good for evaluation. 4 um pieces of tissues were placed on slides. Ventana Benchmark LT automatic immunostainer (Ventana Medical Systems, Tuscon, AZ, USA) was used for staining. To stain sections a primary antibody that was monoclonal mouse anti-human SOX2 primary antibody (MAB2018, R&D Systems, Minneapolis, MN, USA) was diluted to 1:25. The iViewT DAB Detection Kit (Ventana Medical Systems, Tuscon, AZ, USA) detected to samples. The stained tissue samples were evaluated by two pathologists, they generated the frequency and intensity values by using microscopy. For positive control, they used NTERA-2 cell line. Moreover, a normal tissue samples were negative control for IHC analysis.
10 2.1.5 Statistical Analysis
We tried to find a relation between survival and clinical features, SOX2 protein expression and SOX2 antibody response. We made correlation analysis for antibody response and protein expression. For them we calculated p value to show the relations by using two sided chi-square and log rank tests. We used GraphPad Prism version 6.00, (GraphPad Software, San Diego California USA) for all analysis.
2.2 Discovery and Validation of Autologous Antibodies for Behcet’s Disease 2.2.1 Patient and Healthy Controls
We used 50 patients with Behçet’s Disease and 50 healthy as a control for this research. For BD, ethics committee approval were approved from Istanbul Universitesi Deneysel Tip Arastirma Enstitusu, Istanbul, Turkey. For healthy controls ethics committee approval were approved from Bilkent University Health Center, Ankara, Turkey. Serums of controls and patients were stored at -80oC.
2.2.2 HisTagged Protein Expression and Purification
According to protein array screening results, the candidate biomarkers for BD were determined previously. We needed to produce them to validate ELISA. Clones of selected genes were obtained from Imagenes that was a manufacturer of protein arrays. To produce proteins E.coli that included plasmid was grown. We used streak plate technique to spread bacteria onto agar plate. After inoculation agar plates were incubated at 37°C for 16 hours. Next day, we selected a single colony by using pick from plate and inoculated in 10 ml LB with 25ug/ml of Kanamycin and 50ug/ml of Carbenicillin. A falcon that had 10 ml LB was were incubated at 37°C for 16 hours to grow bacteria. After 16 hours, we prepared 500 ml LB with antibiotics that were same concentrations of 10 ml LB in flask. We poured 10 ml LB into the flask that had 500 ml LB. We put flask to incubator that shake flask at 225 rpm and 37°C. E.coli with our plasmid were grown until OD600 reached to 0.6. If OD600 was equal to 0.6, we added 500 ul IPTG that was 1 mM to flask for induction of the gene to express our interested protein. The flask was continued the incubation at 37°C for 4 hours. After 4 hours,
11
the flask was put on ice for 5 minutes. We separated 500 ml LB into 2 bottles for
centrifugation at 3500 rpm for 20 min at +4°C. We discarded the supernatant from bottles, kept the pellet in bottler at -80°C. To purify our interested proteins we added Buffer A (Table 2.1) to bottles and resuspended the pellet by pipettor. Lysate was stirred with magnetic fish for 1 hour in a glass beaker at 300 rpm. We poured lysate to centrifuges tube for
centrifugation at 10000 rpm and 4oC for 20 min. We took the supernatant into falcon. A resin was added to supernatant and mixed resin with supernatant gently on shaker for 1 hour. We purified our interested proteins from supernatant by using columns and a peristaltic pump that was configurable about flow rate Ismatec (Model: Reglo MS-4/6). We poured mixture of resin with supernatant into column. We started to peristaltic pump to flow mixture into column. Also we adding to Buffer B, C, D and E (Table 2.1) to change the pH and purifying the interested protein from mixture. We collected protein to tubes and measured the pure protein’s concentration by using Invitrogen Qubit Fluorometer.
12 2.2.3 ELISA
Selected proteins for BD are produced and purified by performing HisTagged protein expression and purification experiments. For ELISA experiments Immulon 4HBX ELISA plates (Thermo Scientific, Lafayette, CO, USA) were used. For coating 100 ul pure protein that is 200 ng added into each well. Plates are incubated at +4°C for 16 hours. After 16 hours Plates were washed by using BioTek ELx405 ELISA washer that poured 300 ul of PBS-T to each well 6 times. For blocking the wells 5% non-fat dried milk in PBS-T was prepared and 200 ul poured into each well. Plates are incubated at +4°C for 16 hours again. After 16 hours again plates were washed. We diluted the each serum with 1:400 and 1:1600 dilution rates and added 100 ul serum in duplicate wells. Thus, one serum has 4 wells (2X1:400 and 2X1:1600) and level of antigen is calculated by averaged 4 wells of OD405 values. After adding serum plates were incubated at RT for 2 hours. After 2 hours plates were washed by using ELISA washer. Secondary antibody was Goat anti-human IgG Alkalene Phosphatase conjugated 2° Antibody (Jackson Immunoresearch). For ELISA experiments we diluted 1:5000 in blocking buffer and we added 100 ul to each well and again plates were incubated at RT for 2 hours. We washed plates after 2 hours. To get signal from well we used Thermo Scientific Pierce Phosphatase Substrate Kit provided us to get signal from well by reaction of PNPP with Alkaline Phosphatase that is in secondary antibody. For one ELISA plate we used 1 tablet of PNPP that was dissolved in 10 milliliters of 1x Diethanolamine Buffer and 100 ul of solution was added into each well. Plates were incubated at RT for 1 hour and to stop solution we added 100 ul of 2N NaOH solution into well. We measured OD405 values of well by using BioTek μQuant.
2.2.4 Western Blot
We used pure protein and loaded 500 ng into gel’s wells. 12% NuPAGE Bis-Tris Precast Gel (Invitrogen, Carlsbad, CA, USA) separated our loaded proteins. Also we used XCell SureLock Mini-Cell (Invitrogen, Carlsbad, CA, USA) as a vertical electrophoresis. We performed transferring proteins from the gels to Immobilon-P PVDF Membrane (Millipore). We used wet-transfer system. For blocking the membrane we prepared 5% non-fat dried milk powder in PBS-T that is blocking buffer and membrane was agitated in it at RT for 1 hour. Dilution ration of serum was 1:500. We diluted serum in blocking buffer. Membrane
13
incubated with serum solution at RT for 16 hours. After 16 hours we washed membranes and incubated in PBS-T for 5 minutes. This procedure was repeated three times. Our secondary antibody was Goat anti-human IgG Horseradish Peroxidase 2° Antibody (Jackson
Immunoresearch). We diluted antibody with 1:20000 in blocking buffer. We poured antibody solution into membrane that was incubated at RT for 1 hour. After incubation of secondary antibody, we washed membrane 3 times for 5 minutes. To detect signals from WB we used ECL Plus Western Blotting Detection Kit (GE Healthcare Amersham). To visualization of signals in membrane we used Vilber Lourmat Gel Documentation System.
2.2.5 Statistical Analysis
All correlation analysis were performed by using GraphPad Prism version 6.00, (GraphPad Software, San Diego California USA). We calculated pearson r and R square values. Error bar graphs were plotted by using GraphPad Prism version 6.00, (GraphPad Software, San Diego California USA). To ROC curve of proteins we entered ELISA OD405 values of controls and patients sera and we generated curves by using GraphPad Prism version 6.00.
2.3 Development of Methods for Evaluation of Protein Array Screening 2.3.1 Protein Array
For this study, we used protein array that are manufactured by Ima Genes Company. Protein array was included 180 proteins that were chosen by our group previously. The company spotted clones to PVDF membrane for our interested proteins. One PA has 15 units and each unit was consisted 12 duplicate clones and one reference point. Totally one unit had 25 spots. Moreover, clones were spotted to membrane according to certain 12 patterns (Figure 2.1).
14
Figure 2.1: Spotting Patterns of Clones and Example of Protein Array. In the left side of figure spotting patterns were showed. One screened PA was shown in right side of figure.
2.3.2 Protein Array Screening
One membrane included many protein array strips so we have to cut membrane to get one strip. We used paper cutting guillotine to cut membrane. After cutting, each array was wiped with towel to get rid of E.coli particles that were placed into membrane. To screening arrays we used WesternDot 625 Western Blotting kit (Invitrogen, Carlsbad, CA, USA). Kit included blocking and washing buffers, secondary antibody and Q-Dot conjugate. Custom PAs were incubated with blocking buffer at RT for 1 hour. Serum dilution ratio was 1:500 in washing buffer for PA screening. Each strip was agitated with serum at RT for 16 hours. PAs were washed with wash buffer 3 times for 5 minutes. Dilution ratio of Goat anti-human (H+L Specific) ZyMAX Grade (Invitrogen) 2°Antibody in wash buffer was 1:2000, and each strip
15
was incubated with secondary antibody solution at RT for 1 hour. PAs were washed again with same procedures. Dilution ratio of Q-Dot Conjugate was 1:1000 in blocking buffer and strips were incubated with Q-Dot at RT for 1 hour. After Q-Dot incubation, PAs were washed again by using washing buffer. After we washed PAs with double distilled water and we put the PAs onto Whatman paper to dry. We visualized PAs by using Vilber Lourmat Gel Documentation System that has StarLight module. The module provided us blue light that was necessary for getting signals from arrays.
2.3.3 Evaluation of Protein Array Screening
Previously, protein arrays were screened and evaluated by manual method, values of signals were generated by giving numbers that were between 1 and 4 (1 was lowest, 4 was highest signal). When we evaluated the protein arrays by using this method, new
autoantibodies were discovered. However, we tried to develop method to evaluate all signals and get the numeric values from signals. We used Adobe Photoshop CS6 program and established regulations for evaluation of signals. We gave a name for this method. Name of it is “Digital Spot Evaluation” (DSE). The rules are listed below;
1- Image of protein array is opened with Adobe Photoshop CS6
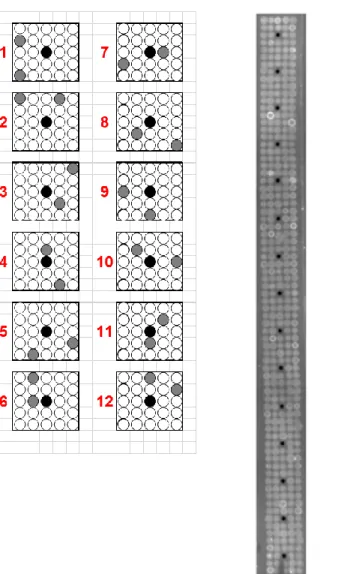
2- Zoom in picture in ways to see one ink dot that includes 24 clones and 1 black dot that is reference point (Figure 2.2)
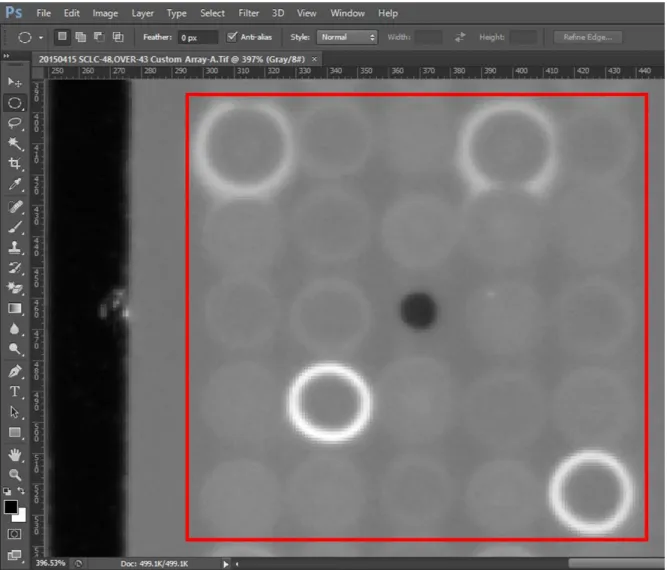
3- The mode of picture is chosen grayscale mode 4- Open the histogram window ( Figure 2.3)
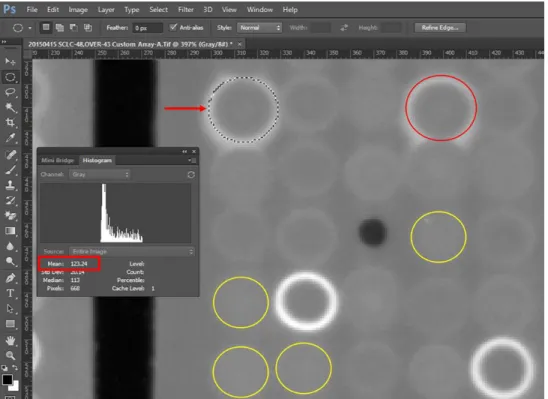
5- Draw the circle by using “Elliptical Marquee Tool” 6- Circles are tangent to signals ( Figure 2.4)
7- When circles are positioned on signals, histogram tools are showed the mean values of signals, they are recorded to Excel file
8- To measure signal values; take average the mean values of interested proteins’ signals that are duplicate in one ink dot, chose 4 smallest mean values and take average of them, subtract average of interested proteins’ signals from average of 4 smallest signals and divide fixed standard deviation value that is 2.5. Thus, we got numeric values from signals.
16
Figure 2.2: Protein Array Result. Picture of protein array screening result was opened by using Adobe Photoshop CS6. We zoom into PA picture till only one inkdot is seen in the screen. One inkdot was highlighted with red square.
17
Figure 2.3: Opening Histogram Window in Photoshop. Mode of picture was chosen grayscale and histogram window was opened. Mean, Std. Dev and Median values of selected regions were showed on histogram window that was highlighted with red square.
Figure 2.4: Mean Value of Signal. Our interested protein was showed with arrow and duplicate of signal was showed with red circle. By using tool we depicted circle for interested protein signals. On the histogram window mean value was calculated that was highlighted with red rectangular. We calculated mean value of the duplicate and smallest signals that were shown with yellow circles.
18
2.3.4 Calculation Panel Sensitivity and Specificity by using Monte Carlo Analysis
When we evaluated protein array screening results for interested proteins, we recorded values of signals for each serum and protein. To increase sensitivity and specificity values we created panel than includes 3 proteins. Thus, sensitivity and specificity values of panel were calculated by using Microsoft Excel Monte Carlo Simulation Add-In. It run 1.000.000 time random function in Excel and recorded. For each antigen one million cut off values were generated. Sensitivity and specificity were calculated for 1 million cut off values.
2.3.5 Statistical Analysis
GraphPad Prism version 6.00, (GraphPad Software, San Diego California USA) was utilized for plotting ROC curves of proteins and making pearson r correlation analysis.
19
CHAPTER 3
3 RESULTS
3.1 Correlation between Autologous Anti-SOX2 Antibody Response and Antigen Expression
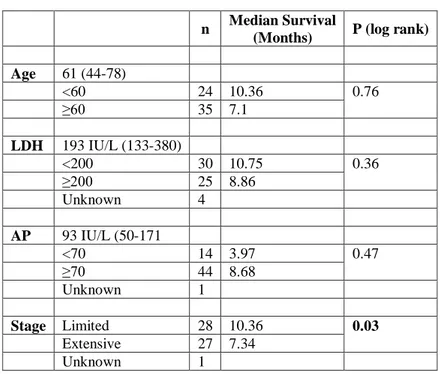
In this study, we tried to understand the relation between anti-SOX2 antibody responses and SOX2 expression in small cell lung cancer patients as about 10 to % 20 of SCLC patients have anti-SOX2 antibody responses. For this study, we used 251 samples that were 59 SCLC patients and 192 healthy controls. We show the clinical features of 59 SCLC patients in Table 3.1, as well as their show association with overall survival. According to Table 3.1, only stage was related with survival. Although median survival of patients that had extensive stage was 7.34 months, median survival of limited stage patients was 10.36 months. P value for stage was 0.03 that was statistically significant. Furthermore, other clinical
parameters did not correlate with overall survival.
Table 3.1: Clinical features of SCLC patients
n Median Survival
(Months) P (log rank) Age 61 (44-78) <60 24 10.36 0.76 ≥60 35 7.1 LDH 193 IU/L (133-380) <200 30 10.75 0.36 ≥200 25 8.86 Unknown 4 AP 93 IU/L (50-171 <70 14 3.97 0.47 ≥70 44 8.68 Unknown 1 Stage Limited 28 10.36 0.03 Extensive 27 7.34 Unknown 1
20
As in this study, anti-SOX2 antibody levels are detected by ELISA, consistency of assay results was highly critical. Therefore, before the startof all experiments, ELISA was optimized. First repeated ELISA experiments that were performed for anti-SOX2 antibody previously. We compared new ELISA data with previous data, and showed that new ELISA data correlated with ELISA data that was produced earlier (Figure 3.1). Also, we measured 59 patients’ anti-SOX2 autoantibody in sera twice. ELISA results were compared utilizing pearson’s r correlation analysis and r value of this analysis showed that ELISA repeats were highly consistent (Figure 3.2).
Figure 3.1: Comparison of Old ELISA Results with New ELISA Results. ELISA experiments that were performed previously were repeated for consistency. 40 sera from SCLC patients ELISA experiments were repeated. Correlation analysis was made for
comparison between old ELISA and new ELISA results. r value was 0.9616 and p value was < 0.0001.
Figure 3.2: Comparison of Repeated ELISA Experiments. For 59 sera from SCLC patients ELISA experiments were performed two times. Correlation analysis was made for
comparison between old ELISA and new ELISA results. r value was 0.9641 and p value was < 0.0001 ( See Appendix Table 1 for anti-SOX2 antibody raw data).
21
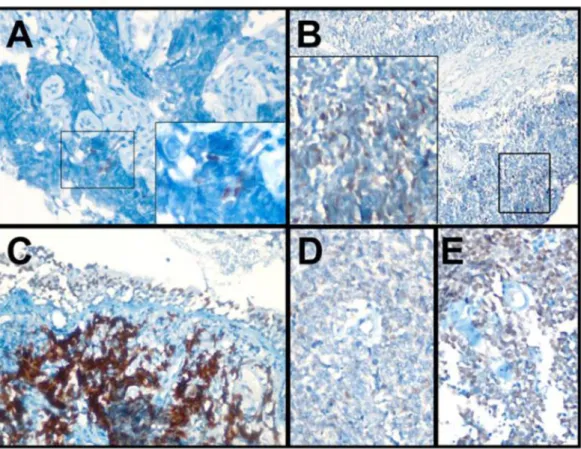
We stained 59 tumor samples that were collected from SCLC patients by utilizing immunohistochemistry. We have shown that 5 pictures from IHC stainings results for SOX2 in Figure 3.3. Seropositive patients’ tumor tissues stained strongly, but seronegative patients’ showed both strong, weak and no staining.
Figure 3.3: SOX2 Protein Staining by IHC. We used five tumor samples, three of them had SOX2 antibodies against SOX2 antigen, and two patients were seronegative. Figures of seropositive samples (4, 71, and 21) were A, B, and C; seronegative samples (72 and 89) were D and E respectively.
On the other hand, we performed ELISA experiments to measure the autologous anti-SOX2 antibody levels in 59 patients and 192 healthy serums. According to ELISA results for healthy serums, we calculated cut off value for anti-SOX2 antibody positivity. Our cut off value was 1.799 (mean+2SD) for seropositivity (See Appendix Table-2 and Table-3 for SCLC Patients and Controls ELISA Values for SOX2). Thus, number of positive sera was seventeen: 29% of SCLC patients (Table 3.2). In table 3.2 we show SOX2 staining frequency and intensity values by using immunohistochemistry results of SCLC patients. Also, we studied the correlation between SOX2 antibody response, SOX2 protein expression and
22
overall survival. However, antibody response and protein expression did not correlate with survival (Table 3.2).
Table 3.2: SOX2 antibody and protein staining characteristics of SCLC patients
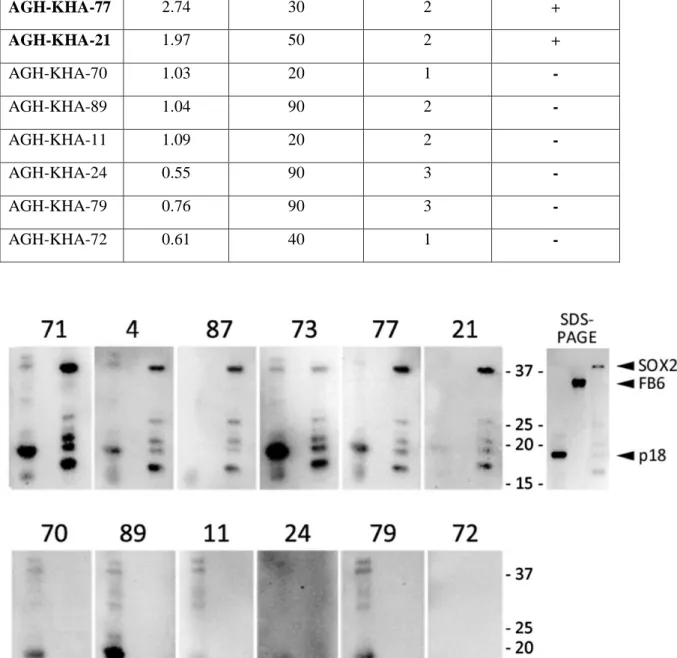
Also, we performed Western Blot experiments to confirm ELISA results. We chose 12 samples from SCLC patients. Half of them were seronegative, other half was seropositive. Although, we observed SOX2 antibodies in seropositive sera, no antibodies were detected by Western analysis in sere that were seronegative by ELISA (Table 3.3). For western blot analysis, we used p18 and FB6 proteins as a positive and negative control respectively (Figure 3.4).
n Median Survival
(Months) P (log rank)
SOX2 antibody <M+2SD 42 8.68 0.3
≥ M+2SD 17 7.85
SOX2 IHC intensity 0-1 25 7.39 0.98
2-3 30 10.65
SOX2 IHC frequency <5% 16 25.87 0.12
≥5% 39 7.39
SOX2 IHC frequency <20% 24 7.4 0.11
≥20% 31 7.86
SOX2 IHC frequency <40% 29 7.39 0.43
23
Table 3.3: 6 Seronegative and 6 Seropositive Patient ELISA, IHC and WB Results
Figure 3.4: SOX2 Western Blot Results for Confirmation of anti-SOX2 Antibody ELISA Data. 6 serums (71, 4, 87, 73, 77, and 21) that were seropositive and 6 serums (70, 89, 11, 24, 79, and 72) that were seronegative, were used for Western Blot Analysis. 3 proteins that were p18, FB6 and SOX2 were loaded to gel respectively. p18 protein (18 kD) was positive
control, FB6 protein (35 kD) was negative control.
Patients SOX2 Ab (OD405) SOX2 staining frequency SOX2 staining intensity WB Results AGH-KHA-71 3.77 5 2 + AGH-KHA-04 4 2 2 + AGH-KHA-87 2.93 5 2 + AGH-KHA-73 3.06 10 3 + AGH-KHA-77 2.74 30 2 + AGH-KHA-21 1.97 50 2 + AGH-KHA-70 1.03 20 1 - AGH-KHA-89 1.04 90 2 -AGH-KHA-11 1.09 20 2 -AGH-KHA-24 0.55 90 3 -AGH-KHA-79 0.76 90 3 -AGH-KHA-72 0.61 40 1
-24
We then the relation between SOX2 antibody seropositivity and clinical parameters that were age, LDH, AP and stage. We found that only stage was correlated with SOX2 seropositivity. In our study, we used serum samples from 59 patients of which 28 had limited stage, 27 patients had extensive stage disease and 4 patients were unknown. We observed that while 12 patients with limited stage were seropositive, only 5 patients with extensive stage were seropositive for SOX2 antibody, which was a statistically significant difference (p=0.05) (Table 3.4).
Table 3.4: SOX2 antibody correlates with clinical stage
In our study, tumor samples were stained for SOX2 by IHC to show correlation between SOX2 protein expression, clinical features and anti-SOX2 antibody responses. Although we did not find correlation between clinical features and the frequency and intensity SOX2 protein expression, we found a correlation between intensity of SOX2 expression and anti-SOX2 antibody responses as measured by ELISA (p=0.017) (Table 3.5). According to IHC results, SOX2 intensity score was 0-1 for 25 of 55 patients, 2-3 for 30 patients. 14 of 30 patients that had 2-3 intensity score had antibodies against SOX2. Therefore, we can say that high SOX2 expression causes production of antibodies against SOX2 antigen.
Table 1Table 3.5: SOX2 antibody correlates with intensity of SOX2 protein expression
SOX2 Ab p (chi.sq.) (-) (+) Stage Limited 16 12 0.05 Extensive 22 5 SOX2 Ab p (chi.sq.) (-) (+)
SOX2 IHC intensity 0-1 23 2 0.017 2-3 16 14
25
3.2 Discovery and Validation of Autologous Antibodies for Behcet’s Disease 3.2.1 Confirmation of Earlier ELISA Results for Behçet’s Disease
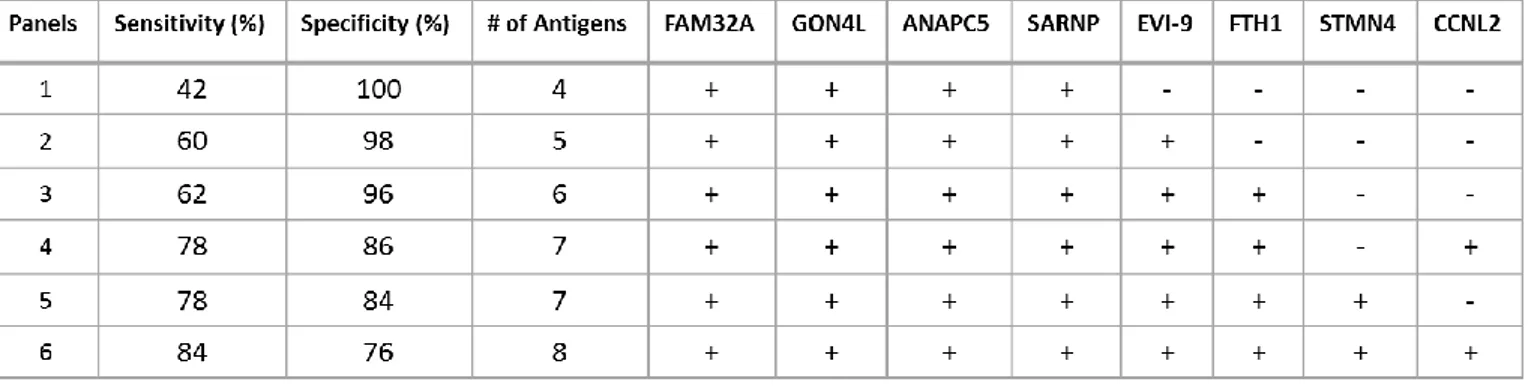
For discovery of autologous antibodies in Behçet’s Disease protein arrays had been screened. According to these results sensitivity and specificity values were calculated for every protein which were the best candidates for diagnosis of BD (Table3.6). Combination of these proteins were also evaluated for specificity to Behçet’s Disease patients (Table 3.7). Panels were critical because if proteins were evaluated with together, sensitivity and specificity values were higher than evaluation of proteins individually.
Table 3.6: Clones obtained after protein array screening evaluations
No Clone Gene info Protein Identity of clone
1 FB-1 FAM32A (NM_014077.2) 112 aa (1-112) of the 112 aa
2 FB-2 GON4L (NM_001037533.1) 205 aa (1953-2157) of the 2240 aa (24,7 kDa) 3 FB-4 ANAPC5 (NM_016237.4) 681 aa (75-755) of the 755 aa
4 FB-5 SARNP (NM_033082.3) 210 aa (1-210) of the 210 aa
5 FB-7 BCL11A (NM_138559.1) 150 aa (93-243) of the 243 aa (19,4 kDa) 6 FB-10 FTH1 (NM_002032.2) 153 aa (31-183) of the 183 aa
7 FB-12 STMN4 (NM_030795.2) 189 aa (28-216) of the 216 aa (21,8 kDa) 8 FB-13 CCNL2 (NM_030937.4) 255 aa (266-520) of the 520 aa (31,7 kDa)
Table 3.7: Sensitivity and Specificity values of the antigen panels generated with protein array screening evaluations by Monte Carlo Method
26
3.2.2 Performing ELISA Experiments for Selected Antigens
We performed ELISA using the previously defined antigens shown in Table 3.6 to measure seropositivity of antibodies in patients and controls’ sera. We repeated ELISA experiments two times and we analyzed our results and calculated r values for correlation (Figure 3.5, 3.6 and 3.7). These results showed that repeated experiments were consistent for every protein. Also all r values were bigger than 0.75 and p values were smaller than 0.0001.
Figure 3.5: Correlation Analysis Between Repeated Experiments for FB-1 and FB-2 proteins. Both Behçet’s Disease Patient and Healthy Sera were screened for FB-1 and FB-2 proteins two times. r and p values showed that repeated experiments were consistent.
27
Figure 3.6: Correlation Analysis Between Repeated Experiments for FB-5 and FB-7 proteins. Both Behçet’s Disease Patient and Healthy Sera were screened for FB-5 and FB-7 proteins two times. r and p values showed that repeated experiments were consistent.
28
Figure 3.7: Correlation Analysis Between Repeated Experiments for FB-10, FB-12 and FB-13 proteins. Both Behçet’s Disease Patient and Healthy Sera were screened for FB-10, FB-12 and FB-13 proteins two times. r and p values showed that repeated experiments were consistent
To validate valuable proteins that were selected from protein arrays for Behçet’s Disease we performed ELISA experiments. ELISA experiments were repeated two times (results are given in section 3.2.4). To confirm ELISA results, we perfomed Western Blot experiments (described below).
29 3.2.3 Western Blot and ELISA Comparison
We performed western blot experiment to compare and validate ELISA results. We chose two sera that are 8th and 42nd for validation experiments. According to ELISA results highest value of OD405 for FB-7 protein was observed by screening number 8th patient serum, also 8th patient had seropositivity for FB-12 protein. However, FB-2,10 and 13 proteins did not observed. Another serum was number 42nd patient serum that had highest OD405 value for FB-12 protein. 42nd patient did not have any positivity for other proteins. We performed western blot analysis and we showed that also positivity with western blot results (Figure 3.8).
Figure 3.8: Comparison of ELISA Experiments with Western Blot for 8th and 42nd sera. For western blot analysis we loaded p18, FB2, FB7, FB10, FB12 and FB13 proteins to well respectively. Graphs showing 5 proteins ELISA results for 2 serum.
30
3.2.4 Specificity and sensitivity of Behcet related antibodies as determined by ELISA
To determine sensitivity and specificity of the antibodies identified in PAs, we
evaluated ELISA results for all proteins tested and created ROC curves. At 100% specificity, none of the proteins were found to have sensitivity for diagnosing BD. Surprisingly, even at lower specificities, down to 80%, none of the proteins tested were sensitive for BD.
Therefore, even though these proteins had high sensitivity and specificity values according to PA results, we could not obtain similar results with ELISA data. Thus, we were not able to validate protein array results with ELISA experiments (Figure 3.9).
Figure 3.9: ROC Curves of 3 Proteins. For 3 proteins we created ROC curves by using ELISA results of Behçet and control sera
31
Figure 3.10: ROC Curves of 3 Proteins. For 3 proteins we created ROC curves by using ELISA results of Behçet and control sera
3.2.5 Re-evaluation of Protein Array Screening Data for the Identification of Additional New Proteins in Behçet’s Disease
As those antigens previously identified for BD were not validated for ELISA, we decided to select a second groups of antigens from PAs by re-evaluating the PA data. Six new antigens that showed promising sensitivity and specificity values for BD were selected (Table 3.8 and Table 3.9). All proteins were then tested by ELISA for sensitivity and specificity.
32
Table 3.8: Sensitivity and Specificity Values of Newly Selected Proteins
Table 3.9: Clones obtained after re-evaluation protein array screening
No Clone Gene info Protein Identity of clone
1 A-1 GRINL1A (NM_001285900.3) 309 aa (483-765) of the 765 aa 2 A-2 LPPR3 (NM_024888.2) 414 aa (333-746) of the 746 aa 3 A-3 ING4 (NM_001127582.1) 249 aa of the 249 aa
4 A-4 ANKS6 (NM_173551.3) 134 aa (406-541) of the 870 aa 5 A-5 FBX044 (NM_001014765.1) 109 aa of the 109 aa
6 A-6 STUB1 (NM_005861.3) 303 aa of the 303 aa
Sensitivity (%) Specificity (%) GRINL1A 34 96 LPPR3 6 94 ING4 16 98 ANKS6 16 98 FBXO44 4 100 STUB1 4 100
33 3.2.6 ELISA Results of New Proteins
We then performed ELISA experiments using the 6 new proteins, repeating the experiments twice. Repeated experiments were highly concordant as shown in Figures 3.11 and 3.12.
Figure 3.11: Correlation Analysis Between Repeated Experiments for A-1, A-2 and A-3 proteins. Both Behçet’s Disease Patient and Healthy Sera were screened for 1, 2 and A-3 proteins two times. r and p values showed that repeated experiments were consistent
34
Figure 3.12: Correlation Analysis Between Repeated Experiments for A-4, A-5 and A-6 proteins. Both Behçet’s Disease Patient and Healthy Sera were screened for 4, 5 and A-6 proteins two times. r and p values showed that repeated experiments were consistent
35
3.2.7 ROC Curves for Newly Selected Proteins ROC analysis for them (Figure 3.13)
Figure 3.13: ROC Curves of 6 Proteins. For 6 proteins we created ROC curves by using ELISA results of Behçet and control sera
The sensitivity, specificity analysis of these proteins showed that anti-ING4 antibodies could identify BD patients with a 30% sensitivity at 96% specificity, and 40% sensitivity at 90% specificity. However, none of the other antigens seem useful by this ELISA assay.
36
3.2.8 ELISA Values for Subgroups of Behçet’s Disease
BD subtypes are clinically distinct. We therefore, hypothesized that some of the antigens previously identified, could be eliciting subtype specific responses. We therefore analyzed Mucocutaneous, Arthritis, Uveitis and Vascular subtypes of BD separately. We analyzed ELISA experiments according to subtypes and we tried to understand which protein could be specific for which subtypes (Figure 3.14 and 3.15).
Figure 3.14: ELISA Values for Subgroup of BD. Subgroups of BD are Mucocutaneous, Arthritis, Uveitis and Vascular. For 6 protein ELISA values of subgroups were shown.
37
Figure 3.15: ELISA Values for Subgroup of BD. Subgroups of BD are Mucocutaneous, Arthritis, Uveitis and Vascular. For 6 protein ELISA values of subgroups were shown.
We made t-test analysis to show which protein could be specific for subtypes. We compared ELISA values of subgroups with healthy ELISA results for each protein. FB-2 protein is candidate biomarker for Arthritis patients, p value is 0.01. It means statistically significant.
38
Also A-3 protein is candidate biomarker for Mucocutaneous, Arthritis and Uveitis, p values of them are 0.004, 0.003 and 0.01 respectively.
3.3 Development of Methods for Evaluation of Protein Array Screening 3.3.1 Repeating Protein Array Screening for Consistency
The data I summarized until now indicates that the majority of seropositive proteins as defined by PAs cannot be validated by ELISA. Although this is disappointing, one possibility is that PA based seroreactivity analysis is more sensitive than ELISA and Western analysis. To evaluate this possibility, I wanted to develop a method by which the evaluation of PAs would generate numeric data (as opposed to arbitrarily generated positivity, assigned by visual inspection). This would then make it possible to determine cut-off values by which positivity could be better defined. The DSE tool was thus developed. To determine if DSE based results were reproducible and therefore trustable, we chose a single patient serum (from a patient with ovarian cancer) and used it to screen 5 identical arrays on 5 different days. We calculated signal values by DSE, and made Pearson’s r correlation analysis to show
consistency (Figure 3.16 and Table 3.10). These results indicate that, with the exception of one analysis (between the 1st and the 4th experiment) all experiments generated highly similar data, as Pearson’s r values were for all higher than 0.75 and in most, and up to 0.99,
suggesting the PA generated serorectivity pattern is not an artifact, but in fact, the assay is likely very reliable.
Figure 3.16: Protein Array Screening Result of Ovary Cancer Serum. We screened protein array with same serum on different days. We performed this experiment 5 times.
39
Table 3.10: Pearson’s r values of Repeat Experiments
3.3.2 Re-evaluation of Protein Array Screening for Antibodies in SCLC and Comparison with ELISA results
Since we were able to clearly show that DSE based data was reproducible, we decided to compare PA based data to ELISA, for antigens which we knew from previous experiments that were seropositive when tested both by PA as well as ELISA. We hypothesized that if PA based, and DSE generated data is more sensitive, that we would be able to improve
sensitivity/specificity using this approach. For this purpose we selected 3 antigens which had been identified by PA analysis of SCLC sera and which were clearly seroreactive with ELISA.. The proteins that were selected from SCLC protein array screening results were SOX2, p53 and POLB. These proteins have stronger signals in protein array also it is known that SOX2 and p53 antibodies were elicited in SCLC: These proteins were validated both by ELISA and Western Blot with modest sensitivity and specificity values. Indeed, were were able to greatly improve sensitivity and specificity values for all three antigens compared to ELISA data, by utilizing PA analysis with DSE (Figure 3.17). At 100% specificity, sensitivity for SOX2 antibodies increased from %32 to %42, and at 90% specificity, we observed an increase from 36% to 66%. Overall, the AUC increased from 0.65 to 0.89. For p53 antibodies, we observed a dramatic improvement of sensitivity at 80% specificity, (an increase from 25% to 70%). The AUC also increased from 0.57 to 0.78. Similarly for POL4 we observed an increase in sensitivity at 100% specificity from 2% to 20% accompanied by a strong improvement of the AUC, from 0.53 to 0.72. These results cumulatively show that the evaluation of PAs by the DSE tool is capable of generating highly useful data that can be utilized for the improvement of antibody-based diagnostic tools.
40
Figure 3.17: ROC Curves of SOX2, p53, POLB Proteins. For SOX2, p53 and POLB 50 SCLC patients and controls’ protein array screenings were evaluated by using DSE. We created ROC curves. Also, we generated ROC curves by utilizing ELISA results
The increase in sensitivity and specificity values were also observed when proteins were evaluated together as a panel (Figure 3.18).