© 2016 by the Texas Heart ® Institute, Houston
Epicardial Adipose
Tissue Thickness
Is an Independent Predictor of Critical and Complex
Coronary Artery Disease by Gensini and S
yntaxScores
Epicardial adipose tissue thickness is associated with the severity and extent of athero-sclerotic coronary artery disease. We prospectively investigated whether epicardial adipose tissue thickness is related to coronary artery disease extent and complexity as denoted by Gensini and Syntax scores, and whether the thickness predicts critical disease.
After performing coronary angiography in 183 patients who had angina or acute myocar-dial infarction, we divided them into 3 groups: normal coronary arteries, noncritical disease (≥1 coronary lesion with <70% stenosis), and critical disease (≥1 coronary lesion with ≥70% stenosis). We used transthoracic echocardiography to measure epicardial adipose tissue thickness, then calculated Gensini and Syntax scores by reviewing the angiograms.
Mean thicknesses were 4.3 ± 0.9, 5.2 ± 1.5, and 7.5 ± 1.9 mm in patients with normal coronary arteries, noncritical disease, and critical disease, respectively (P <0.001). At pro-gressive thicknesses (<5, 5–7, and >7 mm), mean Gensini scores were 4.1 ± 5.5, 19.8 ± 15.6, and 64.9 ± 32.4, and mean Syntax scores were 4.7 ± 5.9, 16.6 ± 8.5, and 31.7 ± 8.7,
re-spectively (both P <0.001). Thickness had strong and positive correlations with both scores (Gensini, r =0.82, P <0.001; and Syntax, r =0.825, P <0.001). The cutoff thickness value to
predict critical disease was 5.75 mm (area under the curve, 0.875; 95% confidence interval, 0.825–0.926; P <0.001).
Epicardial adipose tissue thickness is independently related to coronary artery disease extent and complexity as denoted by Gensini and Syntax scores, and it predicts critical
coro-nary artery disease. (Tex Heart Inst J 2016;43(1):29-37)
E
picardial adipose tissue (EAT), found between the visceral pericardium andmyocardium, is a specialized visceral adipose tissue in which the coronary
arteries are embedded.1 The lack of an anatomic barrier between EAT and
the myocardium enables them to share microcirculation. Epicardial adipose tissue produces numerous proinflammatory and proatherogenic mediators that might pro-mote the initiation and progression of coronary atherosclerosis,1,2 including subclinical atherosclerosis.3 High EAT volume has been shown to increase the prognostic value of coronary artery calcium score in predicting future cardiac events.4 The thickness and volume of EAT are related to the severity and extent of atherosclerotic coronary artery disease (CAD)5-9; however, some investigators have found no significant association between EAT volume10 or thickness11 and CAD presence or severity. Although the relationship between EAT and the severity and extent of CAD has been extensively investigated,5-11 comparatively few studies pertain to the association of EAT with CAD complexity.12,13 The complexity of CAD, an important factor in clinical decision-making, is typically evaluated by means of the Syntax score.14,15 Another important factor in choosing treatment approaches is the presence of critical lesions,16 which potentially qualifies the patient for interventional treatment. In addition, we used the Gensini score to evaluate the extent and severity of CAD.
In this study, we tested the hypotheses that greater EAT thickness identifies patients with more-complex CAD, and that greater EAT thickness predicts the presence of critical lesions that potentially warrant interventional treatment.
Patients and Methods
We screened 221 consecutive patients who had no histories of myocardial revascular-ization and who had undergone coronary angiography from June through October 2012 because of clinical diagnoses of CAD. The prospective study was performed
Clinical
Investigation
Aycan Fahri Erkan, MD, PhD Asli Tanindi, MD
Sinan Altan Kocaman, MD Murat Ugurlu, MD Hasan Fehmi Tore, MD
Key words: Adipose tissue/ pathology/physiology/ultra-sonography; atherosclerosis/ physiopathology; coronary artery disease/diagnosis; echocardiography; fore-casting; patient selection; predictive value of tests; pro-spective studies; sensitivity and specificity
From: Department of Car-diology (Drs. Erkan, Tanindi, Tore, and Ugurlu), Ufuk Uni-versity Faculty of Medicine, 06520 Ankara; and Depart-ment of Cardiology (Dr. Kocaman), Ankara Guven Hospital, 06700 Ankara; Turkey
Address for reprints: Aycan Fahri Erkan, MD, PhD, Department of Cardiology, Ufuk University Faculty of Medicine, Dr. Ridvan Ege Hospital, Cukurambar 06520, Ankara, Turkey
E-mail:
in a single tertiary center. We excluded 38 patients for the following reasons: forms of CAD other than angina pectoris or acute myocardial infarction (MI), includ-ing coronary vasospasm, coronary ectasia, or turbulent or slow flow (n=17); pericardial effusion (n=4); severe valvular pathologic conditions (n=5); poor echocar-diographic images (n=3); or refusal to give written in-formed consent (n=9). The clinical presentations of the remaining 183 patients were as follows: 116 patients had stable angina pectoris, 34 patients had unstable angina pectoris, and 33 patients had acute MI. Of these last, 16 presented with ST-segment-elevation MI and 17 with non-ST-segment-elevation MI.
This study was conducted in accordance with the recommendations of the Declaration of Helsinki on Biomedical Research involving human subjects. The study protocol was approved by our institutional eth-ics committee. Written informed consent was obtained from each participant.
Baseline characteristics, including medical history, anthropometric measurements, risk factors for ath-erosclerosis, and medications, were recorded for each patient (Table I). Before performing coronary angiog-raphy, we obtained blood samples for complete blood
counts with use of a Cell-Dyn® 3700 (Abbott
Labora-tories; Abbott Park, Ill), and for biochemistry and lipid
values with use of a UniCel® DxC 800 Synchron®
Clinical System (Beckman Coulter, Inc.; Brea, Calif ). Echocardiography
All echocardiographic measurements were performed by the same cardiologist, who was blinded to the pa-tients’ clinical information. A Vivid 7® cardiac ultra-sound system (GE Medical Systems; Horten, Norway) with a 2.5- to 3.5-MHz transducer was used before coronary angiography was performed. Parasternal and apical views were obtained in accordance with the rec-ommendations of the American Society of Echocar-diography.17 The EAT thickness was measured from the standard parasternal long-axis view on the free wall of the right ventricle, perpendicular to the aortic annulus at end-systole.18 The EAT was identified as the echo-free space between the outermost border of the myocardium and the visceral layer of the pericardium. The thickest point of the EAT was measured in each of 3 cycles, and the average value was calculated.
Coronary Angiography and
Evaluation of Coronary Artery Disease
Selective coronary angiography was performed via the femoral approach by means of the Judkins technique
and with use of an Innova® angiographic system (GE
Healthcare; Wausheka, Wisc). Multiple views were obtained in all patients, including the left anterior de-scending coronary artery (LAD) and left circumflex coronary artery (LCx) in at least 4 projections, and the
right coronary artery in at least 2 projections. Coro-nary angiograms were recorded in Digital Imaging and Communications in Medicine (DICOM) format. We used the Syntax score to evaluate the complexity
of CAD. The Syntax score, developed to better predict
the risks of percutaneous coronary intervention (PCI) and coronary artery bypass grafting,14 is also a surrogate of disease complexity.15 The location of the lesions and their impact on blood flow, the degree of vessel stenosis, lesion classifications, and diameter and calcification of the vessel are important factors that affect the technical feasibility of performing PCI. The Syntax score takes
into account the functional impact of the coronary cir-culation and all anatomic aspects, including bifurcation, trifurcation lesions, calcification, tortuosity, thrombus, and occlusions.19 Each coronary lesion resulting in a lu-minal stenosis >50% in vessels ≥1.5 mm in diameter is separately scored and summed to obtain the overall Syntax score. We calculated the Syntax score, which
is also related to cardiovascular outcomes, by using the Web-based calculator at the http://www.syntaxscore. com/ internet address.
We evaluated the extent and severity of CAD by using the Gensini score.20 In this system, a severity score is derived for each coronary stenosis on the basis of the degree of luminal narrowing and its topographic importance. Reductions in luminal diameter of 1% to 25%, 26% to 50%, 51% to 75%, 76% to 90%, 91% to 99%, and 100% (occlusion) are scored as 1, 2, 4, 8, 16, and 32, respectively. Each principal vascular segment is assigned a multiplier that represents its functional importance in maintaining myocardial blood supply. Multipliers are 5 for the left main coronary artery; 2.5 for the proximal segments of the LAD and LCx; 1.5 for the mid segment of the LAD; 1 each for the right coro-nary artery, distal segment of the LAD, posterolateral artery, and obtuse marginal branch; and 0.5 for other segments.
All angiographic scoring was performed by 2 inter-ventional cardiologists who were blinded to the echo-cardiographic measurements and clinical data. The
Gensini and Syntax scores for each angiogram were
obtained by averaging the scores assigned by these 2 observers. In case of discrepancy between the observers, the angiogram was rescored.
Critical CAD has been defined as ≥70% stenosis in a coronary artery.16 Accordingly, we classified the study population into 3 angiographic groups: individuals with normal coronary arteries (NCA), patients with non-critical CAD (<70% stenosis in ≥1 coronary artery), and patients with critical CAD (≥70% stenosis in ≥1 coronary artery).
Statistical Analysis
Continuous variables were expressed as mean ± SD; categorical variables were def ined as numbers and
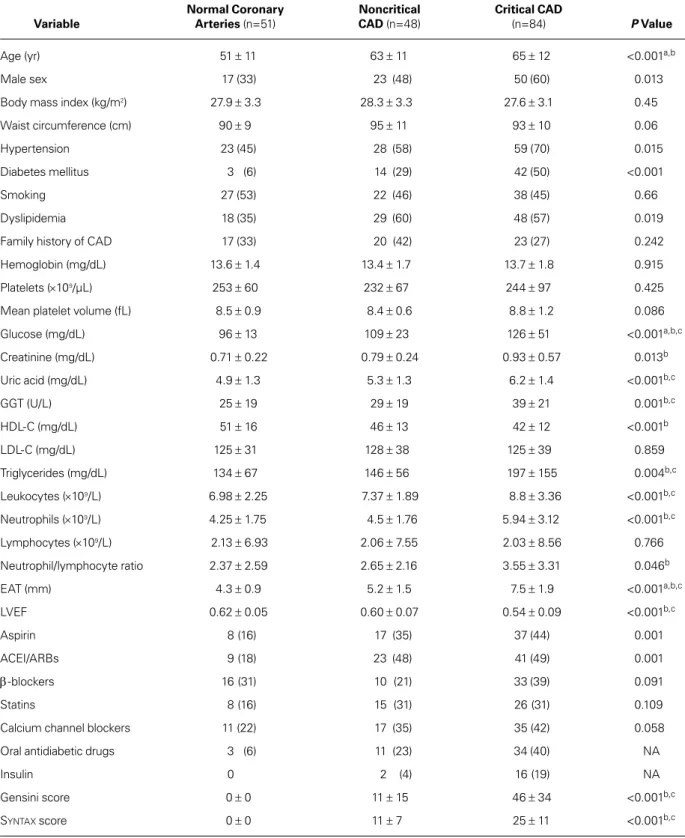
TABLE I. Baseline Characteristics in the Study Population (N=183)
Normal Coronary Noncritical Critical CAD
Variable Arteries (n=51) CAD (n=48) (n=84) P Value
Age (yr) 51 ± 11 63 ± 11 65 ± 12 <0.001a,b
Male sex 17 (33) 23 (48) 50 (60) 0.013
Body mass index (kg/m2) 27.9 ± 3.3 28.3 ± 3.3 27.6 ± 3.1 0.45
Waist circumference (cm) 90 ± 9 95 ± 11 93 ± 10 0.06
Hypertension 23 (45) 28 (58) 59 (70) 0.015
Diabetes mellitus 3 (6) 14 (29) 42 (50) <0.001
Smoking 27 (53) 22 (46) 38 (45) 0.66
Dyslipidemia 18 (35) 29 (60) 48 (57) 0.019
Family history of CAD 17 (33) 20 (42) 23 (27) 0.242
Hemoglobin (mg/dL) 13.6 ± 1.4 13.4 ± 1.7 13.7 ± 1.8 0.915
Platelets (×109/µL) 253 ± 60 232 ± 67 244 ± 97 0.425
Mean platelet volume (fL) 8.5 ± 0.9 8.4 ± 0.6 8.8 ± 1.2 0.086
Glucose (mg/dL) 96 ± 13 109 ± 23 126 ± 51 <0.001a,b,c Creatinine (mg/dL) 0.71 ± 0.22 0.79 ± 0.24 0.93 ± 0.57 0.013b Uric acid (mg/dL) 4.9 ± 1.3 5.3 ± 1.3 6.2 ± 1.4 <0.001b,c GGT (U/L) 25 ± 19 29 ± 19 39 ± 21 0.001b,c HDL-C (mg/dL) 51 ± 16 46 ± 13 42 ± 12 <0.001b LDL-C (mg/dL) 125 ± 31 128 ± 38 125 ± 39 0.859 Triglycerides (mg/dL) 134 ± 67 146 ± 56 197 ± 155 0.004b,c Leukocytes (×109/L) 6.98 ± 2.25 7.37 ± 1.89 8.8 ± 3.36 <0.001b,c Neutrophils (×109/L) 4.25 ± 1.75 4.5 ± 1.76 5.94 ± 3.12 <0.001b,c Lymphocytes (×109/L) 2.13 ± 6.93 2.06 ± 7.55 2.03 ± 8.56 0.766 Neutrophil/lymphocyte ratio 2.37 ± 2.59 2.65 ± 2.16 3.55 ± 3.31 0.046b EAT (mm) 4.3 ± 0.9 5.2 ± 1.5 7.5 ± 1.9 <0.001a,b,c LVEF 0.62 ± 0.05 0.60 ± 0.07 0.54 ± 0.09 <0.001b,c Aspirin 8 (16) 17 (35) 37 (44) 0.001 ACEI/ARBs 9 (18) 23 (48) 41 (49) 0.001 β-blockers 16 (31) 10 (21) 33 (39) 0.091 Statins 8 (16) 15 (31) 26 (31) 0.109
Calcium channel blockers 11 (22) 17 (35) 35 (42) 0.058
Oral antidiabetic drugs 3 (6) 11 (23) 34 (40) NA
Insulin 0 2 (4) 16 (19) NA
Gensini score 0 ± 0 11 ± 15 46 ± 34 <0.001b,c
Syntax score 0 ± 0 11 ± 7 25 ± 11 <0.001b,c
ACEI/ARBs = angiotensin-converting enzyme inhibitors/angiotensin II receptor blockers; CAD = coronary artery disease; EAT = epicar-dial adipose tissue; GGT = gamma-glutamyltransferase; HDL-C = high-density-lipoprotein cholesterol; LDL-C = low-density-lipoprotein cholesterol; LVEF = left ventricular ejection fraction; NA = not available
aDifference between Normal and Noncritical bDifference between Normal and Critical cDifference between Noncritical and Critical
percentages. Data were tested for normal distribution with use of the Shapiro-Wilk test. For continuous ables, mean values were compared by analysis of vari-ance among different groups. Homogeneity of varivari-ance underwent the Levene test, and post hoc analysis was performed with either the Tukey test or Dunnett’s T3 test, whichever was appropriate. The c2 test was used to compare categorical variables among the groups. All correlation analyses were performed with use of the Pearson or Spearman correlation test, whichever was appropriate. To determine the independent predictors of critical CAD, univariate linear regression analysis was performed first; then, multivariate linear regression analysis was performed with the independent variables that were found to be significant correlates in the uni-variate analysis. An optimal cutoff value of EAT thick-ness for the detection of critical CAD was determined by means of receiver operating characteristics (ROC) analysis, and area under the curve (AUC) was calcu-lated. All tests of significance were 2-tailed. Statistical significance was defined as P <0.05. We used SPSS sta-tistical software version 20.0 for Windows (IBM Cor-poration; Armonk, NY) for all statistical calculations.
Results
Patients with critical and noncritical CAD were older and were more likely male than were individuals with NCA. There were no significant differences between the groups with respect to anthropometric measure-ments, including body mass index (BMI) and waist circumference (WC). There was no significant associa-tion between BMI and EAT after adjustment for Gen-sini and Syntax scores (adjusted r =0.13; P=0.082);
however, we found a weak yet significant correlation between WC and EAT after adjustment for Gensini and Syntax scores (adjusted r =0.196; P=0.006).
Mean EAT thickness was 4.3 ± 0.9 mm in the NCA group, 5.2 ± 1.5 mm in the noncritical-CAD group, and 7.5 ± 1.9 mm in the critical-CAD group (P <0.001). Upon post hoc analysis, differences were also significant for each pairwise comparison (Table I).
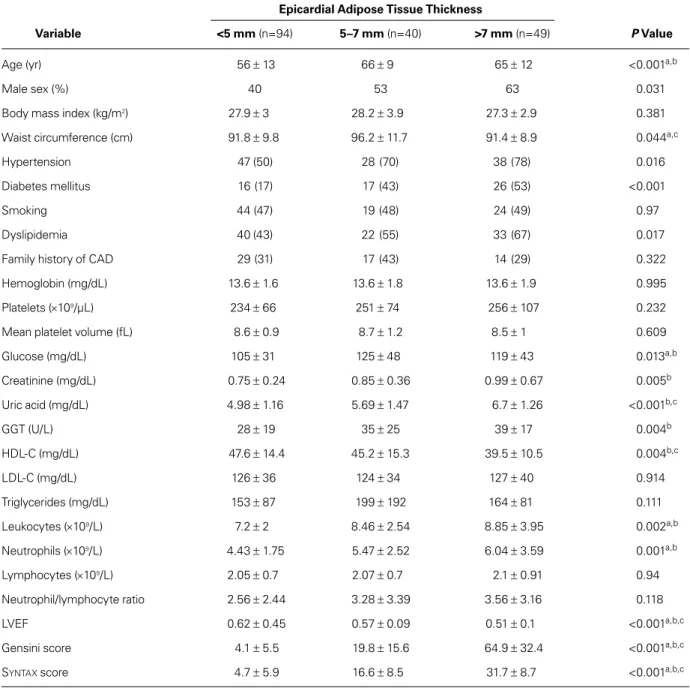
Table II shows changes in values at different EAT thickness strata. As EAT thickness increased, so did Syntax score and Gensini score: for EAT thicknesses
<5 mm, 5–7 mm, and >7 mm, the mean Syntax scores
were 4.7 ± 5.9, 16.6 ± 8.5, and 31.7 ± 8.7, respectively; and the mean Gensini scores were 4.1 ± 5.5, 19.8 ± 15.6, and 64.9 ± 32.4, respectively (both P <0.001). Upon post hoc analysis, all differences with respect to Gensini and Syntax scores among subgroups were also
signifi-cant (Table II).
We found a significant and positive correlation be-tween EAT thickness and the extent of CAD, as evi-denced by the Gensini score (r =0.82; P <0.001) (Fig. 1). A similarly strong correlation existed between EAT
thickness and CAD complexity, as evidenced by the Syntax score (r =0.825; P <0.001) (Fig. 2).
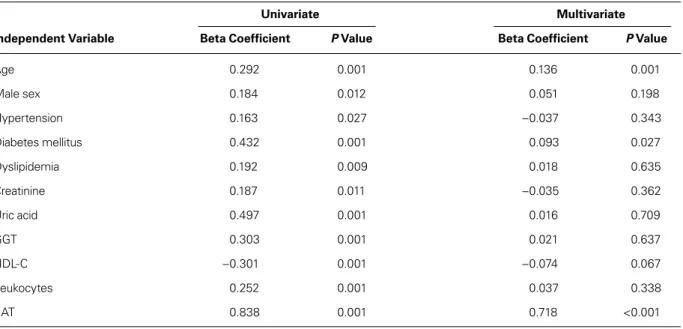
Multivariate analyses (Tables III and IV) and ROC analysis revealed that EAT thickness can be used as an independent predictor of critical CAD. The optimal cutoff EAT thickness value to predict critical CAD was 5.75 mm (AUC=0.875; 95% confidence interval [CI], 0.825–0.926; P <0.001) (Fig. 3). We found a sensitiv-ity of 77%, a specificsensitiv-ity of 83%, a positive predictive value of 48%, a negative predictive value of 95.8%, and 82.4% diagnostic accuracy of the cutoff value of 5.75 mm to predict critical CAD.
Discussion
We found that EAT thickness measured by means of echocardiography is independently associated with
the complexity of CAD that is evidenced by the Syn
-tax score. Although previous study results linked EAT
to CAD,5-9 our findings highlight the association
be-tween echocardiographic EAT thickness and the Syn
-tax score, which incorporates lesion characteristics and
functional impact and thus denotes CAD complexity. We propose that EAT thickness is of value in the early identification of patients who have complex CAD. This knowledge might prompt clinicians to choose more ag-gressive prevention and treatment strategies or to refer these patients for earlier diagnostic cardiac catheteriza-tion.
In addition, we found significant differences among the 3 EAT thickness strata in terms of traditional car-diovascular risk factors, including older age, diabetes mellitus, hypertension, and serum HDL cholesterol levels. These observations support earlier findings: age is a strong independent correlate of EAT,21 and EAT is significantly thicker in diabetic subjects.22 (Moreover, Iacobellis and colleagues23 identified a significant cor-relation of EAT thickness with fasting plasma glucose in nondiabetic individuals.) Hypertension (especially diastolic blood pressure) and serum HDL cholesterol levels have been well correlated to EAT thickness.24 Furthermore, we observed a significant difference in terms of WC, but not BMI, across the EAT thickness strata. The weak yet significant correlation between WC and EAT agrees with previous data concerning EAT thickness that significantly correlated with WC but not with BMI.24 This finding highlights the importance of visceral adiposity but not total adiposity with respect to cardiovascular risk. Thickness in EAT is also associated with metabolic syndrome,25 insulin resistance,26 endo-thelial dysfunction,27 and overt atherosclerotic CAD.28 The influence of conventional cardiovascular risk factors on EAT thickness is well established; regardless, EAT has additional predictive value over these risk factors in regard to the presence of critical and complex CAD, ac-cording to our multivariate regression analysis.
Clinical observations suggest that proximal portions of the coronary arteries are more deeply embedded in epicardial fat than are distal portions and are thus more susceptible to atherosclerosis. This has been attributed to the relative paucity of periadventitial adipose tissue, which is in continuity with the epicardial adipose tis-sue.29 Vela and associates30 pointed out the importance
of periadventitial adipose tissue in the development of atherosclerosis, highlighting the aggregation of macro-phages in this tissue.
Epicardial adipose tissue produces miscellaneous pro-inflammatory and proatherogenic mediators, including interleukin-6, interleukin-1, tumor necrosis factor-α, monocyte chemoattractant protein-1, plasminogen TABLE II. Comparison of Clinical and Laboratory Values by Epicardial Adipose Tissue Thickness Measurement
Epicardial Adipose Tissue Thickness
Variable <5 mm (n=94) 5–7 mm (n=40) >7 mm (n=49) P Value
Age (yr) 56 ± 13 66 ± 9 65 ± 12 <0.001a,b
Male sex (%) 40 53 63 0.031
Body mass index (kg/m2) 27.9 ± 3 28.2 ± 3.9 27.3 ± 2.9 0.381
Waist circumference (cm) 91.8 ± 9.8 96.2 ± 11.7 91.4 ± 8.9 0.044a,c
Hypertension 47 (50) 28 (70) 38 (78) 0.016
Diabetes mellitus 16 (17) 17 (43) 26 (53) <0.001
Smoking 44 (47) 19 (48) 24 (49) 0.97
Dyslipidemia 40 (43) 22 (55) 33 (67) 0.017
Family history of CAD 29 (31) 17 (43) 14 (29) 0.322
Hemoglobin (mg/dL) 13.6 ± 1.6 13.6 ± 1.8 13.6 ± 1.9 0.995
Platelets (×109/µL) 234 ± 66 251 ± 74 256 ± 107 0.232
Mean platelet volume (fL) 8.6 ± 0.9 8.7 ± 1.2 8.5 ± 1 0.609
Glucose (mg/dL) 105 ± 31 125 ± 48 119 ± 43 0.013a,b Creatinine (mg/dL) 0.75 ± 0.24 0.85 ± 0.36 0.99 ± 0.67 0.005b Uric acid (mg/dL) 4.98 ± 1.16 5.69 ± 1.47 6.7 ± 1.26 <0.001b,c GGT (U/L) 28 ± 19 35 ± 25 39 ± 17 0.004b HDL-C (mg/dL) 47.6 ± 14.4 45.2 ± 15.3 39.5 ± 10.5 0.004b,c LDL-C (mg/dL) 126 ± 36 124 ± 34 127 ± 40 0.914 Triglycerides (mg/dL) 153 ± 87 199 ± 192 164 ± 81 0.111 Leukocytes (×109/L) 7.2 ± 2 8.46 ± 2.54 8.85 ± 3.95 0.002a,b Neutrophils (×109/L) 4.43 ± 1.75 5.47 ± 2.52 6.04 ± 3.59 0.001a,b Lymphocytes (×109/L) 2.05 ± 0.7 2.07 ± 0.7 2.1 ± 0.91 0.94 Neutrophil/lymphocyte ratio 2.56 ± 2.44 3.28 ± 3.39 3.56 ± 3.16 0.118 LVEF 0.62 ± 0.45 0.57 ± 0.09 0.51 ± 0.1 <0.001a,b,c
Gensini score 4.1 ± 5.5 19.8 ± 15.6 64.9 ± 32.4 <0.001a,b,c
Syntax score 4.7 ± 5.9 16.6 ± 8.5 31.7 ± 8.7 <0.001a,b,c
CAD = coronary artery disease; GGT = gamma-glutamyltransferase; HDL-C = high-density-lipoprotein cholesterol; LDL-C = low- density-lipoprotein cholesterol; LVEF = left ventricular ejection fraction
aDifference between Normal and Noncritical bDifference between Normal and Critical cDifference between Noncritical and Critical
Unless otherwise stated, data are presented as mean ± SD or as number and percentage. P <0.05 was considered statistically signifi-cant.
activator inhibitor-1, angiotensinogen, leptin, resistin, and visfatin.31-33 On the other hand, adiponectin, which exerts an antiatherogenic effect via the improvement of endothelial function and the mitigation of inflamma-tion, has been shown to be underexpressed in the EAT of patients who have CAD.33
In 2014, Yanez-Rivera and colleagues11 found no sig-nificant relationship between echocardiographic EAT thickness and the angiographic severity of CAD. This discrepancy might have resulted from the method used to evaluate CAD severity. Whereas those investigators11 used the number of stenotic major coronary arteries as
the surrogate of CAD severity, we used the Gensini score—a more quantitative method. Furthermore, we evaluated CAD complexity by using Syntax scores and
correlating those values with EAT thickness.
Gökdeniz and associates12 studied the relationship of EAT thickness to the complexity of CAD in non-diabetic subjects. They found EAT thickness to be significantly correlated to Syntax score (r =0.629; P
<0.001). They also determined a cutoff value of 5-mm EAT thickness for the prediction of an
intermediate-to-high Syntax score (AUC=0.851; 95% CI, 0.775–0.91)
at a specificity of 92.2% and a sensitivity of 77.4%. This cutoff value is close to ours (5.75 mm) for critical-lesion prediction. However, those investigators12 studied nondiabetic patients only, whereas we identified the re-lationship of EAT thickness with CAD complexity in a diabetic and nondiabetic population.
In 2014, Wang and co-authors34 reported an associa-tion of echocardiographically determined EAT thick-ness with Syntax score in patients who had acute MI.
Mean EAT thickness was greater in the investigators’
high-score group (Syntax score, ≥33) than in their
lower-score group (Syntax score, <33): 5.6 ± 1.1 versus
4.1 ± 1 mm (P <0.01). As did we, they found that EAT thickness was positively and significantly correlated with Syntax score; however, their study involved
pa-tients who had acute MI only. We identified a similar association of EAT thickness with CAD complexity in a study population that presented with the entire clini-cal spectrum of CAD, including stable angina pectoris, unstable angina pectoris, and acute MI.
Fig. 1 Scatter plot shows a significant and positive correlation between epicardial adipose tissue (EAT) thickness and the extent of coronary artery disease as evidenced by Gensini score. P <0.05 was considered statistically significant.
Fig. 2 Scatter plot shows a significant and positive correlation between epicardial adipose tissue (EAT) thickness and the com-plexity of coronary artery disease as evidenced by Syntax score. P <0.05 was considered statistically significant.
Fig. 3 Receiver operating characteristic (ROC) curve depicts the optimal cutoff value of epicardial adipose tissue (EAT) thickness to predict critical coronary artery disease: 5.75 mm (area under the curve=0.875; 95% confidence interval, 0.825–0.926; P <0.001). The sensitivity of the cutoff value was 77%; the specific-ity was 83%. P <0.05 was considered statistically significant.
EAT Thickness (mm)6 8 10 12 4 2 Ge nsini Scor e 200 150 100 50 0 N=183 P <0.001 r =0.82 R2=0.739 EAT Thickness (mm)6 8 10 12 4 2 S YN TA X Scor e 60 50 40 30 20 10 0 N=183 P <0.001 r =0.825 R2=0.724 1 - Specificity 1.0 0.8 0.6 0.4 0.2 0 Sensitivit y 1.0 0.8 0.6 0.4 0.2 0
Study Limitations
The most important limitation of this study is the relatively small sample size. Serum levels of interleu-kins, cytokines, and adipokines, which could hint at the underlying mechanisms, were not evaluated. In addition, we measured EAT thickness by means of echocardiography, rather than the comparatively more precise computed tomography. Last, although patients
admitted with acute coronary syndromes have report-edly had higher EAT values than do patients with stable angina, we did not categorize patients with respect to clinical presentation. Had we subdivided the popula-tion into unstable angina, stable angina, and atypical chest pain, and then further divided those groups into NCA, noncritical-CAD, and critical-CAD categories, the number of subjects in those subgroups would not TABLE III. Regression Analysis with Gensini Score as the Dependent Variable
Univariate Multivariate Independent Variable Beta Coefficient P Value Beta Coefficient P Value
Age 0.296 0.001 0.034 0.455 Male sex 0.139 0.06 — — Hypertension 0.199 0.007 0.007 0.864 Diabetes mellitus 0.432 0.001 0.113 0.016 Dyslipidemia 0.227 0.002 0.03 0.46 Creatinine 0.204 0.006 –0.02 0.639 Uric acid 0.531 0.001 0.092 0.069 GGT 0.311 0.001 0.039 0.374 HDL-C –0.481 0.004 0.009 0.831 Leukocytes 0.207 0.005 –0.011 0.787 EAT 0.841 0.001 0.716 <0.001
EAT = epicardial adipose tissue; GGT = gamma-glutamyltransferase; HDL-C = high-density-lipoprotein cholesterol R2=0.739; F=43.721. P <0.05 was considered statistically significant.
TABLE IV. Regression Analysis with Syntax Score as the Dependent Variable
Univariate Multivariate Independent Variable Beta Coefficient P Value Beta Coefficient P Value
Age 0.292 0.001 0.136 0.001 Male sex 0.184 0.012 0.051 0.198 Hypertension 0.163 0.027 –0.037 0.343 Diabetes mellitus 0.432 0.001 0.093 0.027 Dyslipidemia 0.192 0.009 0.018 0.635 Creatinine 0.187 0.011 –0.035 0.362 Uric acid 0.497 0.001 0.016 0.709 GGT 0.303 0.001 0.021 0.637 HDL-C –0.301 0.001 –0.074 0.067 Leukocytes 0.252 0.001 0.037 0.338 EAT 0.838 0.001 0.718 <0.001
EAT = epicardial adipose tissue; GGT = gamma-glutamyltransferase; HDL-C = high-density lipoprotein cholesterol R2=0.74; F=40.093. P <0.05 was considered statistically significant.
have been adequate to yield statistically significant re-sults. Rather, the purpose of our study was to investigate whether EAT thickness could predict more critical and complex CAD.
Conclusion
Quantification of EAT thickness by means of echo-cardiography—a relatively inexpensive, readily available method—might be beneficial in the early identification of patients who have complex or critical CAD. This knowledge could enable earlier referral of these patients for diagnostic coronary angiography and timely in-terventions. Our findings warrant further research in larger study populations.
References
1. Iacobellis G, Malavazos AE, Corsi MM. Epicardial fat: from the biomolecular aspects to the clinical practice. Int J Bio-chem Cell Biol 2011;43(12):1651-4.
2. Xu Y, Cheng X, Hong K, Huang C, Wan L. How to interpret epicardial adipose tissue as a cause of coronary artery disease: a meta-analysis. Coron Artery Dis 2012;23(4):227-33. 3. Comert N, Yucel O, Ege MR, Yaylak B, Erdogan G, Yilmaz
MB. Echocardiographic epicardial adipose tissue predicts subclinical atherosclerosis: epicardial adipose tissue and ath-erosclerosis. Angiology 2012;63(8):586-90.
4. Kunita E, Yamamoto H, Kitagawa T, Ohashi N, Oka T, Ut-sunomiya H, et al. Prognostic value of coronary artery calcium and epicardial adipose tissue assessed by non-contrast cardiac computed tomography. Atherosclerosis 2014;233(2):447-53. 5. Eroglu S, Sade LE, Yildirir A, Bal U, Ozbicer S, Ozgul AS,
et al. Epicardial adipose tissue thickness by echocardiography is a marker for the presence and severity of coronary artery disease. Nutr Metab Cardiovasc Dis 2009;19(3):211-7. 6. Topuz M, Dogan A, Celik A, Can C, Ozdogru I, Kemal
Eryol N. Investigation of the relationship between non-alco-holic fatty liver disease and coronary artery disease. Clin Ter 2014;165(1):e46-51.
7. Groves EM, Erande AS, Le C, Salcedo J, Hoang KC, Kumar S, et al. Comparison of epicardial adipose tissue volume and coronary artery disease severity in asymptomatic adults with versus without diabetes mellitus. Am J Cardiol 2014;114(5): 686-91.
8. Mihl C, Loeffen D, Versteylen MO, Takx RA, Nelemans PJ, Nijssen EC, et al. Automated quantification of epicardial adi-pose tissue (EAT) in coronary CT angiography; comparison with manual assessment and correlation with coronary artery disease. J Cardiovasc Comput Tomogr 2014;8(3):215-21. 9. Kim SH, Chung JH, Kwon BJ, Song SW, Choi WS. The
associations of epicardial adipose tissue with coronary artery disease and coronary atherosclerosis. Int Heart J 2014;55(3): 197-203.
10. Yuce G, Turkvatan A, Yener O. Can aortic atherosclerosis or epicardial adipose tissue volume be used as a marker for pre-dicting coronary artery disease? J Cardiol 2015;65(2):143-9. 11. Yanez-Rivera TG, Banos-Gonzalez MA, Ble-Castillo JL,
Torres-Hernandez ME, Torres-Lopez JE, Borrayo-Sanchez G. Relationship between epicardial adipose tissue, coronary artery disease and adiponectin in a Mexican population. Car-diovasc Ultrasound 2014;12:35.
12. Gokdeniz T, Turan T, Aykan AC, Gul I, Boyaci F, Hatem E, et al. Relation of epicardial fat thickness and cardio-ankle
vascular index to complexity of coronary artery disease in nondiabetic patients. Cardiology 2013;124(1):41-8.
13. Borekci A, Gur M, Ozaltun B, Baykan AO, Harbalioglu H, Seker T, et al. Epicardial fat thickness in stable coronary artery disease: its relationship with high-sensitive cardiac troponin T and N-terminal pro-brain natriuretic peptide. Coron Artery Dis 2014;25(8):685-90.
14. Ong AT, Serruys PW, Mohr FW, Morice MC, Kappetein AP, Holmes DR Jr, et al. The SYNergy between percutane-ous coronary intervention with TAXus and cardiac surgery (SYNTAX) study: design, rationale, and run-in phase. Am Heart J 2006;151(6):1194-204.
15. Schwalm JD, Wijeysundera HC, Tu JV, Guo H, Kingsbury KJ, Natarajan MK. Influence of coronary anatomy and SYN-TAX Score on the variations in revascularization strategies for patients with multivessel disease. Can J Cardiol 2014;30(10): 1155-61.
16. Paul SD, Eagle KA, Kuntz KM, Young JR, Hertzer NR. Concordance of preoperative clinical risk with angiographic severity of coronary artery disease in patients undergoing vas-cular surgery [published erratum appears in Circulation 1996; 94(10):2668]. Circulation 1996;94(7):1561-6.
17. Schiller NB, Shah PM, Crawford M, DeMaria A, Devereux R, Feigenbaum H, et al. Recommendations for quantitation of the left ventricle by two-dimensional echocardiography. American Society of Echocardiography Committee on Stan-dards, Subcommittee on Quantitation of Two-Dimensional Echocardiograms. J Am Soc Echocardiogr 1989;2(5):358-67. 18. Iacobellis G, Willens HJ. Echocardiographic epicardial fat: a
review of research and clinical applications. J Am Soc Echo-cardiogr 2009;22(12):1311-9.
19. Head SJ, Farooq V, Serruys PW, Kappetein AP. The SYNTAX score and its clinical implications. Heart 2014;100(2):169-77. 20. Gensini GG. A more meaningful scoring system for deter-mining the severity of coronary heart disease. Am J Cardiol 1983;51(3):606.
21. Karadag B, Ozulu B, Ozturk FY, Oztekin E, Sener N, Al-tuntas Y. Comparison of epicardial adipose tissue (EAT) thickness and anthropometric measurements in metabolic syndrome (MS) cases above and under the age of 65. Arch Gerontol Geriatr 2011;52(2):e79-84.
22. Iacobellis G, Diaz S, Mendez A, Goldberg R. Increased epi-cardial fat and plasma leptin in type 1 diabetes independently of obesity. Nutr Metab Cardiovasc Dis 2014;24(7):725-9. 23. Iacobellis G, Barbaro G, Gerstein HC. Relationship of
epicar-dial fat thickness and fasting glucose. Int J Cardiol 2008;128 (3):424-6.
24. Iacobellis G, Ribaudo MC, Assael F, Vecci E, Tiberti C, Zap-paterreno A, et al. Echocardiographic epicardial adipose tissue is related to anthropometric and clinical parameters of meta-bolic syndrome: a new indicator of cardiovascular risk. J Clin Endocrinol Metab 2003;88(11):5163-8.
25. Pierdomenico SD, Pierdomenico AM, Cuccurullo F, Iacobel-lis G. Meta-analysis of the relation of echocardiographic epi-cardial adipose tissue thickness and the metabolic syndrome. Am J Cardiol 2013;111(1):73-8.
26. Wang CP, Hsu HL, Hung WC, Yu TH, Chen YH, Chiu CA, et al. Increased epicardial adipose tissue (EAT) volume in type 2 diabetes mellitus and association with metabolic syn-drome and severity of coronary atherosclerosis. Clin Endocri-nol (Oxf ) 2009;70(6):876-82.
27. Kocaman SA, Durakoglugil ME, Cetin M, Erdogan T, Ergul E, Canga A. The independent relationship of epicardial adi-pose tissue with carotid intima-media thickness and endo-thelial functions: the association of pulse wave velocity with the active facilitated arterial conduction concept. Blood Press Monit 2013;18(2):85-93.
28. Doesch C, Haghi D, Suselbeck T, Schoenberg SO, Borggrefe M, Papavassiliu T. Impact of functional, morphological and clinical parameters on epicardial adipose tissue in patients with coronary artery disease. Circ J 2012;76(10):2426-34. 29. Tellides G. Periadventitial fat. Arch Pathol Lab Med 2007;131
(3):346-7.
30. Vela D, Buja LM, Madjid M, Burke A, Naghavi M, Willerson JT, et al. The role of periadventitial fat in atherosclerosis. Arch Pathol Lab Med 2007;131(3):481-7.
31. Sengul C, Ozveren O. Epicardial adipose tissue: a review of physiology, pathophysiology, and clinical applications. An-adolu Kardiyol Derg 2013;13(3):261-5.
32. Spiroglou SG, Kostopoulos CG, Varakis JN, Papadaki HH. Adipokines in periaortic and epicardial adipose tissue: differ-ential expression and relation to atherosclerosis. J Atheroscler Thromb 2010;17(2):115-30.
33. Eiras S, Teijeira-Fernandez E, Shamagian LG, Fernandez AL, Vazquez-Boquete A, Gonzalez-Juanatey JR. Extension of coronary artery disease is associated with increased IL-6 and decreased adiponectin gene expression in epicardial adipose tissue. Cytokine 2008;43(2):174-80.
34. Wang T, Liu Q, Liu C, Sun L, Li D, Liu A, Jia R. Correlation of echocardiographic epicardial fat thickness with severity of coronary artery disease in patients with acute myocardial in-farction. Echocardiography 2014;31(10):1177-81.