,r •.fr,.M /tN ;. fi- f ,.«u «ir··». V .·.; 1'·^ · /■ ч*'' ■»*',·
-*■. V 1.· ' J« " . Ч-*' >··/.>♦*· '■ *··».■· ■'-V;· * V. V Ч *-l. Iwmfl » . n
w ►ît-r ? R T ç •*'Л' ; :î}. ■ ЙЭ». '/ ? -r f
COST ANALYSIS OF BILKENT UNIVERSITY HOUSING COMPLEX FROM A COST ACCOUNTING APPLICATION FRAMEWORK
A THESIS
SUBMITTED TO THE DEPARTMENT OF MANAGEMENT AND
THE GRADUATE SCHOOL OF BUSINESS ADMINISTRATION OF
BILKENT UNIVERSITY
IN PARTIAL FULFILLMENT OF THE REQUIREMENTS FOR THE DEGREE OF
MASTER OF BUSINESS ADMINISTRATION
BY
SÜEL, HASAN.
н ъ
^ 3 5 2 . г 0 ■ А 0
3 2 ц І З Э З
I certify th a t I have read this thesis and in m y opinion it is fully ad equ ate, in scope and in quality, as a thesis fo r th e degree of M aster of Business A dm inistration.
A sso c.P ro f.D r, Erdal EREL
I certify th a t I have read this thesis and in m y opinion it is fully ad equ ate, in scope and in quality, as a thesis fo r th e degree of M a ste r of Business A dm inistration.
P ro f.D r. Ü m it Berkm an
I c e rtify th a t I have read this thesis and in m y opinion it is fully ad equ ate. In scope and In quality, as a thesis for th e degree of M aster of Business A dm inistration.
A sst. Prof. Dr. Selçuk KAR AB A TI
A pproved by the dean of the G raduate School of Business Adm inistration^^
n / .
ABSTRACT
COST ANALYSIS OF BILKENT UNIVERSITY HOUSING COMPLEX FROM A COST ACCOUNTING APPLICATION FRAMEWORK
BY Hasan SÜEL M .B.A. THESIS
BILKENT UNIVERSITY - ANKARA SEPTEMBER, 1993
Supervisor: Assoc.Prof.Dr. Erdal EREL
The cost centers of the housing facility of Bilkent University are examined to determine the total expenditure figure for 1992. Data are separated for East and Center Campus housing areas and compared in terms of different unit- cost measurements. Some hypotheses are tested to find if any difference exists. Comparisons are reported by pareto, pie and control charts to end up with some standards. Some differences appeared between East and Center campuses' cost centers. These differences are highlighted and some suggestions have been made.
ÖZET
BILKENT ÜNİVERSİTESİ LOJMANLARININ MALİYET ANALİZİNE AİT BİR MALİYET MUHASEBESİ UYGULAMASI
HAZIRLAYAN Haşan SÜEL
İŞLETME YÜKSEK LİSANS TEZİ BİLKENT ÜNİVERSİTESİ - ANKARA
EYLÜL, 1993
Denetleyen: Doç. Dr. Erdal EFtEL
Bu çalışmada, 1992 toplam giderlerinin tayini açısından üniversite lojmanları maliyet merkezlerinin bir analizi yapılmıştır. Merkez ve Doğu kampüs konutlarının birim maliyetleri ayrı ayrı hesaplanarak karşılaştırılmıştır. Aradaki farklılıkların tespiti amacıyla istatistiksel testler ve hipotezler uygulanmıştır. Karşılaştırmalarda Pareto, Pie ve Control grafikleri gibi istatistiksel araçlar kullanılmış ve sonuçta bazı birim maliyet standartlarına ulaşılmıştır. Doğu ve Merkez kampüs konutları maliyet merkezleri arasında farklılıklar bulunduğu ortaya çıkmıştır. Farklılıklara ait bulgular belirtilerek idareciler uyarılmıştır.
A C K N O W L E D G M E N T S
I gratefully ackno w led ge the encouragem ent, guidance, advise and friendly supervision of Assoc. Prof. Dr. Erdal Erel during the preparation of this thesis. Helpful com m ents of Prof.D r. Ü m it Berkman and Dr. Selçuk Karabeti is also appreciated.
I w ould like also to extend my best regards to M rs. M eral Ünalan fo r her sincere support and providing inform ation and data during this study.
Finally, I w ould like to express m y gratitude to instructors of facu lty of m anagem ent for their endless and continuous support not only during the thesis w o rk, but throughout m y M B A education.
TABLE OF COIMTEIMTS ABSTRACT ÖZET ACKNOWLEDGEMENTS CHAPTER I INTRODUCTION 1.1 .University Concept 1.1.1. University Administration
1.1.2. Private University Administration 1.1.3. Accounting for Academic Services
1.1.3.1 .Variable Costing 1.2. Housing Complex in Bilkent University
1.2.1. Objective 1.2.2. Thesis Outline 1 1 1 2 3 4 4 5 6
CHAPTER II LITERATURE SURVEY 8
2.1. University as an Organization 8
2.2. Accounting for Academic Services 8
2.2.1. Cost Accounting 9
2.2.1.1. Variable Costing 10
2.2.1.2. Cost Variances and Standard Costs 11
2.2.2. Cost Control 12
2.2.3. Budgeting System 13
2.2.3.1. Cost Estimation for Budgeting System 13 2.2.3.2. Responsibility Centers 14 2.3. Management Information Systems (MIS) 14 2.3.1. Integrated Cost Control and Information System 15 CHAPTER III ANALYSIS
3.1. Heating and Hot-Water Expenses 17
3.1.1 Seasonality 18
3.1.2. Amount of Fuel-oil consumed per each 18 Heat Central
3.1.3. Amount of Fuel-oil consumed per Closed 18 Area
3.2. Findings of Heating and Hot-water Expenses 19
3.2.1 .Seasonality 19
3.2.2.Kg/Year 20
3.2.2.1 .Heat Centrals 20
3.2.2.2. Total Consumption of Both Campus 21
3.3. Electricity Expenses in the University Housing 3.3.1. Kwh/Month 3 .3 .2 . Kwh/MMVIonth 3.3.3. TL/Year 3.3.4. TL/M^Year 3.3.5. Seasonality
3.4. Water Expenses in University Housing 3.4.1. MVMonth
3.4.2. M W .M o n th 3.4.3. TL/M^Year 3.4.4. Seasonality
3.5. Overhead Expenses in University Housing 3.6. Maintenance Expenses in University Housing 3.7. Other Utility Expenses in University Housing 3.8. Personnel Expenses in University Housing 3.9. Total Expenditure of University Housing
24 25 25 26 26 26 27 28 29 29 30 30 31 32 32 33 CHAPTER IV SUMMARY, CONCLUSION AND
RECOMMENDATIONS
4.1 Summary 36
4.2. Conclusion 37
4.3. Recommendations 37
4.3.1. Cost Control System 37
4.3.1.1. Cost Control Strategy for Bilkent University 38
4.3.2. Budget System 39
4.3.2.1. Cost Estimation for the Budget System 40 4.3.2.1.1. Recommended Techniques 40
4.3.2.2. Standard Cost System 41
4.3.2.2.1. Recomended Ratios 42
4.3.3. Responsibility Center 42
4.3.4. Management Information Systems 43
4.3.4.1. Recomended MIS for Bilkent University 44
4.3.5. Responsibility Accounting 45
REFERENCES APPENDIX A
LIST OF CHARTS FIGURE 1 FIGURE 2 FIGURE 3 FIGURE 4 FIGURE 5 FIGURE 6 FIGURE 7 FIGURE 8 FIGURE 9 FIGURE 10 FIGURE 11 FIGURE 12 FIGURE 13 FIGURE 14 FIGURE 16 FIGURE C.1
Comparison of Two Campuses Housings
Average Fuel-oil Purchase in University Housings Fuel-oil Consumption of Each Heat Central
Fuel-oil Consumption in University Housings Fuel-oil Consumption in 1992
Comparison of Two Campuses Fuel-oil Consumption
Control Chart for Fuel-oil Consumption Electricity Consumption (KWH/Month) Electricity Consumption (KWH/M2.Month) Seasonality in Electricity Consumption Water Consumption (M3/Month)
Water Consumption (M3/M2.Month) Seasonality in Water Consumption Total Housing Expenditure in 1992 Total Housing Expenditure (TL/M2)
LIST OF TABLES
TABLE 1 Total Expenditure in University Housing in 1992 TABLE 2 Area(m2) of University Housing
TABLE 3 Fuel-Oil Purchase (Kg/month & Kg/m2.month) TABLE 4 Fuel Oil Expenditure of University Housing
TABLE 5 Monthly Fuel-oil Consumption in University Housings TABLE 6 Total Expenditure in University Housing in (TL/m2.year) TABLE 7 Distribution of Electricity Expenses
TABLE 8 Electricity Expenses of University Housing TABLE 9 Water Expenses in the University Housing TABLE 10 Overhead Expenses
TABLE 11 Maintenance Expenses TABLE 12 Other Utility Expenses
TABLE 13 Hypotheses Tested in the Cost Centers TABLE 14 Budget Sheet of the Housing Complex
CHAPTER I
INTRODUCTION
1.1 University Concept
Since the middle ages, universities have been valued and respected as centers for intellectual life. They provide places for scholars to work for the advancement of the arts, letters and sciences. Universities perform the useful service of training leaders for the professions and for public life [Americana, 240].
1.1.1. University Administration
Because the most institutions of higher education lack a clear and ambiguous mission whose achievement can be assessed through agreed upon quantifiable measures such as "profits", the processes, structures and systems of university administration do not resemble typical business firms. In colleges and universities, profit sensibility is not as high as business firms.
If universities are studied as organizations , they are formed by groups of people filling roles and working together towards the achievement of common objectives within a formal social structure [Birnbaum,1]. The organizational characteristics of academic institutions are so different from other institutions by serving clients instead of processing materials. Their key employees are highly professionalized , they have unclear technologies based more on professional skills
than on standards. They have "fluid participation" with amateur decision makers who wander in and out of the decision process.
As a result, traditional management theories cannot be applied to educational institutions without carefully considering whether they will work well in that unique academic setting.
1.1.2. Private University Administration
Colleges and Universities can be grouped into two categories in terms of control and support; namely, private and public.
Private institutions are financed by tuition and fees, charities, gifts from individuals, business, foundations, endowment earnings and certain governmental appropriation [Americana, 245].
In analyzing private educational institutions as organizations, it is crucial to consider more profit sensibility than the public institutions. Executives should be more professionalized and be conscious on the service they are performing for the academic life.
The organizational status of Bilkent University can be expressed in a hierarchical manner as follows; President is managing the university at the top level. There are Vice-presidents responsible for administrative and financial affairs,
of the duties of the administrative and financial affairs Vice-presidency is to provide support (auxiliary) services for its academic personnel.
Being a private institution, Bilkent University is financed by Bilkent Holding, tuition and fees, government support etc. Thus, managerial perspective of the university administration should be well understood in order to perform cost- effective academic service.
1.1.3. Accounting for Academic Services
" Accounting is the art of recording, classifying, and summarizing in terms of money, transactions and events which are, in part at least, of a financial character, and interpreting the results thereof " [Americana, 84]. Accounting for academic services is a long-term effort that requires regular attention to be focused on trends toward and away from some general goals. University goals relevant to the academic service are efficient use of resources to provide responsiveness to the needs of profession and the society it serves [Tuckman, 48].
Cost accounting is the sub field of accounting that analyzes the costs for planning, reporting, control and comparison. University executives should be aware of the cost management in the campus in order to control and plan for the future. The raw financial data must be digested into usable information by providing more time and analysis on cost accounting.
A properly designed cost accounting system should be integrated with the organization’s structure and the budget system. During the detailed cost accounting process, the unit-cost information should be a logical and necessary extension of the process. In evaluating the results of the operations for the budget period, the cost accounting system must provide data that will allow comparison of the budget to the actual results of operations [Sweeney, 144].
1.1.3.1. Variable Costing
In this thesis. Variable Costing is used as a cost accounting application which is a type of cost that tends to change with the volume or activity. Variable costing is performed by unit basis calculations, where fixed costs are reported on a period basis. The unit-cost measurements are helpful to recognize the changes and differences between activities in the cost centers of Bilkent University.
1.2. Housing Complex in Bilkent University
One of the support services that university provides is the housing complex in East and Center campus. Housing expenses need variable costing in the light of some unit-cost measurements to be reported to the university executives. Due to the 1992 figures , University is conscious about the cost variances of the cost centers in the housing area. A Cost Variance Analysis may show that a cost center should be modified to show cost-effective performance in terms of variable costing standards.
Providing housing services for its academic personnel, Bilkent University has the highest housing capacity as a private university among other universities in Turkey. Therefore, housing expenses are considered to be an important account in University’s Balance Sheet.
The main point is to find out if any cost-effectiveness difference is present between the cost centers of east and center campus of the housing area in the light of some unit-cost measurements.
1.2.1. Objective
Objective of this thesis is to highlight the differences between the cost centers of east and center campuses of university housing by testing the following hypotheses.
• Hypothesis Iq: Housing Expenditure per Unit Area is Constant
Hypothesis ly\: Housing Expenditure per Unit area is not constant
In order to control the cost centers in University Housings, expenditure per unit area is expected to be constant. This hypothesis is tested in Chapter III.
• Hypothesis IIq: The higher the Housing Area, the lower the Cost per Unit Area (Economies o f Scale).
Hypothesis lly\ .‘Economies o f scale is not present in the cost center.
Economies of scale is tested in each cost center in Chapter III.
• Hypothesis IIIq : Seasonality Trend is Seen in the Cost Center
Expenses vary between certain periods of the year.
Bilkent University has 57,689 square meter closed area of housings in both campuses. Managing Center and East campuses' housing expenses bring an additional burden on university. After examining the expense figures of both campuses' housings, variations between tw o campuses' expenditure figures took the notice of the executives. In order to achieve cost control in both campuses, some expenditure accounts should be examined.
1.2.2. Thesis Outline
In this thesis, a unit-cost accounting application is done in Bilkent University's housings . All of the relevant data for the housing accounts are searched and compared seasonally, in terms of TL/month, TL/year and TL/m^.year units. There are also some difficulties in comparing the accounts of both campuses. Here, some reasonable assumptions are made for comparisons, (ex. comparison by square meter and number of people using university housings)
In Chapter II, some important cost accounting terms are defined within the scope of some authors.
Outline of this thesis is structured under the headings of the cost centers in university housing. In Chapter III, all of the cost centers of the housings are separately analyzed. Some hypotheses are tested and test results are summarized for a conclusion. In the light of these results, some general rules appeared in the housing areas. After analyzing the cost centers separately, a total expenditure
Some reasonable assumptions are made for the East Campus figures because of the unclear points of the accounting system of tw o campuses.
In Chapter IV, a review is done for the analysis part. Findings are summarized by reporting the weight of each cost center within the total expenditure. Results of the tests for the hypotheses are summarized. Some statistical conclusions are achieved to warn executives for the service quality in the housings. Some recommendations are made to achieve a " Cost Control System " for the university housing by assigning a " Responsibility Center ".
Finally, tables and charts for the expense figures are reported in appendices.
The subject of this thesis is important because it helps University to achieve standards in unit-housing expenses so that some targets can be set for the future unit-expenditures. In the light of a budgeting procedure, housing expenses can be controlled by checking whether the target standards are achieved or not. Achieving some service quality standards will help Bilkent University to set goals and control the effectiveness of the cost centers in the university housing.
CHAPTER II
LITERATURE SURVEY
2.1. University as an Organization
Bilkent University Housing Services can be considered as a non-profit organization. When non-profit organizations are compared to profit administrations, some points are highlighted. Non-profit organizations have a tendency to be a service organization where the dominance of professionals are present. There are differences in governance and senior management with respect to business firms. The goal of an university support (auxiliary) service is to render a given amount of resources, or to use as few resources as possible to render a given amount of service [Anthony, 804].
2.2. Accounting for Academic Services
University administration needs proper accounting data to have effective cost management. Cost Centers of the university can be best reported using cost accounting techniques.
To understand how cost accounting affects managerial decision making, it is important to make some definitions of some cost accounting terms and their usage in considering the alternatives.
Cost accounting is the subfield of accounting that records, measures and reports the information about costs [Deakin, 3]. "A cost is a sacrifice of resources and it is the amount of expenditure incurred on or attributable to a specific thing or activity" ( Institute of Cost and Management Accountants ) [Pizzey, 5].
To be successful in any kind of activity, managers must know how much things cost. Costing is an analysis to allocate costs to products or services or time periods to be used inside the organization by managers to evaluate the performance of operations or personnel or as a basis of decision making [Deakin, 3 ] . Cost information should only be produced if it provides a benefit deemed to be worth more than its cost.
One of the most difficult tasks in calculating costs is to estimate how they will differ among the alternatives. Using cost accounting techniques, differential costs can be estimated to evaluate how they differ for each alternative [Deakin, 4 ] .
2 .2 .1 . Cost A ccounting
Cost accounting analyzes costs by the nature of the components or on the basis of cost accumulation by the cost centers. In contrast to financial accounting, which is designed primarily to meet the needs of groups inside the firm (management), the primary functions of cost accounting are to provide basis for
inventory valuations, budgets, special cost investigations, forecast analysis, cost comparisons, planning and control [Americana, 88].
Although accountants have traditionally supplied management with raw financial data, these data must be converted into usable information in order to promote and direct action by management. Providing usable information requires more time and analysis than simply reporting the raw financial data [ed.Brinker, 18].
Cost accounting systems are designed to ascertain two major types of costs; the total cost of each of the various activities and functions of a business and the cost per unit of each of the concern's product and services. Every division of activity or a function that the cost accountant wishes to cost separately is regarded as a "Cost Center" [Pizzey ,7].
In this thesis, these terms are tried to be highlighted by preparing a cost analysis of East and Center campus housing area of Bilkent University.
2.2.1.1 Variable Costing
Variable costing is an excellent tool for evaluating results of current operations in terms of comparison of actual results to budgets or plans . It also provides valuable information required for other management decisions. Therefore, variable costing is often used for managerial decision making and performance evaluation (Sweeney, 153].
Many companies use variable costing for internal reporting because it is consistent with the cost-behavior assumptions used in managerial decision making [Deakin, 340].
2.2.1.2. Cost Variances and Standard Costs
The actual costs incurred for the time period are compared with the standard costs allowed per unit times. This comparison provides the total variances of the costs.
A Standard is a bench-mark or a norm in accounting. A standard cost is the anticipated unit-cost. It is a pre-determined unit-cost, while a budget is a financial plan. Standard costs are often used to make up the financial plan. While in practice these terms are sometimes used interchangeably, standards usually refer to per-unit amounts, where budgets usually refer to total amounts [Deakin, 743].
A standard cost system is used to describe a situation in which standard costs are part of the formal accounting record keeping system. The use of standard costs in the accounting records means that they can be used for performance evaluation. A possible benefit of formalizing the standard cost system is the monitoring and updating of standards to keep them current [Deakin, 789].
Standard costing and budgetary control have in common the establishment of pre-determined measures of performance so as to disclose the details of variations which are used for the purpose of cost control [Pizzey, 221].
Standards, against which actual effectiveness are to be compared must be carefully developed. They must be derived from and be consistent with the goals or objectives pursued by the organization. Pre-determined standards or budgets are the basis against which actual performance is compared [Anthony, 146].
2 .2 .2 . Cost Control
Cost control has been defined as the regulation by executive action of the costs. It covers the control of material usage and material prices ; of wages cost, separating the effect of efficiency from rates of pay of maintenance and service costs and of all other items of indirect expenditure [Pizzey, 7].
It can also be defined as the skillful handling or directing of costs. As such, cost control involves much more than cost accounting. Cost control requires newer and broader management tools to yield cost advantages.
Managers in all organizations set financial goals for performance indicators. Each responsibility center usually has a budget that is a financial plan of resources needed to carry out the center's tasks and meet financial goals. At regular intervals of time, resources actually used are compared with the amount budgeted to assess the center’s and the manager’s performance. By comparing actual results with the budget plans, it is possible to identify the probable causes of the variances from planned costs [Deakin, 7].
” The formal expression of the plans and objectives of management that covers all phases of operations for a specific period of time has been defined as a budget. ". It allows participation from all parts of the organization and enhances the planning of organizational goals and objectives. Budgeting process provides a mechanism to allocate resources rationally and economically [Sweeney, v].
Budgetary Control Systems based on financial measures are widely used in economic organizations. Budget plans provide a basis for directing and evaluating the performance of the segments of the organizations. Through budgets, activities of different parts of the organization can be coordinated and controlled. A control system typically incorporates measures and techniques which conform to the responsibilities delegated to managers under the organization's structure [ed.Bell, 128].
2.2.3.1. Cost Estimation for the Budgeting System
Accounting systems are designed primarily to record and report costs that have been incurred in the past. However, it is important that management should also be able to estimate future cost-behavior. In deciding among alternative actions, management needs to know the costs that are likely to be incurred for each alternative. Data from the accounting records are often used to help make these estimates.
2 .2 .3 . Budgeting System
Budgets for performance evaluation and cost control are typically organized around responsibility centers [Deakin, 723]. "The organizational implications of adopting an explicit cost-management strategy are so substantial that start-up needs to be viewed as a period of major strategic change for the corporation.". For most organizations, the appointment of a full-time director or coordinator is needed for responsibility centers [Richardson, 219].
2.3. Management Information Systems (MIS)
Information is the base of management control systems. The continuing rise of information technologies is now exploding the information development process and expanding information concept. Information is the transmitted, filtered, reorganized, analyzed and related data useful in achieving organizational goals [Anthony, 133].
In 1990s, local education authorities and individual college managements have been expected to come to grips with a welter of new management information systems. Decisions have required methods of showing their probable and operational effects, and reporting on the outcome of past decision has required some means of retaining and distilling information. Systems have developed for a number of reasons [ed.Locke, 323].
• The cost consciousness that is more apparent at times of financial stringency has meant that closer efforts have been made to establish expected costs and monitor expenditures. "To discourage systematic-over or under-spending a
variety of financial controls have been exerted, and these have encouraged managers to ensure that, when they come to accounting periods, they know whether they will arrive on or near target".
• A variety of techniques has been introduced for comparing the cost of activities or consumables. These techniques are often somewhat crude in their abilities to discriminate between legitimate and illegitimate cost differences.
• The availability of complex computers has enabled major breakthrough in the technical capacity to count and measure performance. Many educational institutions already owned main-frame computers, but these were seldom used for management tasks other than payroll. In part, that was a matter of their relative inconvenience and in part the absence of the right kinds of programs.
2.3.1. Integrated Cost Control and Information System
In the information integration phase, cost accounting is integrated into other business functions within the organization. Strength of the Integrated Cost Control and Information System are [ed.Brinker, 178];
• Timely entry and editing of data
• Conceptually link operations and accounting
• Can produce useful tools for decision support in budgeting • Eliminate duplicate data entry
• Data collection is computerized
Weaknesses of the Traditional System are:
• Reporting is too slow to react • Duplicate inconsistent data
• Slow reaction to operating changes
• Do not recognize the shifts from variable to fixed costs • Little co-operation between departments
CHAPTER III ANALYSIS
3.1. Heating And Hot Water Expenses
A framework is prepared for this analysis. (See App. A) According to this framework, the most important accounts for the housing expenses are selected to be the Heating and Hot Water, Water and Personnel Expenses. It is meaningful to start with Heating and Hot Water Expenses where fuel-oil is used in high amounts for closed area Heating and hot-water supply.
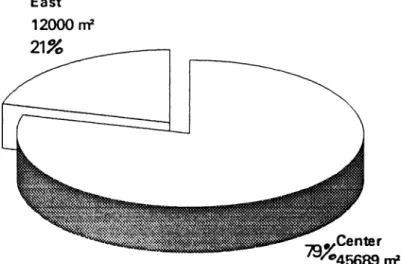
As mentioned before, Bilkent University has 57,689 square meter closed area for Heating and hot water supply (See Table 2 in Appendix B).
Center campus has 45,689 square meters where East campus already has 12,000 square meter area (See Figure 1).
C e n te r '® 4 5 6 8 9 nf
FIGURE 1 COMPARISON OF TWO CAMPUSES HOUSINGS
Center campus has nine Heat Centrals located in various blocks and East campus has ten Heat Centrals located in each block (See Table 3 in App. B). All of the data available for the years 1990, 1991, 1992 and 1993 are examined in Table 4 in App. B and the average of the fuel-oil consumption in four years is calculated (See Table 3 in App. B). Fuel-oil consumption is affected by various conditions each year (changing weather conditions, fuel-oil prices, amount of the housing area etc.). To protect the accuracy of this analysis from deviations, average of the data in 1990-1993 is calculated (especially for the center campus).
In analyzing heating and hot water expenses, three variables are used to compare heating and hot water expenses of both campuses:
3.1.1. Seasonality
Fuel-oil expenses vary in certain periods of the year (maximum expense in winter).
3.1.2. Amount of Fuel-oil Consumed in Heat Centrals (kg/time)
By the help of this unit, fuel-oil consumption of each Heat Central is found out through the years 1990, 1991, 1992 and 1993 (See Table 3 in App. B).
3.1.3. Amount of Fuel-oil consumed per closed area (kg/m*.time)
As mentioned before, some of the Heat Centrals (especially in Center campus) provide heating and hot-water supply for different amounts of closed area. In order to make realistic comparisons between Heat Centrals, the unit consumption of each Central per unit area is calculated.
All these three variables are examined in an Excel 4.0 worksheet, and some realistic conclusions are tried to be achieved in the light of this data (See Table 3 in App, B).
3.2. Findings of Heating and Hot Water Expenses
Fuel-oil expenditure in each Heat Central is searched out between 1990 and 1993 (See Table 4 in App. B).
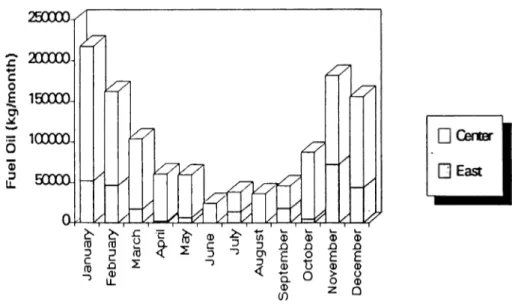
3.2.1. Seasonality
As can be seen in Figure 2 and Table 5 in App. B, it is obvious that a seasonality trend is present in fuel-oil consumption in various months of the year. Bilkent University Housings’ Heat Centrals spend maximum amount of fuel-oil in January and the minimum amount in June. However, there exist some differences as regards the fuel-oil consumption of tw o campuses.
FIGURE 2 AVERAGE FUEL-OIL PURCHASE IN UNIVERSITY HOUSINGS
Although January is the month for maximum fuel-oil consumption for the total housing units, East campus has the maximum expenditure in November. In summer months, fuel-oil is consumed only for hot water supply. So little expenditure is incurred especially in this period.
So, Hypothesis IIIq in Chapter I is not rejected in the light of these findings.
3.2.2. Kg/year
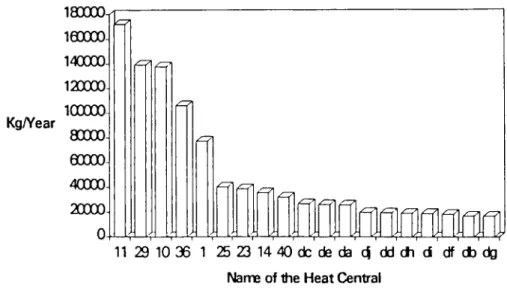
Kg/year Fuel-oil consumption can be interpreted as follows: 3.2.2.1. Heat Centrals
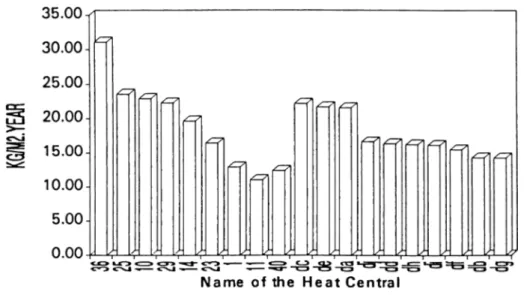
In center campus, fuel oil is mostly consumed by the Central located at block 11 (Central 11 serves to maximum closed area), and Heat Central located at block 40 consumes the least amount. In east campus, each of the Heat Centrals provides heating and hot-water supply for 1200 square meter area. Block C has the maximum consumption with 26,658 kg/year (See Figure 4).
Kg/Year 180000 leoooo 140000. 120000 100000 80000 eoooo 40000 20000 0 p n i r m n i J 11 29 10 36 1 25 23 14 4 0 d c d e d a c | d d d h d d f d b d g Name of Ihe H eat Central
It is clear that there exists a difference in cost-effectiveness between blocks C, E, A and those of other blocks in East campus.
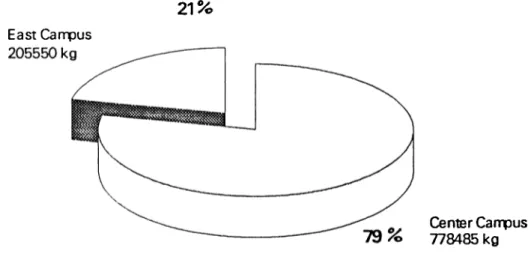
3.2.2.2. Total Fuel-Oil Consumption of East and Center Campus
University Housings have a total of 984,085 kg of fuel-oil expenditure per year. 21 % of this belongs to East Campus (See Figure 5).
21% E ast Cam pus
C enter C an p u s 7 7 8 4 8 5 kg
FIGURE 5 FUEL OIL CONSUMPTION IN 1992
In Table 1 in App. B, heating and hot water account has an expenditure amounting to 2,037,103,427 TL (35.39% of the total housing expenses).
3 .2 .2 .3 . Kg/m^.year
In all of the fuel-oil expenditure calculations, the most effective unit for fuel- oil consumption measurements is the kilogram consumed per square meter per year.
As the Heat Centrals of Center campus provide service for different of square meters of areas, the effectiveness of these Heat Centrals can be calculated by using kg/m2.year as a unit-cost measure. According to Figure 4, East Campus Centrals in blocks C, E, A show a significant difference in consumption per unit area . So Hypothesis Iq in Chapter I is rejected for kg/m2.year fuel-oil
consumption.
FIGURE 4 FUEL OIL CONSUMPTION IN UNIVERSITY HOUSING (KG/M2.YEAR)
Block 11 of Center campus, which is the Heat Central with maximum fuel-oil consumption has the minimum expenditure in terms of kg/m^.year. Also, block 36 has the maximum consumption per unit area (It serves to 3416 m2). Examining
each Heat Central one by one, it is seen that amount of closed area(m^) has a direct proportion with the cost effectiveness of the fuel-oil consumption. Higher the area of the Heat Central that it serves for, higher the effectiveness of the Heat Central, therefore lower the kg/m^.year fuel-oil consumed. So Hypothesis IIq in
Chapter I is not rejected.
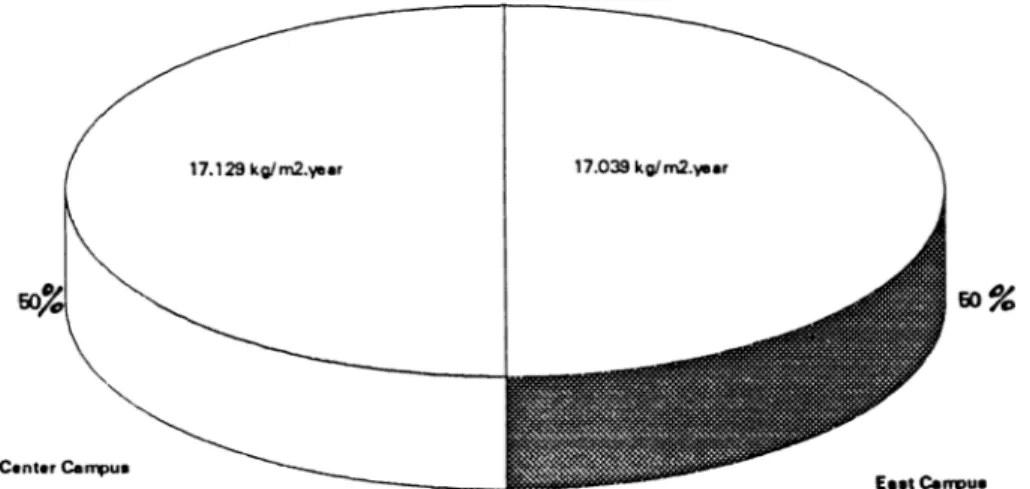
It appears that , Heat Centrals of each campus work with the same cost- effectiveness when total fuel-oil consumption is divided by the total area of housings in each campus (See Figure 6).
FIGURE 6 COMPARISON OF TWO CAMPUSES FUEL OIL CONSUMPTION (KG/M2.YEAR)
Considering Table 6 in App. B, University had spent 38,084.53 TL/m2.year in 1992 for heating and hot-water expenses.
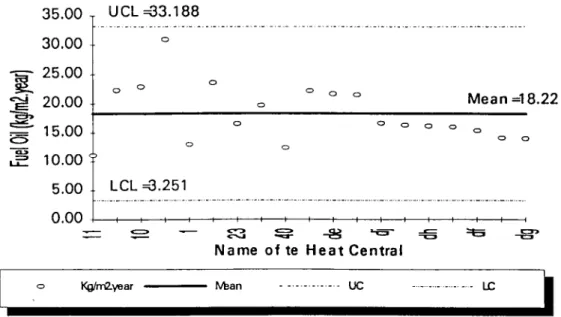
As a statistical tool, a control chart is used to summarize the changes in the cost effectiveness of all Heat Centrals (See Figure 7). According to the control
chart plotted, there is no block that appears to be out of the control limits. However, this tool is not sufficient to conclude that Hypothesis Iq in Chapter I
should not be rejected.
3 5 .0 0 T U C L = 3 3 .1 8 8 3 0 .0 0 2 5 .0 0 20.00 1 5 .0 0 10.00 5 .0 0 0.00 M e a n = 1 8 .2 2 ^ O o L C L =3 .2 5 1 ^ - S ' N a m e o f te H e a t C e n t r a l Kg/mZyear fVban DC UC j FIGURE 7 CONTROL CHART FOR FUEL OIL CONSUMPTION
3.3. Electricity Expenses in the University Housing
Academic personnel living in the University Housing are charged for their electricity consumption in Kwh. However, Bilkent University is supposed to pay its electricity consumption in terms of the industrial prices where academic residents are charged with the household prices. The difference between these prices creates an expense account for the university (See Table 7 in App. B).
In Table 8 of App. B, all of the electricity expenses are tabulated in terms of Kwh/Month and Kwh/m^.month between January 1990 and March 1993. In the light of these figures, both campuses can be compared in five unit-cost measures:
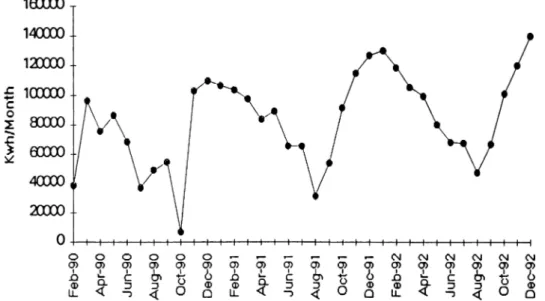
3.3.1. Kwh/Month
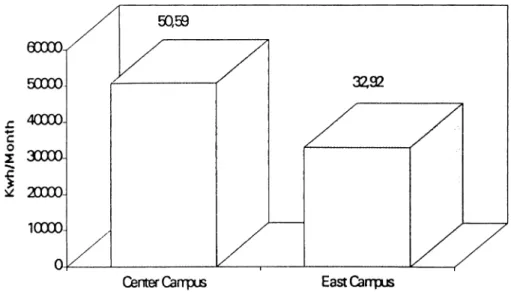
Center campus housings have an average consumption of 50,598 Kwh per month, whereas east campus is faced with a figure of 32,923 Kwh/Month (See Figure 8).
FIGURE 8 ELECTRICITY CONSUMPTION (KWH/MONTH)
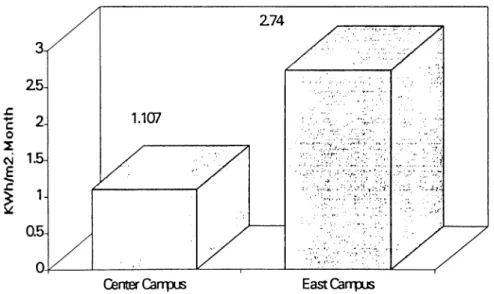
3.3.2. Kwh/m*.month
Kwh/Month electricity consumption figures are useful but not enough to make a comparison as regards the housings of two campuses. Hypothesis Iq in
Chapter I is not rejected when Kwh/m^.month is selected as unit-cost measurement. The higher the area for electricity consumption, the lower the Kwh electricity consumed per m^.month (See Figure 9).
FIGURE 9 ELECTRICTY CONSUMPTION (KWH/M2.MONTH)
3.3.3. TL/year
It is observed that a total of 927,551,835 TL is spent on electricity after the payments of the residents is substracted (See Table 1 in App.B). Electricity expenses constitute 16.12% of the total housing expense in 1992 figures.
3.3.4 TL/M^Year
Bilkent University spent 17,340.98 TL/m2 for electricity in 1992 (See Table 6 in App. B).
3.3.5. Seasonality
A seasonality trend is also seen in electricity expenses (See Figure 10). Most of the Kwh of electricity is consumed in academic months (fall and spring semesters). Sunlight exposure has a lower period in winter and higher in summer
months. So, some differences are detected between certain months of the year. Environment lighting, which is an important factor in total electricity consumption is affected by this seasonality trend.
FIGURE 10 SEASONALITY IN ELECTRICITY CONSUMPTION
As a result. Hypothesis IIIq in Chapter I is not rejected in electricity
expenses.
3.4. Water Consumption Expenses in University Housing
Water is consumed in two ways. As stated before, some amount is used as hot-water and the rest is consumed as cold-water. Academic residents are not charged for their water consumption. Bilkent University pays for the water expenses that is incurred in the housings of boyh campuses.
Available figures for water consumption in both campuses are reported in Table 9 of App. B.
Bilkent University pays 9520 TL/m^ (March 1993) per unit water consumption. Total water expense is 761,412,960 TL, where it constitutes 13,23% of the total housing expenses (See Table 1 in App. B). According to this figure, 33.7% (257,054,560 TL) of total water expenses is consumed by east campus. East campus housings constituting 21% of the total housing area, have spent 33.7% of the total. This indicates that, east campus housing has a higher water consumption than it is expected. This conclusion can also be proved by using other unit-cost measures:
3.4.1. M=>/Month
Center campus has 7762,6 m^/month water consumption, where east campus has 5389.9 m^/month (See Figure 11).
FIGURE 11 WATER CONSUMPTION (M3/MONTH)
However, M^/Month figures are not enough to conclude about the cost effectiveness of water consumption in both campuses.
3.4.2. M^/MMVIonth
East campus housings have a water consumption of 0.2438 mVm*.month (See Figure 12).
FIGURE 12 WATER CONSUMPTION (M3/M2.MONTH)
Using the same unit, center campus housings have only 0.1699 m^/m^.month of water consumption. So Hypothesis IIq in Chapter I is not rejected.
3.4.3. TL/m^.year
Bilkent University spent 14,235 TL for water per square meter in 1992 ( See Table 6 in App. B).
3.4.4. Seasonality
MVmonth figures is plotted to search whether any seasonality trend is present (See Figure 13).
Center CarrpL6 EastCarrpLB
1
FIGURE 13 SEASONALITY TREND IN WATER CONSUMPTION
It can be concluded that there is no seasonality trend. So Hypothesis IIIq in Chapter I is rejected.
3.5. Overhead Expenses in the University Housing
Overhead expenses occupy an important part of the total housing expenses (20.34%) in 1992 (See Table 1 in App. B). Overhead expenses consist of purchasing of main fixtures, consumer durables and furniture in the university housing. Overhead expenses is not considered as a fixed cost because all these materials require replacement and maintenance after some period. So, overhead
expense figures change periodically. Therefore, it is included in the total operating expenses of the University housing.
Brief classification of the overhead expenses is indicated in Table 10 in App. B. As can be seen from the figure, building equipment occupies an important portion of the total overhead expenses (88.06%). This is the figure that needs concentration to control the cost-effectiveness in the University housings.
Unfortunately, most of the overhead purchasing figures of East Campus are included in the Center Campus figures. There is not a clear cost accounting system between two campuses to differentiate the costs that occur in the overhead expense account. The present figures do not seem to be clear and reasonable (East Campus occupies 2.2% of the total overhead expenses). From 1992 figures, Bilkent University spent 1,170,886,631 TL for the overhead ( See Table 1 in App. B).
Bilkent University spent 21,890.23 TL/m^ for the overhead expenses i n i 992 (See Table 6 in App. B).
3.6. Maintenance Expenses in the University Housing
Maintenance in the university housing consists of the repair of the overhead, plumbing, motor breakdowns and wall paintings (See Table 11 of App. B).
Bilkent University spent 167,793,873 TL for the maintenance of housings in both campuses in 1992. This constitutes 2.92% of the total housing expenditures (See Table 1 of App. B).
Bilkent University spent 3,136.98 TL per square meter for maintenance of housings in 1992 (See Table 6 of App. B). Using this measure, it is more reasonable to make a comparison of the cost-effectiveness of two campuses. According to this table , east campus maintenance expenditure is 25.44% of the total maintenance expenses. Having 21% of the total housing area, this figure seems to be reasonable.
3.7. Other Utility Expenses in the University Housing
These are the minor expenses that are obligatory to manage the housing services. Other Utility expenses include; transportation of residents, food and beverage of housing personnel, cleaning expenses, personnel clothing and some other service expenditures (See Table 12 of App. B).
Bilkent University spent 257,169,608 TL for Other Utilities in 1992. It constitutes 4.47% of the total housing expenses (See Table 1 of App. B).
When Other Utility Expenses are reported in terms of TL/m^.year, it is observed that University spent 4,807.90 TL per square meter in 1992 (Table 6 of App. B).
3.8. Personnel Expenses in the University Housing
In order to achieve a high standard in housing services, Bilkent University employs some administrative personnel in the housing area. Salaries and other payments of these personnel are summarized under the account of personnel expenses. Bilkent University spent 433,545,404 TL for personnel in 1992 (See Table 1 of App. B). This figure is 8.15% of the total housing expenses.
Unfortunately, it is very hard to make a comparison between east and center campus. According to the general expense report (prepared by finance department), all of the personnel expense figures are included in center campus accounts.
Therefore, a realistic assumption seems to be necessary to differentiate the personnel expenses of two campuses. Excluding personnel expenses, Bilkent University spent 4,888,372,930 TL for University Housing. East campus had an expenditure of 963,253,923 TL (See Table 1 of App. B). This constitutes 19.71% of the total housing expenses. 19.71 % of personnel expense figures is assumed to belong to east campus which is 85,451,799 TL.
Bilkent University spent 7,813.18 TL/m^ for personnel expenses in 1992 (See Table 6 of App :B).
3.9. Total Expenditure of the University Housing
A total expense figure is obtained after covering all the expenses that take place in the University housing, (See Table 1 of App. B). This table reports the expenditure that takes place in each campus and also summarizes the expense figures of both campuses.
Bilkent University spent 5,755,463,738 TL for housing in 1992. East campus had an expense of 1,048,705,723 TL constituting 18% of the total expenditures. Also, center campus had an expenditure of 4,706,758,015 TL by being 82% of the total (See Figure 14).
East Campus 1 ,0 4 8 ,7 0 5 ,7 2 3 7
C enter Campus 4 ,7 0 6 ,7 5 8 ,0 1 5 T L
82
%
FIGURE 14 TOTAL HOUSING EXPENDITURE IN 1992
The percentage distribution of all the expenses within the total figures are also reported in Figure C.1 in App. C. As can be seen from the figure, Heating and Hot-water expenses have the highest amount by constituting 35.39% of the total expenditure. Following the heating and hot-water expenses, electricity and Water expenses constitute 20.34% and 16.12% of the total expenditure respectively.
Total expenditure in University Housing should also be reported in terms of TL per square meter. Two campuses having different areas of housing services are also compared to take effective results (See Table 6 in App. B). East campus housing area is currently 12,000 m^. However, it was 7800 m^ in 1992 when a weighted average of them is calculated according to the months when they were available for the academic residents. So, total figure of housing expenditure is divided by 7800 and 45689 m^ respectively to compare TL/m^ expenses of both campuses. In the light of these figures. East and Center campuses have
130,615.08 and 99,016.45 TL/m^ expenditure respectively. Adding up the expenses of both campusand dividing them to the total housing area, 107,308.74 TL/m^ of expense is reported (See Figure 16).
140000- 12X00-100000 - 80000-TL/m2
eoooo
400002 X 0 0 -1X,615c081U n 90X)ia45'IUn Center Canrpus 46689m EastCarrpus 7800m .. W vi., '.'ii ::K-BothCarrpusesFIGURE 16 TOTAL HOUSING EXPENDITURE IN 1992 (TL/M2)
So, Hypothesis IIq in Chapter I is not rejected fur the total figures.
CHAPTER IV
SUMMARY, CONCLUSION AND RECOMMENDATIONS
4.1. Summary
It is crucial to make a review in order to compare the cost-effectiveness of east and center campus housings. In this analysis, all of the cost centers of housing area are searched out in detail to achieve a total expenditure figure for 1992. Data is separated for east and center campus and compared in different terms of unit-cost measurements. Comparisons are reported by pareto, pie and control charts that are the tools for service quality measurement. Hypotheses stated in Chapter I are tested to see whether they are rejected or not in each of the cost centers ( See Table 13).
Some differences appeared between east and center campus when analyzing the cost centers of the housing service. These differences are highlighted in the analysis section.
After examining all of the cost centers, a total figure for the housing expenses is achieved (See App.B, Table 1). The weight of each cost center is reported in percentage distributions.
4.2 Conclusion
In all of the cost centers, an hypothesis appeared; higher the housing area, higher the cost-effectiveness, lower the expense incurred per unit area.
Achieving statistical conclusions will provide Bilkent University to achieve standards on housing services and to set goals in the light of these findings.
Service quality management is an important issue to consider in Housing services. By achieving standards, control will be sustained on expense figures.
The results of the hypotheses are reported in Table 13.
4.3. Recommendations
In addition, there are some points to be recommended to achieve cost- effectiveness in both campuses' cost centers in the future. These points can be summarized as follows;
4.3.1. Cost Control System
A "Cost Control System" should be introduced. Budgeting should be made for each period so that costs will be planned before they occur in the following period. Having controlled planned costs at the beginning of each period will support executives to control service quality. Also, some future projections can be done -including inflation rate- to budget the housing expenses by the help of
computer supported database applications. For further improvement in service quality, some indexes can be added for a more technical analysis.
Cost control is the guidance and regulation of the costs by executive action. It involves not only the ascertainment of current costs, but also a comparison of these with some reliable standard of measurements. It is a process whereby management ensures the organization’s desired ends. It can be defined as a set of organized actions directed towards achieving a specified goal. To bring out particular future events, it is necessary to influence the factors that lie behind those events. Control is the ability to bring out a desired future outcome [Richardson, 47].
The existence of a control process enables management to know from time to time where the organization stands in relation to a pre-determined future position. This requires observation, measurements and re-direction, if there are variations between the actual and desired positions .
4.3.1.1. Cost Control Strategy for Bilkent University
In order to accomplish an effective cost control strategy, management should originate the goals of a cost reduction program. Executives should consolidate the cost-reduction activities into a single organizational function. They should assign a "Cost Reduction Specialist" for the responsibility of achievement of the program’s goals.
• To help to develop, organize and guide the cost control action
• To serve as a communication link in receiving and disseminating ideas and information pertinent to the cost reduction program among Vice-presidency and other executives [Henry, 5]
• To maintain records and measures the results of cost reduction activities and projects
• To make inspections, ensure the overall success of the cost reduction program
The objective of cost control efforts in Bilkent University Housing Complex is to minimize the cost variances in unit-cost measurements by providing information needed by the executives for making decision on planning, directing and controlling.
4.3.2. Budget System
A cost control system and a budgetary system are complementary. In order to achieve an effective cost control system, budgets should be planned for the previous and the following periods, so that the expenses in the cost centers are planned and controlled.
Budget is a plan quantified in monetary terms prepared and approved prior to a defined period usually showing planned income to be generated and expenditure to be incurred during that period, and the capital to be employed to attain that objective [Pizzey, 214].
Bilkent University needs a budget system that calculates future cost estimates for the variable expenses, so that actual results can be compared with the budgeted ones in case of any variances in the cost centers. The comparison of actual results with the budgeted ones should be monitored for each cost center. For Bilkent University Housing Complex, a budget control sheet can be recommended to provide timely feedback on how successfully the plan is being carried out (See Table 14). Where any variances occur, the need for remedial action can be identified, and such action can be organized before it is too late.
4.3.2.1. Cost Estimation for the Budget System
Accurate cost estimation helps management to make informed decisions concerning the incurrence of future costs and how future costs may vary if conditions change.
4.3.2.1.1. Recommended Techniques for Housing Complex Cost Estimation
Some graphical techniques can be used for future projections for the cost estimation in Housing Complex. Scattergraphs and High-low cost estimates use past cost behaviors and their relation to some activity measure to estimate future costs. A scattergraph is a plotting of past-costs along the vertical axis and of some activity measure along the along the horizontal axis. If the points fall into a roughly linear pattern, a line can be estimated to fit these points into a model of simple regression.
Another method that can be used for cost estimation is ordinary least squares regression. Like the scatter graph approach, post data are used in least squares regression. All of the data points can be used to estimate future variable costs [Deakin, 386].
4.3.2.2. Standard Cost System
Standards are estimates. As such, they may not reflect the conditions that actually occur. If prices and operating methods are frequently changing, standards may be constantly out of date. Standards should be revised periodically, thus variances will occur because conditions change during the year, but standards do not [Deakin, 766].
A standard cost system can be recommended to Bilkent University Housing Complex which is a technique whereby standard costs are pre-determined and subsequently compared with the actual costs as recorded.
Pre-determined standard costs provide [Pizzey, 277]:
• Economy of calculation
• Early availability of cost information
• The ability to anticipate the changing conditions
• Standard costs adjusted in line with the current conditions provide an excellent basis for the preparation of estimates
4.3.2.2.1. Recommended Ratios for Standard Costs
Bilkent University Housing complex can use, Volume or Activity Ratio which is, Actual expenses over budgeted expenses. Also standard deviations of the difference between actual and budgeted results can be used a comparison tool for the cost variances. Actual fuel-oil expenses can be compared to the budgeted estimates to see if this cost center is in control.
4.3.3. Responsibility Center
A responsibility center exists to accomplish one or more purposes, the objective of an individual responsibility center is intended to help to achieve the overall goals of the whole organization [Anthony, 186].
A "Responsibility Center" which is directly responsible for reporting to executives should be established. It should be a specific unit of the university assigned to prepare expenditure data for the housing complex. Responsibility Center is needed for effective cost management .Budgets for performance evaluation and cost control are typically organized around the responsibility centers.
Establishment of a responsibility center for the Housing Complex will enhance the implications of the points discussed above.
4.3.4. Management Information Systems (MIS)
Information systems essentially transform information into a form usable for coordinating the flow of work in a firm, helping managers to make decisions and solving other kinds of problems.
"The system that monitors and retrieves data from the environment, captures data from transaction and operations within the firm, filters, organizes and selects data and presents them information to managers, and provides the means for managers to generate information as desired is called the Management Information System." [Murdick, 123]. MIS is the combination of human and computer based resources that results in collection, storage, retrieval, communication and use of data for the purpose of efficient management of operations and for business planning [Lucey, 1].
Information systems accomplish this through a cycle of three basic activities; input, processing and output. Input, entails capturing or collecting raw data sources from within the business or from its external environment. Processing covers converting this raw input into a more appropriate and useful form. Output entails transferring the processed information to the people or business activities that will use it.
Within the useful functions of Management Information Systems, Bilkent University needs a network application not only for the housing complex but for all of the cost centers in the university. Management Information Systems will help executives to be aware of the expense figures whenever they want. Any cost
variances between the cost centers of each campus will be realized and instantaneous remedies will be set for the future. This will save Bilkent University from any delay in decision making in housing services. Executives will not be supposed to wait for the end of the accounting period for decision making.
4.3.4.1. What can be Recommended as a MIS for Bilkent University
Management Information Systems, as a concept has a lot of applications. It is important to select a computer-based network system to accomplish MIS’s features.
Local Area Network (LAN) is a transmission network encompassing a limited area such as a single building or several buildings in close distance, widely used to link personal computers so that they can share information. Local Area Network can be established in Bilkent University by providing a file-server that is a computer with a large capacity memory (hard disk) and a network software (Novell 3.11) can be used to be placed in the file-server to connect personal computers used in the university. Local Area Network for the cost management can have access to a maximum forty users by installing ethernet cards into the computers. Costs that appear in network installation are ; Cable costs (5000TL/m), Cost of the file-server ($3000) , each personal computer is to be modified ($300/each), and the software package cost ($2500).
The users of the Local Area Network system will be the executives of the university and the employee who are responsible of inputting accounting data. By
this method , positive feedback will be taken in a short time to prevent periodic variations in the cost centers.
As a result, the intentions of the Management Information Systems to Bilkent University can be summarized as follows:
• To ensure that consistent and reliable information is instantly available to managers
• To identify deviations and to indicate possible causes of cost variations • To provide a basis for planning and budgeting
• To help users get the maximum value out of the business of collecting, recording and using the data
In the light of these circumstances. Management Information Systems should be assigned to a coordinator in the use of the system and its purposes, and latter calling a meeting off staff in each department to explain the importance of using accurate data. Staff should be involved by receiving data on themselves which they would then check for accuracy. Decisions had to be made on where the computer should be housed and who should have access to it.
4 .3 .5 . Responsibility Accounting
As a final issue to summarize all of these recommendations, a term, "Responsibility Accounting" can be used to fulfill the requirements discussed above.
REFERENCES
1. Anthony, R. Dearden, J. Bedford, N. Manaaament Control Systems. IRWIN. Homewood Illinois, 6th ed. 1989.
2. ed. Bell, J. Accounting Control Systems. Markus Wiener Publish , 2nd ed. New York 1990.
3. Birnbaum, R. How Colleges W ork. Jossey, Bass Publisher, San Fransisco 1989.
4. ed. Brinker, J.B. Emerging Practices in Cost Management. Warren, Gorham & Lamont, New York 1990.
5. Deakin E.B., Maher M.W., Cost Accounting. 2nd edition, IRWIN Homewood, Illinois 1987.
6. Encyclopedia Americana. Vol 1, 7, 1984 U.S.A.
7. Encyclopedia Britannica. Vol 3, 1977 U.S.A.
8. Fisher, J.L., Tack, W.M., Wheeler, K., The Effectiye President. Collier Mac Millan Publishers, London 1988.
9. Henry, D. Handbook of Cost Reduction Technioues. Franklin Watts, New York 1986.
11. ed. Locke, Lanning, Scribbins, Tresman, Waitt, College Administration. A Handbook. 2nd ed. Longman, Essex 1988.
12. Lucey, T., MIS. 5th ed. DP Publishers, Hampshire 1987.
13. Me Leod, R., MIS. A Study Of Computer Based Information Systems. 4th ed., Mac Millan Publishing Company, Canada 1990.
14. Murdick, B., MIS. Concepts and Design. 2nd ed., Prentice Hall, New Jersey 1986.
15. Pizzey A., Principles of Cost Accountancy. A Managerial Perspective. 5th edition, ELBS Great Britain 1987.
16. Richardson, P.R., Cost Containment. The Free Press, Collier Mac Millan Publishers, London 1988.
17. Sweeny,H., Rachin, R., Handbook of Budgeting. John Wiley & Sons, New York 1987.
18. Tuckman, B.W., Effective College Management. Proager, New York 1987
OPERATING EXPENSES IN UNIVERSITY HOUSING COMPLEX
1. Personnel Costs (TL/month)- Salaries, Wages, Meal, Clothing Transportation
a. Permanent Personnel b. Temporary Personnel c. Labor
d. Security juards
2. Water Consumption Expenses- Cold Water (m3/month, m3/m2.month))
3. Heating and Hot Water- Fuel (kg/month, kg/m2,month)
4. Maintenance Costs (TL/month, TL/m2.month)- Data available from Construction Unit
a. Electric Breakdowns b. Plumbing Breakdowns c. Construction
d. Carpentry
5. Electricity Expenses (kwh/month, kwh/m2.month)
a. Electricity Expenses that University is supposed to pay (excluding the payment of the academic residents).
b. Electricity Expense in the Environment ( Bulbs of basement and stairs etc.)
6. Overhead Costs (TL/month, TL/m2.month)- Main fixtures, consumer durables and furniture in the housings
- Data available from Purchasing Department
7. Other Utility Expenses ( TL/month, TL/m2.month) - Data available from Purchasing Department