WAGE RIGIDITY AND INFORMALITY IN THE LABOR MARKET
IN TURKEY
Seyfettin Gürsel*, Gökçe Uysal ve Ayşenur Acar Executive Summary
International comparisons show that the formal labor market in Turkey is rather rigid regarding the wage level. This research brief analyzes the wage rigidity in the formal labor market based on the earnings of formal workers in the private sector. Using a similar methodology to that of the OECD, we calculate the ratio of minimum gross wage to median earnings to be 0.80. This is rather high ratio indicates a high wage rigidity. However, when regional labor markets are considered, the level of rigidity varies a lot. For example, while the ratio of gross minimum wage to median earnings is well below the country average in Istanbul and Ankara, it becomes close to one in number of regions, particularly in the Southeast.
A simple computation shows that the correlation between the wage rigidity and the informality is quite high, and much higher in the services than in the industry. In order to increase the competitiveness of the industry in Turkey and to accelerate economic development in less developed regions, the wage rigidity across regions should be evaluated with a view of economic rationality. Moreover, the relation between the wage rigidity and informality should be scrutinized more closely.
The concept of wage rigidity, methodology and data base
In our research brief titled “Labor Market Outlook” in May, we compared Turkey with OECD countries in terms of the ratio of gross minimum wage to median gross wage and pointed out that this ratio was the highest among the OECD members at 0.71 in 2011.1 The ratio of minimum wage to median wage is considered to be an indicator of wage rigidity in the labor economics literature. The closer the minimum wage to the median wage, the more rigid the labor market. The minimum wage determines a safety net for a worker whatever their labor productivity. If the minimum wage is set close to the median wage, the number of workers with productivity below the minimum wage will be larger. In this case, firms willing to hire these workers will be discouraged.
Economic theory asserts that employment will be constrained under these conditions. However, in the labor markets where labor laws are not fully implemented, this kind of wage rigidity can possibly encourage informality instead of limiting the hiring. Despite the eventuality of facing fines, firms may prefer to use part of its workers, the less productive ones, informally, i.e. by avoiding registering them at the Social Security Institution. Doing so decreases labor costs considerably. Finally, wage rigidity emerges as one of the factors determining the extent of the informal segment where an absolute flexibility prevails.
Comparisons among national labor markets using national median wage could give an idea about the average rigidity of national labor market with respect to other markets. However, wage rigidity can vary considerably between regions of a national labor market. Turkey is a good example. While the formal labor market in Turkey is the most rigid among the OECD countries in this measure, the picture is ** Prof. Dr. Seyfettin Gürsel, Betam, Direktör, [email protected]
Yrd. Doç. Dr. Gökçe Uysal, Betam Direktör Yardımcısı, [email protected] Ayşenur Acar, Betam, Araştırma Asistanı, [email protected]
1 OECD uses median earnings. The World Bank Report released on May 27th, 2013, titled “Turkey - Managing the Labor
Markets through the Economic Cycle” emphasizes that Turkey has the highest ratio (0.71) of minimum wages to median earnings among the OECD countries.
Research Brief 13/152
quite different across its regions. The scope of this research brief is to shed light on the rigidity of regional labor markets within Turkey and try to estimate the extent to which it affects informality. Since we focus on wage rigidity, we limit our analysis to full time wage earners in the private sector. We consider the ratio of gross minimum wage (the cost of labor to the firm) to median earnings, the concept of rigidity being related to firm’s behavior. The earnings include overtime and other side payments and hence are slightly higher than gross wages but the difference is negligible in our framework. Admittedly, it would have been preferable to use the median gross wages instead of median earning. However, this requires firm level data, which entails under reporting: firms declaring part of their workers at minimum wage while they receive de facto higher wages. So we use the micro data of Labor Household Surveys (of 2011, the latest data available) where the wage earners declare their net earnings. So, we have to translate the net earnings to the gross earnings. In order to estimate gross earnings we use the methodology developed by OECD for this purpose by adding estimated income taxes and social security premiums to the net earnings.2
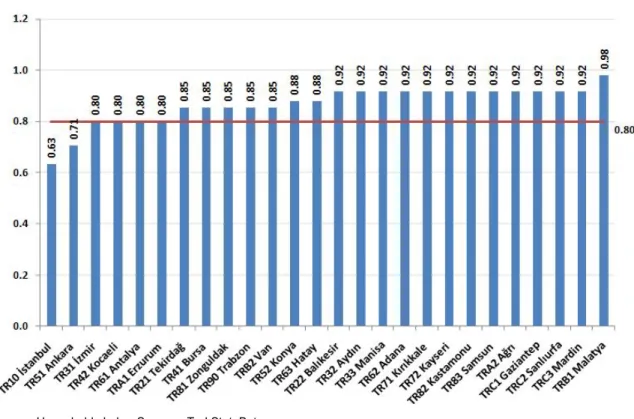
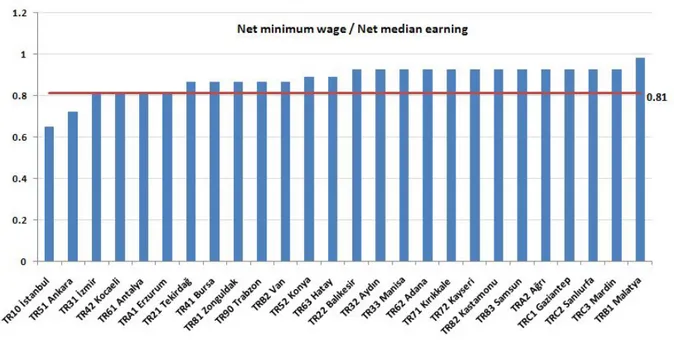
Ratio of minimum wage to median earnings is quite high in the formal labor market According to micro data of 2011 Household Labor Surveys the ratio of the gross minimum wage to gross median earnings is 0.80 (Figure 1). Using net wages yields similar results: The ratio of net minimum wage to net median earnings is calculated to be 0.81 (Figure App 1 in Appendix).
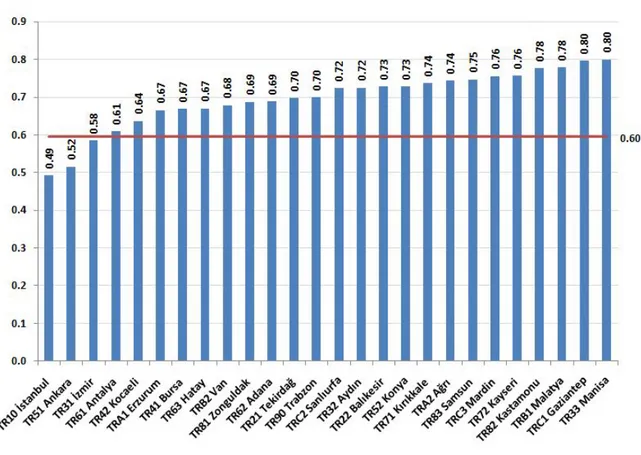
In the economics literature, using median wages is preferred to using average wages since wages are not normally distributed. High wages, albeit a few, raise the average wages (or earnings) significantly. Therefore, the median provides a better measure of central tendency, as it is less affected by outliers. However, we computed the ratios of gross minimum wage to average earnings as well (Figure 2). Since average median earnings is larger than median earnings, the ratio decreases to 0.60 at the national level. When we exclude the labor taxes the outcome does not change significantly. Net minimum wage / net average earnings is computed at 0.62 (Figure App 2 in Appendix).
Figure 1 The ratio of gross minimum wage to gross median earnings across regions (2011)
Source: Households Labor Surveys; TurkStat, Betam
Note: Only full time wage earners in the private sector are considered.
2 We can provide the table created and published by OECD (www.oecd.org/els/social/workincentives ). Different ratios are
calculated for 21 different earning ranges. According to the calculation, net average earning and net median earning increased 34 percent and 31 percent, respectively.
To summarize, using the net or gross earnings, means or medians, changes only the levels but not the gist of the issue. So, we use the ratios of the gross minimum wage to gross median earnings across regions then we will repeat this analysis by using regional average earrings.
Wage rigidity increases from West to East
Figure 1 ranks the ratios of gross minimum wage to gross median earnings in the each region from the lowest to the highest in 2011, in other words from less rigid to more rigid. Most of the regional ratios are over the national average of 0.80. The ratios for İstanbul and Ankara regions are important exceptions. These regions constitute an important part of total employment. The other regions have ratios that are closer to the national average or above. The ranking is generally evolves from West to the East, as expected. However, it is worth noting that in some industrialized regions of the West like Balıkesir, Aydın, Manisa, the level of the wage rigidity is quite close to those of Eastern regions. When the average gross earnings are considered instead of gross median earnings, regional
differences become even more apparent (Figure 2). Let us point out that average earnings are always higher than the median earnings. Manisa and Gaziantep, the former in the West and the latter in the Southeast, have the highest ratios. In other words, average wages are much closer to the median wages in these two regions than others. These two regions are also among the most industrialized regions. Indeed, the shares of industrial employment in full time non-agricultural employment are 53.1 percent for Manisa and 50.4 percent for Gaziantep. These shares are well above the national average of 38.7 percent. 3
Figure 2 The ratio of gross minimum wage to gross average earnings (2011)
Source: Households Labor Surveys; TurkStat, Betam
Note: Only full time wage earners in the private sector are considered.
3 The 5 regions with the highest share of full time and formal wage earners in private manufacturing sector in full time and formal
wage earners in private non-agricultural sector are as follows: Tekirdağ-Edirne-Kırklareli (64.9 percent), Bursa-Eskişehir-Bilecik (56.9 percent), Kocaeli-Sakarya-Düzce-Bolu-Yalova (54.3 percent), Manisa-Afyon-Kütahya-Uşak (53.1 percent), Gaziantep-Adıyaman-Kilis (50.4 percent). Given the fact that higher ratios of Manisa and Gaziantep regions than Tekirdağ, Kocaeli and Bursa regions, we suppose that composition of manufacturing in these regions is different.
We can summarize the wage rigidity across regions as follows: Admittedly, the value of the consumption basket based on nominal prices is higher in more developed regions than in
underdeveloped ones. In other words, the cost of life increases with the level of development, but so do incomes. Skilled labor which is a factor of economic development as well as its outcome is much more abundant in the West than in the East. All of these factors indicate that net minimum wage as a safety net is not sufficient in the more developed regions while gross minimum wage is relatively low for the firms. On the other hand, we observe that the more developed the region, the closer the median earnings to the minimum wage.
Note that in the East and Southeast the minimum wage is very close to the median earning, with some exceptions. This means that a large majority of the formal wages in these regions is set at the level of the minimum wage or very close to it. We conclude that the minimum wage is relatively high in these regions.
Wage rigidity affects the size of the informality
The informality (workers not registered at the Social Security) remains still high in Turkey despite the decrease in recent years. The share of unregistered workers declined from 32 percent in 2004 to 25 percent in 2011.4 Informality continues to be an important structural problem in the labor market in Turkey. As we mentioned above, one should expect that wage rigidity in the private sector affects the size of the informality. In order to provide some insight on this effect, we calculated the correlation between wage rigidities and informality ratios (unregistered wage earners / total wage earners) in the private sector.
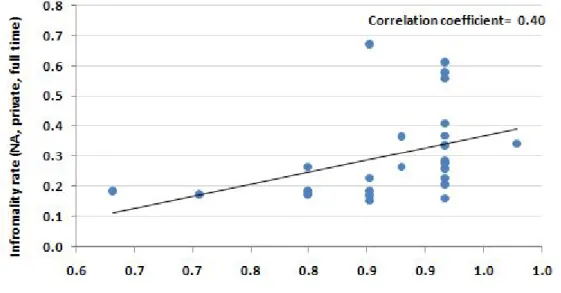
The correlation coefficient is estimated at 0.40 for 2011 (Figure 3). This rather high coefficient shows that wage rigidity affects the size of informality and at the same time points to the existence of other factors affecting informality. For example we know that firm size is negatively correlated with informality. Therefore, the unequal distribution of the big firms across regions would also affect the distribution of regional informality.
Figure 3 Correlation between wage rigidity and the size of informality among 26 regions (2011)
Source: HLS TurkStat, Betam
Note: Only full time wage earners in the private sector are considered.
However, the striking aspect of the correlation is the big difference between the industrial and service sectors with regards to the effect of wage rigidity effect on informality. Indeed, when correlations are computed for each of these two sectors, the coefficients differ significantly. For the industrial sector the correlation coefficient is limited to 0.13, while it reaches 0.57 in the service sector. The result is clear: Wage rigidity affects the size of informality very weakly in the industry while it is an overwhelming factor in services.
This is an interesting finding. Before suggesting some possible hypothesis about the issue, let us note that the share of informality is 0.18 percent in industry and 0.23 percent in services among the full time wage earners working in the private sector (Table App 2 in Appendix). One of the factors explaining lower informality in the industrial sector compared to services could be the difference in average firm sizes between these two sectors. We noted above that there is a negative correlation between informality and firm size. However, this factor cannot explain fully the reason why wage rigidity has a weaker effect on informality in the industrial sector.
Figure 4 Correlation between wage rigidity and informality ratio by sector (2011)
Source:: HLS TurkStat, Betam
Note: Only full time wage earners in the private sector are considered.
The analysis must be deeped by taking other possible factors into consideration. For example, it is possible that access to banking loans matter more for industrial firms than for the firms in services, thus industrial firms are more inclined to create informal jobs to lower their production costs. Another possibility is the existence of a more severe monitoring in industry than in services.
Concluding remarks and policy recommendations
The conclusions and policy recommendations regarding competitiveness and the fight against informality can be summarized in two points:
1- Wage rigidity, as defined in this research brief (minimum wage / median earning) is quite high in Turkey compared to its competitor countries. This is caused by very high rigidity ratios prevailing in the underdeveloped regions in the East and Southeast as well as in some industrial centers of the West. Current regional investment subsidies like social security premium exemptions aim, among other goals, to mitigate these high wage rigidities. Nevertheless, these subsidies place a burden on public finances. So, regionalization of the minimum wage should be included in the reform agenda of the government and this issue should be debated disregarding ideological arguments. We can suggest to leave the setting of the minimum wage in each 26 regions to the collective decision of regional social partners and regional development agencies representing the public authority.
2- We do not know the extent to which wage rigidity is constraining employment. In this research brief, we investigated the effect of wage rigidity on the size of informality using a simple
correlation. The striking result is the weak effect of the wage rigidity on informality in the industrial sector while this effect is quite important in the service sector. This work is clearly not sufficient. The factors encouraging informality should be analyzed separately in each sector. The existence of a relatively high informality in the labor market in Turkey continues to be an important structural problem that affects efficient functioning of the economy adversely through multiple channels like ability to access to banking credits and to reach optimal scales. It is worthy to make more comprehensive research on the effects of the wage rigidity on the size of informality.
Appendix
Figure App 1 The ratio of net minimum wage to net median earnings (2011)
Source: Households Labor Surveys; TurkStat, Betam
Note: Only full time wage earners in the private sector are considered.
Figure App 2 The ratio of net minimum wage to net average earnings (2011)
Source: Households Labor Surveys; TurkStat, Betam
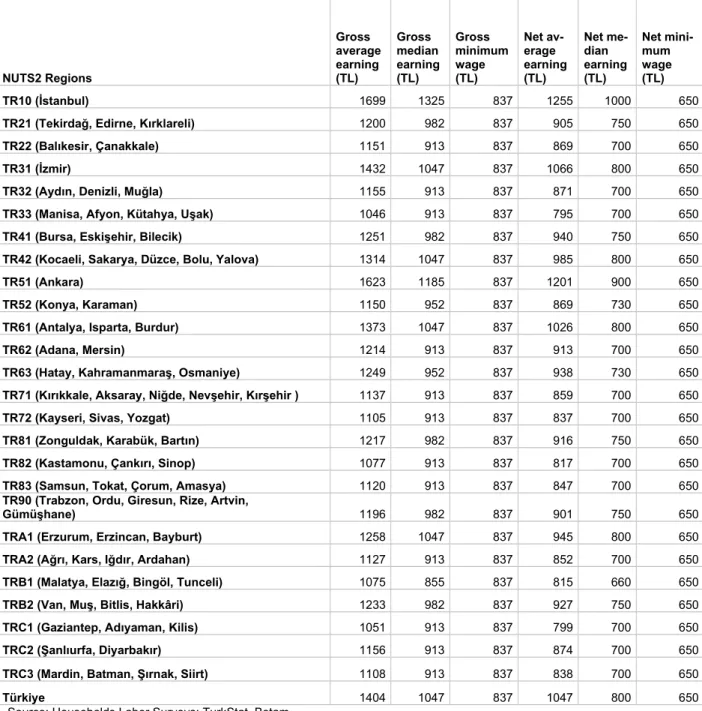
Table App 1 Gross average & median earnings and net average & median earnings NUTS2 Regions Gross average earning (TL) Gross median earning (TL) Gross minimum wage (TL) Net av-erage earning (TL) Net me-dian earning (TL) Net mini-mum wage (TL) TR10 (İstanbul) 1699 1325 837 1255 1000 650
TR21 (Tekirdağ, Edirne, Kırklareli) 1200 982 837 905 750 650
TR22 (Balıkesir, Çanakkale) 1151 913 837 869 700 650
TR31 (İzmir) 1432 1047 837 1066 800 650
TR32 (Aydın, Denizli, Muğla) 1155 913 837 871 700 650
TR33 (Manisa, Afyon, Kütahya, Uşak) 1046 913 837 795 700 650
TR41 (Bursa, Eskişehir, Bilecik) 1251 982 837 940 750 650
TR42 (Kocaeli, Sakarya, Düzce, Bolu, Yalova) 1314 1047 837 985 800 650
TR51 (Ankara) 1623 1185 837 1201 900 650
TR52 (Konya, Karaman) 1150 952 837 869 730 650
TR61 (Antalya, Isparta, Burdur) 1373 1047 837 1026 800 650
TR62 (Adana, Mersin) 1214 913 837 913 700 650
TR63 (Hatay, Kahramanmaraş, Osmaniye) 1249 952 837 938 730 650
TR71 (Kırıkkale, Aksaray, Niğde, Nevşehir, Kırşehir ) 1137 913 837 859 700 650
TR72 (Kayseri, Sivas, Yozgat) 1105 913 837 837 700 650
TR81 (Zonguldak, Karabük, Bartın) 1217 982 837 916 750 650
TR82 (Kastamonu, Çankırı, Sinop) 1077 913 837 817 700 650
TR83 (Samsun, Tokat, Çorum, Amasya) 1120 913 837 847 700 650
TR90 (Trabzon, Ordu, Giresun, Rize, Artvin,
Gümüşhane) 1196 982 837 901 750 650
TRA1 (Erzurum, Erzincan, Bayburt) 1258 1047 837 945 800 650
TRA2 (Ağrı, Kars, Iğdır, Ardahan) 1127 913 837 852 700 650
TRB1 (Malatya, Elazığ, Bingöl, Tunceli) 1075 855 837 815 660 650
TRB2 (Van, Muş, Bitlis, Hakkâri) 1233 982 837 927 750 650
TRC1 (Gaziantep, Adıyaman, Kilis) 1051 913 837 799 700 650
TRC2 (Şanlıurfa, Diyarbakır) 1156 913 837 874 700 650
TRC3 (Mardin, Batman, Şırnak, Siirt) 1108 913 837 838 700 650
Türkiye 1404 1047 837 1047 800 650
Source: Households Labor Surveys; TurkStat, Betam
Informal-ity rate in NA sector (%) Informality rate in manu-facturing sec-tor (%) Average earn-ing in manu-facturing sec-tor (TL) Median earn-ing in manu-facturing sec-tor Informal-ity rate in service sector (%) Aver-age earning in ser-vice sector (TL) Me-dian earn-ing in service sector (TL) TR10 (İstanbul) 0.18 0.23 1487 1172 0.14 1829 1325
TR21 (Tekirdağ, Edirne, Kırklareli) 0.17 0.07 1228 982 0.29 1121 926
TR22 (Balıkesir, Çanakkale) 0.23 0.12 1199 982 0.23 1102 913
TR31 (İzmir) 0.19 0.14 1417 1047 0.21 1443 1047
TR32 (Aydın, Denizli, Muğla) 0.20 0.11 1094 855 0.23 1191 913
TR33 (Manisa, Afyon, Kütahya, Uşak) 0.16 0.09 1038 913 0.19 1059 913
TR41 (Bursa, Eskişehir, Bilecik) 0.15 0.10 1269 1047 0.19 1216 982
TR42 (Kocaeli, Sakarya, Düzce, Bolu, Yalova) 0.17 0.09 1329 1047 0.24 1256 982
TR51 (Ankara) 0.17 0.13 1712 1299 0.17 1553 1185
TR52 (Konya, Karaman) 0.27 0.21 1109 913 0.28 1187 982
TR61 (Antalya, Isparta, Burdur) 0.18 0.16 1369 1047 0.18 1352 1047
TR62 (Adana, Mersin) 0.37 0.33 1321 913 0.37 1180 913
TR63 (Hatay, Kahramanmaraş, Osmaniye) 0.36 0.26 1143 913 0.43 1281 952
TR71 (Kırıkkale, Aksaray, Niğde, Nevşehir, Kırşehir ) 0.28 0.17 1192 982 0.31 1095 913
TR72 (Kayseri, Sivas, Yozgat) 0.34 0.21 1078 913 0.32 1082 913
TR81 (Zonguldak, Karabük, Bartın) 0.18 0.10 1334 982 0.22 1106 913
TR82 (Kastamonu, Çankırı, Sinop) 0.26 0.16 1015 913 0.30 1088 913
TR83 (Samsun, Tokat, Çorum, Amasya) 0.28 0.20 1033 881 0.28 1128 913
TR90 (Trabzon, Ordu, Giresun, Rize, Artvin,
Gümüşhane) 0.23 0.13 1065 913 0.25 1166 913
TRA1 (Erzurum, Erzincan, Bayburt) 0.27 0.24 1137 1047 0.24 1231 982
TRA2 (Ağrı, Kars, Iğdır, Ardahan) 0.61 0.46 1113 913 0.45 1054 881
TRB1 (Malatya, Elazığ, Bingöl, Tunceli) 0.34 0.23 1001 855 0.31 1094 855
TRB2 (Van, Muş, Bitlis, Hakkâri) 0.67 0.55 1159 982 0.51 1174 913
TRC1 (Gaziantep, Adıyaman, Kilis) 0.41 0.34 1031 913 0.39 1077 913
TRC2 (Şanlıurfa, Diyarbakır) 0.56 0.52 1145 913 0.51 1120 913
TRC3 (Mardin, Batman, Şırnak, Siirt) 0.58 0.53 1166 1047 0.54 1074 877
Türkiye 0.24 0.18 1326 1047 0.23 1452 1047 Source: Households Labor Surveys; TurkStat, Betam