Executive summary
Turkish economy has been driven into recession due to internal dynamics as well as due to the global crisis. betam estimates that the growth rate in the last quarter of 2008 was around -2 percent. We expect that the current recession will continue into the first quarter of 2009. However, from the second quarter on, a moderate revival driven by the domestic demand will begin. We predict that the number of unemployed, which is more than 2 million and 600 thousand at the moment, will exceed 3 million towards the end of the year and that the non-agricultural unemployment rate will rise from 14 to 17 percent, a historical high in Turkey.
Exports have been decreasing since October. However, taking into account the decline in imports due to price and quantity effects, we predict that the current account deficit will keep decreasing. If the recession stays at reasonable levels in the first half of 2009 and oil prices are kept around 50 dollars, we expect the monthly current account deficit to recede to 1 billion dollars. Capital outflows will pose pressure on the demand for foreign currencies. The reduction of portfolio investments and the possible failure of domestic banks and firms to renew their foreign currency credits (around 20-30 percent) will require further financing of the external payments of a size between 40-50 billion dollars. We think that the adjustment of the exchange rate has come to an end and the depreciation of TL will stabilize between 20-25 percent, assuming that the government signs an agreement with the IMF.
Tax revenues in the budget are calculated assuming a high growth rate. However, in 2009, GDP growth is most likely to be around zero, in which case the indirect tax revenues will not rise in real terms. Moreover, it is doubtful that the tax base will widen. If expenditures are not abated during 2009, the budget deficit will be three times the amount expected. The ratio of budget deficit to GDP is likely to exceed 3 percent.
It is very likely that the increase in the end-of-year CPI will be below the target level at 7.5 percent revised in May of 2008. If the expectations are met -oil prices around 50 dollars, a mild revival from the second half of the year on and maintaining the IMF and EU anchors, the inflation will be below 7 percent at the end of 2009.
The CBRT has recently made large interest rate cuts. We observe a remarkable fall in the expected real interest rate, which is still high at 8 percent, given that we are in recession. The CBRT wants to continue loosening its monetary policy. However, this depends on the stability of exchange rate and on whether the market rate follows the policy rate. We expect a further but limited decrease in the policy rate in February 2009.
Macroeconomic Outlook 09/01
Growth and Employment
We expect that the current recession will continue into the first quarter of 2009. However, from the second quarter on, a moderate revival driven by the domestic demand will begin. We predict that the number of unemployed, which is more than 2 million and 600 thousand at the moment, will exceed 3 million towards the end of the year and that the non-agricultural unemployment rate will rise from 14 to 17 percent, a historic high in Turkey.
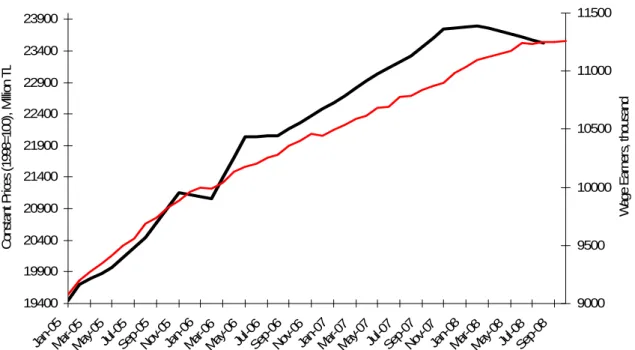
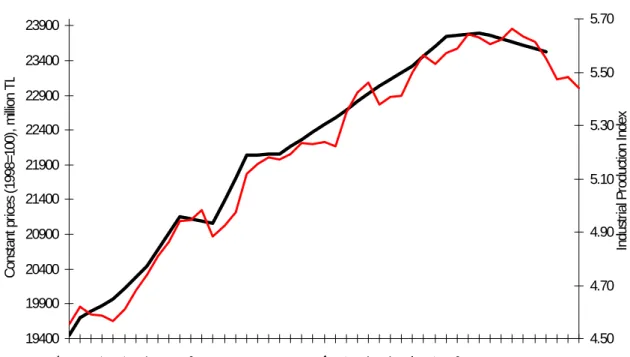
Turkish economy has been driven into recession due to internal dynamics as well as due to the global crisis. It is impossible to confirm the recession with the official data at the moment, since the GDP figures are released with a 3-month delay. According to the most recent growth data of the third quarter of 2008, Turkish economy grew only by 0.5 percent annually. In the third quarter, when foreign trade had not yet been affected by the global crisis, private consumption and private investments fell by 0.2 and 10 percent compared to the previous year, respectively. Taking a close look at the seasonally adjusted data of industrial production, non-agricultural employment and the number of non-agricultural wage-earners, all of which are considered to be leading growth indicators (figures 1, 2 and 3), we observed that the growth of the non-agricultural GDP has been contracting since the first quarter of 2008 and the industrial production since May. While the non-agricultural employment started to decline in August, the number of wage-earners has been more or less stagnating since June 2008. However, the number of wage-earners has been on an upward trend as a result of high growth rates and further modernization of the economy (Figure 1). According to these indicators, it is clear that the economy started to shrink in the fourth quarter. betam estimates that the growth rate in the last quarter of 2008 was around -2 percent.
Given that the Turkish banking system does not hold the so-called toxic papers and that the TL had not
depreciated yet in the third quarter, it is striking that there was a decline in private consumption and investments at that time. In our view, this downturn was in large part due to widespread pessimism and worsening
expectations. Moreover, the implausible attitude of the government that the country would not be affected by the global recession could be another factor deteriorating the loss of confidence. With the upcoming local elections in March, the government assumed 4 percent GDP growth in the 2009 budget, rendering the budget unrealistic. In addition to this partly political maneuver, the government’s hesitation in signing a new stand-by agreement with IMF gave the impression that the government lacks a plausible and effective strategy against the recession. At the time this report is being written (26 January, 2009), the negotiations with IMF are still underway.
Since October, the global crisis has been affecting the Turkish economy directly. Because of the capital outflows, Turkish Lira has depreciated by around 30 percent against the currency basket consisting of 1 Euro and 1 Dollar. Exports have declined. Imports have declined faster because of the global deflation, the domestic recession and the depreciation of TL. Therefore, in the fourth quarter, the contribution of the net exports to the GDP growth will be positive, as it was in the third quarter. Nevertheless, this positive contribution will hardly compensate the expected decrease in the private consumption and investments. We think that the domestic recession that began in the last quarter of 2008 will continue into the first quarter of 2009. Thus, we expect negative growth around -3 percent in the first quarter of 2009.
The main cause of the recession in Turkey has been the fall in domestic demand, which resulted from the crisis of confidence. Recovery from the loss of confidence is only possible through re-initializing the EU anchor and finalizing the stand-by with IMF domestically and through the upturn from the recession in the US economy internationally. If the negotiations with IMF are finalized in February at the latest, and if the AKP (JDP)
government revives the EU membership process with concrete steps, we could expect a moderate revival in the domestic demand right after the local elections, especially in the demand for durable consumer goods. As explained in the monetary policy section below, loosening the monetary policy will help this revival.
After last year’s small upswings, unemployment will unavoidably explode this year due to the recession. The main characteristic of the labor market in Turkey is the increase of the non-agricultural labor force by approximately 500 thousand people every year. Given that the current size of non-agricultural labor force is 18 million, the annual growth of labor force is 3 percent. This huge growth is driven by the population growth, by the stable increase in the labor force participation of women and by the rural-urban migration. According to our calculations, 6 percent of non-agricultural GDP growth rate is necessary to absorb the aforementioned labor force surplus. Even if the Turkish economy does not shrink next year, it will not grow. Therefore, the non-agricultural
added worker effect in the last labor statistics. From September to November 2008, the non-agricultural labor force surplus jumped to 650 thousand. We predict that the number of unemployed, which is more than 2 million and 600 thousand at the moment, will exceed 3 million towards the end of the year and that the non-agricultural unemployment rate will rise from 14 to 17 percent, a historical high in Turkey.
Figure 1 Employment of the non-agricultural wage-earners and GDP Growth (Seasonally Adjusted)
19400 19900 20400 20900 21400 21900 22400 22900 23400 23900 Jan-05Mar-0 5 May-05Jul-0 5 Se p-05 Nov-05Jan-06Mar-0 6 May-0 6 Jul-06Sep-06Nov-06Jan-07Mar-0 7 Ma y-07Jul-07 Se p-07 Nov-07Jan-0 8 Mar-0 8 May-0 8 Jul-0 8 Se p-08 Con st an t P ric es (1 998= 10 0) , M illio n T L 9000 9500 10000 10500 11000 11500 W ag e E ar ner s, th ou sa nd
Non-Agricultural GDP (Quarterly) Non-Agricultural Wage Earners (Monthly) Source: TURKSTAT and betam
Figure 2 Non-agricultural Employment and GDP Growth (Seasonally Adjusted)
19400 19900 20400 20900 21400 21900 22400 22900 23400 23900 Jan-05Mar-05May-05Jul-0 5 Sep-05 Nov-05Jan-06Mar-0 6 Ma y-06Jul-06 Sep-06Nov-0 6 Jan-07Mar-0 7 May-0 7 Jul-07Sep-07Nov-0 7 Jan-08Mar-0 8 May-0 8 Jul-08Sep-08 C ons ta nt P ric es (1 998= 100) , M illion T L 13900 14400 14900 15400 15900 W age E ar ner s, thous and
Figure 3 Industrial Production Index and GDP Growth (Seasonally Adjusted) 19400 19900 20400 20900 21400 21900 22400 22900 23400 23900 Jan-05 Mar-0 5 May-05Jul-0 5 Sep-05 Nov-0 5 Jan-06Mar-06May-06Jul-0 6 Sep-06 Nov-0 6
Jan-07Mar-07May-07Jul-07
Sep-07 Nov-0 7 Jan-08 Mar-08May-08Jul-0 8 Sep-08 Nov-0 8 C ons tant pr ices (199 8= 10 0) , m illi on T L 4.50 4.70 4.90 5.10 5.30 5.50 5.70 Indu st ria l P rod uc tion Inde x
Non-agricultural GDP (quarterly) Industrial Production Index (3 months moving average) Source: TURKSTAT and betam
External Balance and the Exchange Rate
Taking into account the decline in imports due to price and quantity effects, we predict that the current account deficit will keep decreasing. We think that the adjustment of the exchange rate has come to an end and the depreciation of TL will stabilize between 20-25 percent.
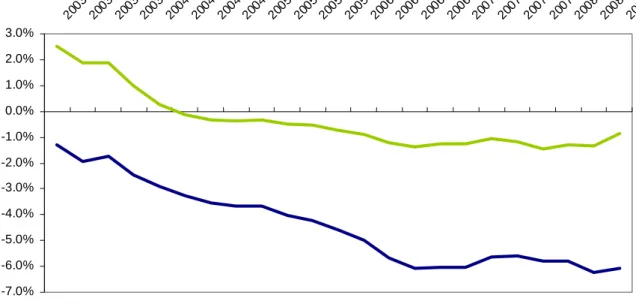
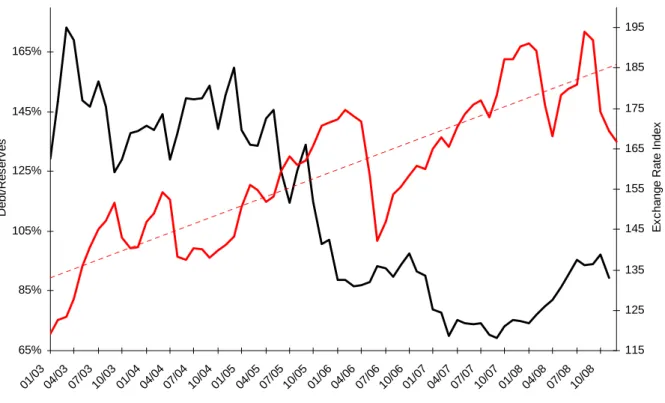
Rising current account deficit (Figure 4) on one hand, rising short-term foreign debt-net international reserves ratio (Figure 6) on the other, have caused a necessary adjustment of the value of TL. The ratio of current account deficit to GDP had exceeded 6 percent by the end of 2007 (Figure 5). Also, the real exchange rate increased considerably above its normal trend during the summer since the court case against AKP ended without a closing as it was feared (Figure 6). The unavoidable correction took place in October and it was more severe than expected. TL depreciated by around 30 percent against the basket consisting of 1 Euro and 1 Dollar.
Parallel to the sizeable decreases in oil and commodity prices, current account deficit has begun to decrease in September and has fallen even faster in October and November (Figure 4). The quarterly data shows that in the third quarter of 2008, the ratio of current account deficit to GDP and current account deficit excluding energy to GDP have begun to decline from 6.2 to 6 percent and from 1.3 to 0.8 percent, respectively (Figure 5).
Exports have been decreasing since October. However, taking into account the decline in imports due to price and quantity effects, we predict that the current account deficit will keep decreasing. If the recession is limited to negative 3 percent in the first quarter of 2009 and oil prices are kept around 50 dollars, we expect the monthly current account deficit to recede to 1 billion dollars. Capital outflows will pose pressure on the demand for foreign currencies. The reduction in portfolio investments and the possible failure of domestic banks and firms to renew their foreign currency credits (around 20-30 percent) will require further financing of the external payments of a size between 40-50 billion dollars.
Figure 4 Current Account Balance and Current Account Balance excl. Energy (Cumulative – in USD Millions) -50000 -45000 -40000 -35000 -30000 -25000 -20000 -15000 -10000 -5000 0 06/0 6 07/0 6 08/0 6 09/0 6 10/0 6 11/ 06 12/ 06 01/ 07 02/ 07 03/ 07 04/ 07 05/ 07 06/ 07 07/ 07 08/ 07 09/ 07 10/ 07 11/0 7 12/0 7 01/0 8 02/0 8 03/0 8 04/0 8 05/0 8 06/0 8 07/0 8 08/0 8 09/0 8 10/0 8 11/ 08
Current Account Balance Current Account Balance excl. Energy
Source: TCMB, TURKSTAT and betam
Figure 5 Ratio of Current Account Balance to GDP and Ration of Current Account Balance excl. Energy to GDP (Quarterly, 4-quarter Rolling Sum) (%)
-7.0% -6.0% -5.0% -4.0% -3.0% -2.0% -1.0% 0.0% 1.0% 2.0% 3.0% 2003( 1) 2003( 2) 2003( 3) 2003( 4) 2004( 1) 2004( 2) 2004( 3) 2004( 4) 2005( 1) 2005( 2) 2005( 3) 2005( 4) 2006( 1) 2006( 2) 2006( 3) 2006( 4) 2007( 1) 2007( 2) 2007( 3) 2007( 4) 2008( 1) 2008( 2) 2008( 3)
Current Account Balance/GDP (%) Current Account Balance excl. Energy/GSYH (%)
Figure 6 CPI-based Real Exchange Rate and the Ratio of Total Short Term Debt to International Reserves 65% 85% 105% 125% 145% 165% 01/0304/0307/0310/0301/0404/0407/0410/0 4 01/0504/0 5 07/0510/0 5 01/0604/0 6 07/0610/0601/0704/0707/0710/0701/0 8 04/0807/0 8 10/08 D e bt /R es er v e s 115 125 135 145 155 165 175 185 195 E x c h an ge R a te I n d e x
Short Term Debt Stock/Net International Reserves Real Effective Exchange Rate
Source: Turkey Data Monitor, betam
Whether the foreign currency supply can meet the demand without having to revert to the reserves depends on the IMF agreement. Even if they may not be used all at once, IMF credits will boost confidence in the markets, and will attract foreign direct investment and the foreign funds of residents. As seen in Figure 6, the ratio of short-term debt to net reserves which had been increasing in the last months will start to decrease due to the IMF credits and to the partial pay-back of the private of short-term debt. This decline has already started (Figure 4). Bearing these in mind, we think that the adjustment of the exchange rate has come to an end and the
depreciation of TL against the currency basket will stabilize between 20-25 percent.
Fiscal Policy
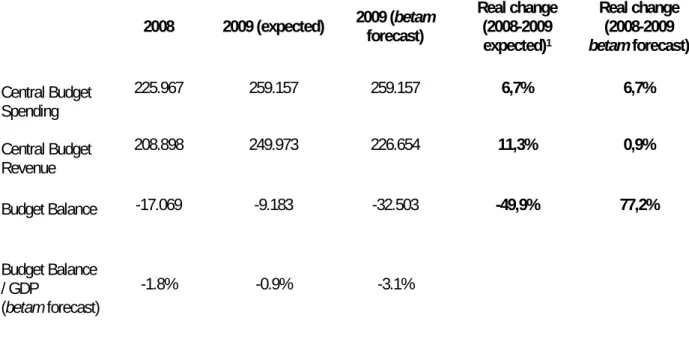
The 2009 budget seems to be unrealistic. Compared to that in 2008, the budget deficit is likely to grow.
The 2009 budget was prepared in October assuming a growth rate of 4 percent and without taking into account the effects of the global crisis. During the discussions in the Grand National Assembly of Turkey, a limited revision was made in the expenditure items under the pressure of the IMF. However, revenue items remained untouched. The 2009 budget does not seem to be realistic in its present form. If the budget sizes are not revised, there will be an inevitable gap between the expected and realized revenues, and thereby between the expected and realized budget deficits.
In Table 1, the 2009 budget figures and the 2008 realizations are presented. We take 2009 average inflation to be 7.5 percent. The CBRT’s latest forecast for the end-of-year inflation rate is 6.8 percent. The key item in the budget is the tax revenues which constitute 80 percent of total revenues. Tax revenues are calculated in the budget to rise by 19.6 percent in nominal and 11.3 percent in real terms. Maybe a 4 percent growth rate would render this possible. However, in 2009, GDP growth is most likely to be around zero, in which case the indirect tax revenues will not rise in real terms. Moreover, under these circumstances, a widening of the tax base does
are not abated during the year, the budget deficit will be three times the amount expected. The ratio of budget deficit to GDP is likely to exceed 3 percent.
Undoubtedly, this will lead to a fiscal expansion which will be done automatically in a recessionary environment, rather than consciously. It is ambiguous whether and to what extent the IMF will permit such a loose fiscal policy. The last statements of the Prime Minister and the IMF imply that the negotiations over the fiscal policy still continue.
Table 1: Central Administration Budget (TL, Millions)
2008 2009 (expected) 2009 (betam forecast) Real change (2008-2009 expected)1 Real change (2008-2009 betam forecast) Central Budget Spending 225.967 259.157 259.157 6,7% 6,7% Central Budget Revenue 208.898 249.973 226.654 11,3% 0,9% Budget Balance -17.069 -9.183 -32.503 -49,9% 77,2% Budget Balance / GDP (betam forecast) -1.8% -0.9% -3.1%
Source: State Planning Organization and betam
Inflation
If the expectations are met -oil prices around 50 dollars, a mild revival from the second half of the year on and stronger relations with IMF and EU, the inflation will be below 7 percent at the end of 2009.
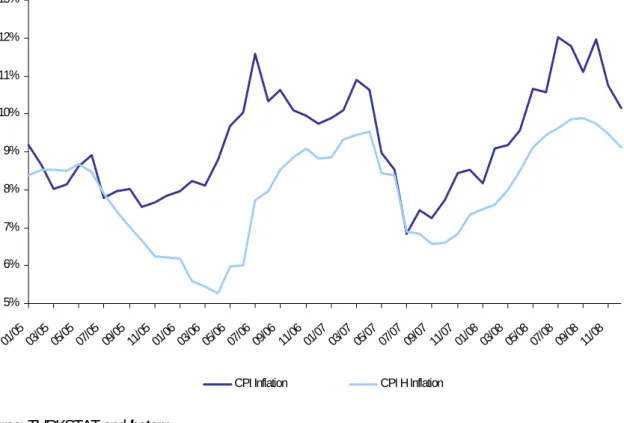
The annual CPI has been decreasing since November. The monthly inflation was negative in December, pulling down the annual CPI to 10 percent. Seasonally adjusted CPI and the core inflation (CPI H) highlight disinflation (Figure 8). What lies behind this is the global deflation in conjunction with the recession in domestic demand. Pressures on prices are only exerted by the pass-through and the inflationary trend. The 30 percent depreciation of TL would take its toll on the current prices if it were not for the contraction of the domestic demand. The structural upward trend of service prices is also coming to an end.
Under these circumstances, it is very likely that the increase in the end-of-year CPI will be below the target level at 7.5 percent revised in May of 2008. The CBRT revised once again its estimation of end-of-year inflation as 6.8 percent in the first Inflation Report of 2009.
The critical assumption underlying this forecast is that the inflationary effect of an increase in the exchange rate will be limited under a recession. Even if this pass-through rate is low under recession it is not null, In order to keep the inflation below 7 percent by the end of year, it needs to decrease by at least 3 percentage points in one year. Is this attainable in the face of expected output loss and global deflation? It is hard to say, but, as argued in the CBRT’s last inflation report, if the expectations are met -oil prices around 50 dollars, a mild revival from the second half of the year on and stronger relations with IMF and EU, inflation will decline according to CBRT forecast.
Figure 8 Annual CPI and CPI H (seasonally adjusted) 5% 6% 7% 8% 9% 10% 11% 12% 13% 01/05 03/05 05/0507/05 09/05 11/05 01/06 03/06 05/06 07/06 09/06 11/06 01/07 03/07 05/07 07/07 09/07 11/0701/08 03/08 05/08 07/08 09/08 11/08
CPI Inflation CPI H Inflation
Source: TURKSTAT and betam
Monetary policy
The CBRT made large interest rate cuts during the last three months. However, note that the current level of the real interest rate is still too high given that we are in recession. We expect a limited additional decrease in the policy rate in February 2009.
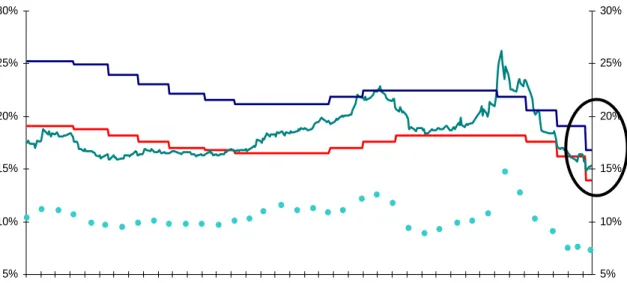
From October on, the CBRT reduced the overnight lending rate to 15.5 percent and the borrowing rate to 13 percent, through progressive interest cuts amounting to 375 basis points. As explained in the 2009 Monetary Policy Report, the CBRT takes the median of these two rates as the fixed interest rate at the one-week forward daily auctions. Thus, at the moment, the policy rate is 14.25 percent and the annual compound interest rate is slightly above 15 percent. The annual compounded interest rate of the benchmark bond is around that rate, as well. The market seems to have accepted the interest rate cuts.
As can be seen in Figure 8, the benchmark rate followed the CBRT’s interest rate cuts. We observe a remarkable fall in the expected real interest rate, which is still at 8 percent approximately. Note that its current level is still too high given that we are in recession. The CBRT wants to sustain a limited expansive monetary policy. However, this depends on the stability of exchange rate and on whether the market rate follows the policy rate. It is difficult to forecast the real interest rate threshold level that would prevent capital outflows and speculative moves against TL. The CBRT’s belief as to where this threshold lies is important. We expect the CBRT to test this threshold through a limited reduction in the interest rate at the Monetary Policy Council to take place in February 2009.
Figure 9 Indicators of Monetary Policy 5% 10% 15% 20% 25% 30% 7/31/ 2007 8/14/ 2007 8/28/ 2007 9/11/ 2007 9/25/ 2007 10/9/ 2007 10/23 /2007 11/6/ 2007 11/20 /2007 12/4 /2007 12/18 /2007 1/1/2 008 1/15/ 2008 1/29/ 2008 2/12/ 2008 2/26/ 2008 3/11/ 2008 3/25/ 2008 4/8/2 008 4/22/ 2008 5/6/2 008 5/20/ 2008 6/3/2 008 6/17 /2008 7/1/2 008 7/15/ 200 8 7/29/ 2008 8/12/ 2008 8/26/ 2008 9/9/2 008 9/23/ 2008 10/7/ 2008 10/21 /2008 11/4/ 2008 11/18 /2008 12/2/ 2008 12/16 /2008 12/30 /2008 1/13/ 2009 5% 10% 15% 20% 25% 30%
CBRT Overnight Borrowing Rate (Comp.) Benchmark Interest Rate (Comp.)
CBRT Overnight Lending Rate (Comp.) Expected Real Interest Rate*
Source: Turkey Data Monitor and betam*
* Expected real interest rate=