H. Koruk 1
An assessment on the performance of impedance tube
method
This is a post-refereeing final draft. When citing, please refer to the
published version:
H. Koruk, An assessment on the performance of impedance tube method,
Noise
Control
Engineering
Journal
62(4),
264-274,
2014.
H. Koruk 2
An assessment on the performance of impedance tube method
Hasan Koruka
ABSTRACT
The impedance tube method is widely used for measuring sound absorption (or
reflection) coefficients of acoustic materials as a function of frequency. However, the sound
absorption coefficients obtained using the impedance tube method may have some variations
due to the dimensions (limits) of an impedance tube, sample preparation and sample
mounting. This paper assesses the performance of the two-microphone impedance tube
method as a function of frequency for different tube dimensions and materials and presents
suggestions for increasing the reliability and repeatability of impedance tube measurements.
First, after summarizing a systematic way for measuring acoustic transfer functions, sound
absorption coefficients of a variety of materials ranging from conventional absorbing acoustic
materials to samples with thin films are measured using two tubes with different tube
diameter and microphone spacing. Uncertainty of sound absorption coefficients for various
materials are discussed, and the frequency limits of impedance tubes are assessed. Then, a
method for minimizing uncertainty due to sample mounting is proposed, and the main
findings are discussed.
INCE classification: 72.7.1, 35.2
aMEF University, Mechanical Engineering Department, 34398 Istanbul, Turkey
E-mail: [email protected] Tel.: +902122852814.
H. Koruk 3
1. INTRODUCTION
The impedance tube method1-3 is a conventional approach for measuring sound absorption
properties of materials such as complex valued reflection coefficients, sound absorption coefficients and complex valued acoustic impedances. Standards4-5 are available that provide basic information,
suggesting frequency ranges and giving some warnings to conduct an impedance tube experiment. However, the impedance tube method still has some drawbacks affecting the reliability and quality of measured acoustic properties. Note that different frequency ranges are recommended by different standards4-5 for the same tube dimensions.
There are some papers studying uncertainties due to frequency response estimations6-8, ambient
temperature9 and microphone and sample locations7-10. The effect of sample circumferential edge
constraint11, sample size12, calibration13-14 and sample mounting15 are also studied in the literature.
However, the deviations in the identified sound absorption coefficients as a function of frequency for different tube dimensions (tube diameter and microphone spacing) and for different kind of materials have not been quantified in a systematic way in the literature9-17. This paper attempts to
fill this void by identifying sound absorption coefficients of a large number of materials measured using two tubes with different dimensions and examining variations in sound absorption
coefficients as a function of frequency after an accurate approach is summarized to conduct repeatable transfer function measurements.
2. PROBLEM FORMULATION
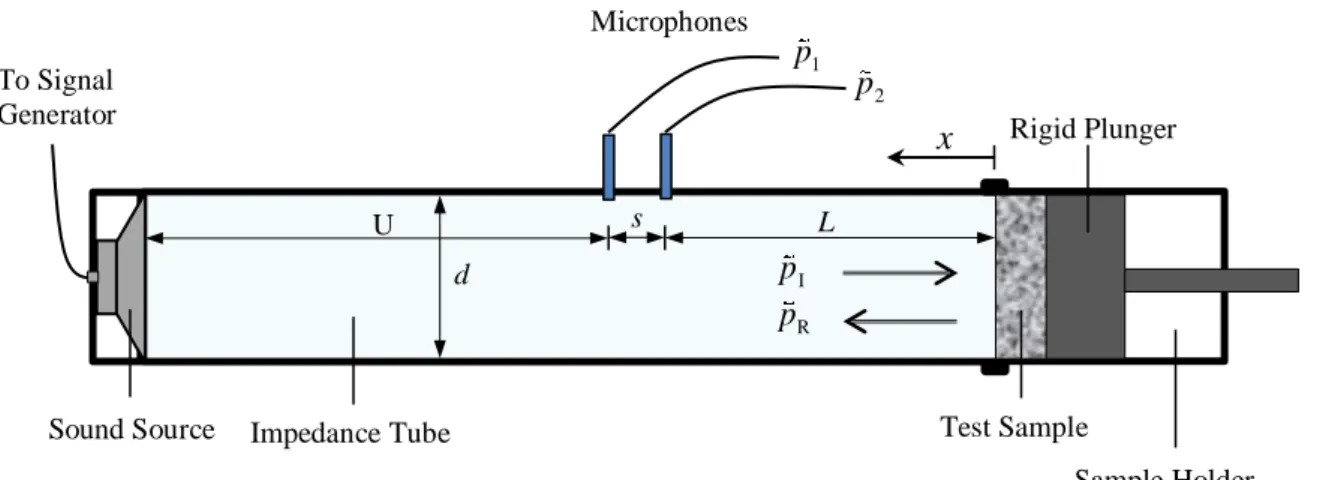
Fig. 1 illustrates the experimental test setup for an impedance tube method where pI and pR are the complex valued sound pressure signals propagating in the incident and reflected directions, respectively. The test sample is mounted inside the tube by using a sample holder and a rigid plunger providing sound isolation. In the impedance tube method, the complex valued normal incidence reflection coefficient R f can be determined as follows:
( )
H. Koruk 4
( )
12( )
( )
j 2 j ( ) j 12 ks k s L ks H f e R f e e H f − + − = − (1)where H12
( )
f is the complex valued acoustic transfer function, k =2 f c is the (real) wave number in the air, c is the sound speed in the air, f is the working frequency, and j= −1. Overall, the sound absorption coefficient at normal incidence as a function of frequency is determined as4-5:( )
( )
21
f R f
= − (2)
It should be noted that H12
( )
f is measured while R f and( )
( )
f are calculated using Eqs. (1-2).
Fig. 1. Measurement setup for an impedance tube experiment where the broadband random noise is
generated using a sound source, and two microphones are used to measure sound pressure signals inside the tube.
Table 1 shows the expressions and corresponding coefficients for upper and lower frequencies in the standards4-5. It is seen that the standards4-5 disagree and are too conservative. Therefore,
acoustic H12
( )
f transfer functions are measured using various materials including someconventional acoustic foams with different densities, porosities and thicknesses (with different absorption properties), a few acoustic foams with polyurethane (PU) films, a reflective material and acoustic egg crate foams and by using two tubes with different dimensions (d and s values). The dimensions of the small and large tubes are listed in Table 2. For each material and tube diameter, a few (more than one) ‘identical’ samples are prepared. However, the uncertainties related all other
1
p
To Signal Generator
Sound Source Test Sample
Rigid Plunger Impedance Tube Sample Holder Microphones s x d 2 p I p R p L U
H. Koruk 5
parameters except d and s should be minimized as much as possible before the effects of d and s are examined; hence a systematic approach is first summarized to check the reliability and repeatability of the measurement system.
Table 1
The expressions for lower and upper frequencies ( fL and fU) and corresponding coefficients suggested in the standards.
Expression Coefficients ISO 10534-2 [4] ASTM E 1050 [5] L L c f k s k =L 0.05 k =L 0.01 U U1 c f k d and U U 2 c f k s kU1=0.58 and kU 2=0.45 kU1=0.586 and kU 2=0.40 Table 2
The dimensions of the small and large tubes (see Fig. 1 for the definitions of d, s, L and U).
Dimension Tube Small (S) Large (L) d (mm) 29 100 s (mm) 20 50 L (mm) 35 100 U (mm) 370 150
The main objectives of this study are as follows: (i) Summarize a systematic procedure to be followed for checking the reliability and repeatability of an impedance tube experiment; (ii) measure transfer functions H12
( )
f , and identify sound absorption coefficients ( )
fusing a few ‘identical’ test samples of various materials and by using the tubes with different dimensions; (iii) explore the variations of
( )
f values for different tube dimensions andmaterials; (iv) evaluate the limits for the lowest and highest frequencies of the impedance tubes; and (v) propose a method for mounting a sample inside an impedance tube for accurate and repeatable measurements.
3. MATERIALS AND TRANSFER FUNCTION MEASUREMENTS
The ambient temperature, atmospheric pressure and relative humidity are T = 25 0C, p
a = 101.4
H. Koruk 6
materials are listed in Table 3 where h is the thickness (length) of a test sample, is the density of the core acoustic material, and is the overall density of a sample after the acoustic core material is treated with a non-flammable material. Here, M5 is not treated with a “non-flammable” material and the surfaces of M10 and M11 looking towards the sound source (exposed to acoustic energy) during H12
( )
f measurements are covered with a PU film (with a 25 µm thickness glued using a 10µm thickness adhesive). Material M12 is quite reflective whose sound absorption is expected to be low. M13 and M14 are made of the same material while M14 is an acoustic egg crate foam (with a 15 mm egg crate depth; the total thickness of this sample is 35 mm). Sample M15 is also an
acoustic egg crate foam with 20 mm egg crate depth; the total thickness of the sample being 75 mm. It is noted that the tolerances for the sample thicknesses and diameters are = h 1.5 mm and
1
d
= + mm, respectively.
Table 3
The thicknesses of test samples (h), densities of core materials ( ) and overall densities of test samples ( ). Test Material h (mm) (kg/m3) (kg/m3) M1 35 15 50 M2 55 15 50 M3 35 15 70 M4 55 15 70 M5 55 22 22 M6 35 22 60 M7 55 22 60 M8 35 22 90 M9 55 22 90 M10 35* 22 60 M11 25* x x M12 30 x x M13 35 x x M14 35** x x M15 75** x 70
*With a PU film, **Acoustic egg crate foam, xNot known
The frequency span and frequency resolution are set to f = 50 Hz – 6.4 kHz and f = 8 Hz for the tube with d = 29 mm and f = 20 Hz – 1.6 kHz and f = 2 Hz for the tube with d = 100 mm; note that the lowest audible frequency is 20 Hz for human being19, and sound absorption properties of
H. Koruk 7
materials are identified from 50 Hz (or 100 Hz) to 5 kHz (or 6 kHz) in the most practical
applications20-24. The preparation of an impedance tube, i.e., construction of the impedance tube and
sample holder, microphone mounting, the importance of sample mounting, sound source capability, signal to noise ratio of the system and environment effects have been studied in the past11-12, 20-21.
The repeatability and reliability of the impedance tube experiment is checked before making final transfer function measurements used to calculate the sound absorption properties of materials.
The accuracy of H12
( )
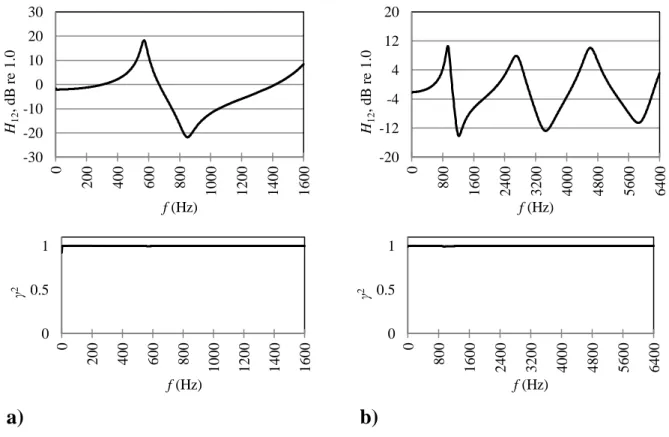
f based on spectral density functions increases with number ofaverages25; hence the measurements are conducted using N = 100 averages here26. The coherence
function27, 2
( )
f is always checked during H12
( )
f measurements. A sample H12( )
f function for material M1 and corresponding 2( )
f
function is plotted in Fig. 2. It is seen that 2
( )
f is almost
unity (i.e., 2
( )
f >0.999) for the frequency range of interest (i.e., for f = 20 Hz to 6.4 kHz) even at anti resonances; although not presented here, the 2( )
f
values are close to unity for H12
( )
fmeasurements of all materials.Transfer functionH21
( )
f measured by interchanging the positionsof microphones 1 and 2 is also compared withH12
( )
f . Sample results for material M4 are plottedin Fig. 3. It is seen that H12
( )
f and H21( )
f functions are almost symmetrical with respect tohorizontal zero line; indicating that the measurement system is repeatable and reliable. The amplitude and phase corrections are performed if required.
H. Koruk 8
a) b)
Fig. 2. The magnitudes of the transfer H12
( )
f and coherence 2( )
f functions measured using material M1 and impedance tubes with (a) d = 100 mm and (b) d = 29 mm.
a) b)
Fig. 3. The magnitudes of the transfer H12
( )
f and H21( )
f functions measured using material M4 and impedance tubes with (a) d = 100 mm and (b) d = 29 mm.Key: H12 and H21.
The measurements are conducted using a few ‘identical’ test samples (four samples are used in most cases) so that the repeatability of the test samples can be checked; the most deviated one(s)
-30 -20 -10 0 10 20 30 0 200 400 600 800 1000 1200 1400 1600 H12 , dB r e 1.0 f (Hz) -20 -12 -4 4 12 20 0 800 1600 2400 3200 4000 4800 5600 6400 H12 , dB r e 1.0 f (Hz) 0 0.5 1 0 200 400 600 800 1000 1200 1400 1600 γ 2 f (Hz) 0 0.5 1 0 800 1600 2400 3200 4000 4800 5600 6400 γ 2 f (Hz) -20 -15 -10 -5 0 5 10 15 20 0 200 400 600 800 1000 1200 1400 1600 H , dB r e 1.0 f (Hz) -10 -6 -2 2 6 10 0 800 1600 2400 3200 4000 4800 5600 6400 H , dB r e 1.0 f (Hz)
H. Koruk 9
can be excluded during averaging. The measured results of small and large samples in the matching frequency range of interest (f = 50 Hz – 1.6 kHz) are also compared, and the overall absorption coefficients are determined by averaging or combining the identified results.
4. MEASUREMENT OF SOUND ABSORPTION COEFFICIENTS OF VARIOUS
MATERIALS
After transfer H12
( )
f functions are measured, sound absorption coefficients ( )
f arecalculated by using Eqn. (2). The sound speed (c), air density ( ) and characteristic impedance of a air (z) are calculated by using28:
c c= g RT ; a a p RT = ; z=ac gc (3a,b,c)
where g =c 1 kg-m/N-s2, =1.40, R = 287 J/kg-K, T is the absolute temperature in K; hence the results are determined as c =346 m/s, = 1.185 kg/ma 3 and z = 410 Pa-s/m. First, the identified
( )
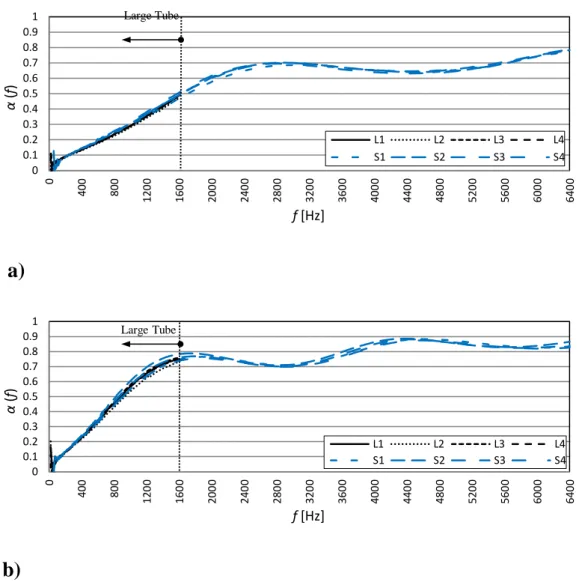
f values of M1 and M2 materials using four ‘identical’ samples with d = 29 mm (small, S) and
d = 100mm (large, L) are plotted in Fig. 4. It is seen that the results of these four ‘identical’ samples
are very close for both small and large tubes. Also,
( )
f values identified using small samples are close to the results identified using large samples in the matching frequency range (f = 50 Hz – 1.6 kHz) for both M1 and M2 materials; note that there are some deviations at very low frequencies (i.e., f 30Hz for the large tube and f 80 Hz for the small tube). Overall, the identified ( )
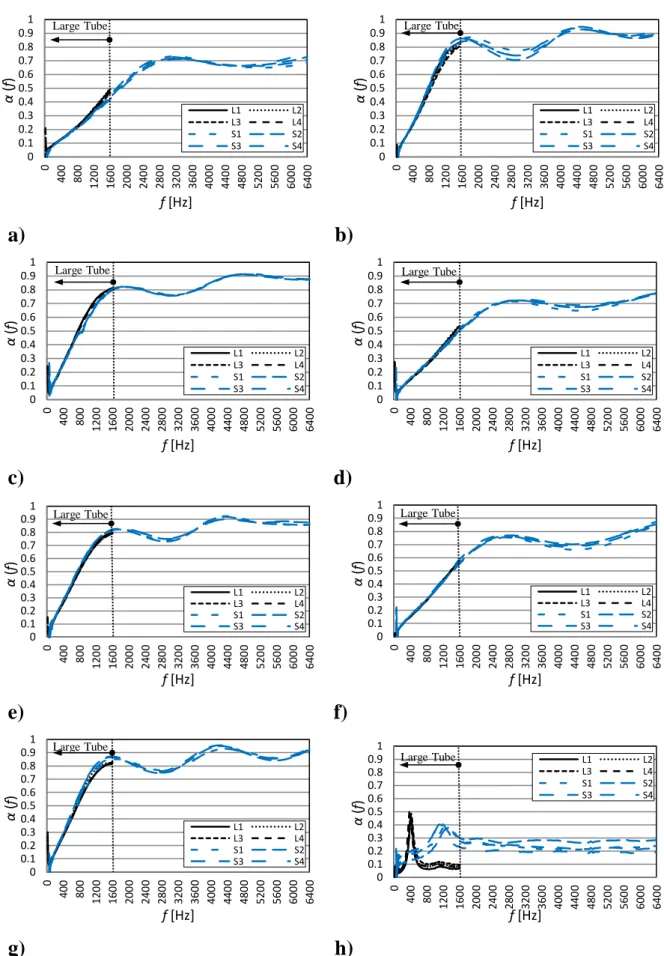
f values of M3 to M10 materials using four ‘identical’ samples with d = 29 and 100 mm are plotted in Fig. 5. The results show that the ‘identical’ small and large samples of all M2 to M9 (conventional sound absorbing with different densities and thicknesses) materials also give similar results, and in general ( )
f values identified using small samples are close to the results identified using large samples in the matching frequency range (f = 50 Hz – 1.6 kHz) for all M1 to M9 materials.H. Koruk 10
and very different
( )
f values can be measured using small and large tubes for this material in the matching frequency range (f = 50 Hz -1.6 kHz). It should be stated that the only difference between M6 and M10 is that M10 contains a very thin (with a thickness of 25 µm) PU film (glued by using a 10 µm thickness adhesive).a)
b)
Fig. 4. Identified sound absorption
( )
f values using four ‘identical’ test samples with d = 29 mm (S) and d = 100 mm (L) diameters for (a) M1 and (b) M2 materials.0 0.1 0.2 0.3 0.4 0.5 0.6 0.7 0.8 0.9 1 0 400 800 1200 0016 2000 2400 2800 3200 0036 4000 4400 0048 5200 5600 6000 6400 α (f) f [Hz] L1 L2 L3 L4 S1 S2 S3 S4 0 0.1 0.2 0.3 0.4 0.5 0.6 0.7 0.8 0.9 1 0 400 800 1200 1600 2000 2400 2800 3200 0036 4000 4400 4800 5200 5600 6000 6400 α (f) f [Hz] L1 L2 L3 L4 S1 S2 S3 S4 Large Tube Large Tube
H. Koruk 11
a) b)
c) d)
e) f)
g) h)
Fig. 5. Identified sound absorption
( )
f values using four ‘identical’ test samples with d = 29 mm (S) and d = 100 mm (L) diameters for (a) M3, (b) M4, (c) M5, (d) M6, (e) M7, (f) M8, (g) M9 and (h) M10 materials. 0 0.1 0.2 0.3 0.4 0.5 0.6 0.7 0.8 0.91 0 400 800 1200 1600 2000 2400 2800 3200 0036 4000 4400 4800 0052 5600 6000 6400 α (f) f [Hz] L1 L2 L3 L4 S1 S2 S3 S4 Large Tube 0 0.1 0.2 0.3 0.4 0.5 0.6 0.7 0.8 0.91 0 400 800 1200 1600 2000 2400 2800 3200 0036 4000 4400 4800 5200 5600 6000 6400 α (f) f [Hz] L1 L2 L3 L4 S1 S2 S3 S4 Large Tube 0 0.1 0.2 0.3 0.4 0.5 0.6 0.7 0.8 0.91 0 400 800 1200 1600 2000 2400 2800 3200 0036 4000 4400 4800 5200 5600 6000 6400 α (f) f [Hz] L1 L2 L3 L4 S1 S2 S3 S4 Large Tube 0 0.1 0.2 0.3 0.4 0.5 0.6 0.7 0.8 0.91 0 400 800 1200 1600 2000 2400 2800 3200 0036 4000 4400 4800 5200 5600 6000 6400 α (f) f [Hz] L1 L2 L3 L4 S1 S2 S3 S4 Large Tube 0 0.1 0.2 0.3 0.4 0.5 0.6 0.7 0.8 0.91 0 400 800 1200 1600 2000 2400 2800 3200 0036 4000 4400 4800 5200 5600 6000 6400 α (f) f [Hz] L1 L2 L3 L4 S1 S2 S3 S4 Large Tube 0 0.1 0.2 0.3 0.4 0.5 0.6 0.7 0.8 0.91 0 400 800 1200 1600 2000 2400 2800 3200 0036 4000 4400 4800 5200 5600 6000 6400 α (f) f [Hz] L1 L2 L3 L4 S1 S2 S3 S4 Large Tube 0 0.1 0.2 0.3 0.4 0.5 0.6 0.7 0.8 0.91 0 400 800 1200 1600 2000 2400 2800 3200 0036 4000 4400 4800 5200 5600 6000 6400 α (f) f [Hz] L1 L2 L3 L4 S1 S2 S3 S4 Large Tube 0 0.1 0.2 0.3 0.4 0.5 0.6 0.7 0.8 0.91 0 400 800 1200 1600 2000 2400 2800 3200 0036 4000 4400 4800 5200 5600 6000 6400 α (f) f [Hz] L1 L2 L3 L4 S1 S2 S3 S4 Large TubeH. Koruk 12
The sound absorption
( )
f values of another material (different from the material of M10) covered with a PU film identified using two small and large ‘identical’ samples are also examined here. This time, the transfer functions H12( )
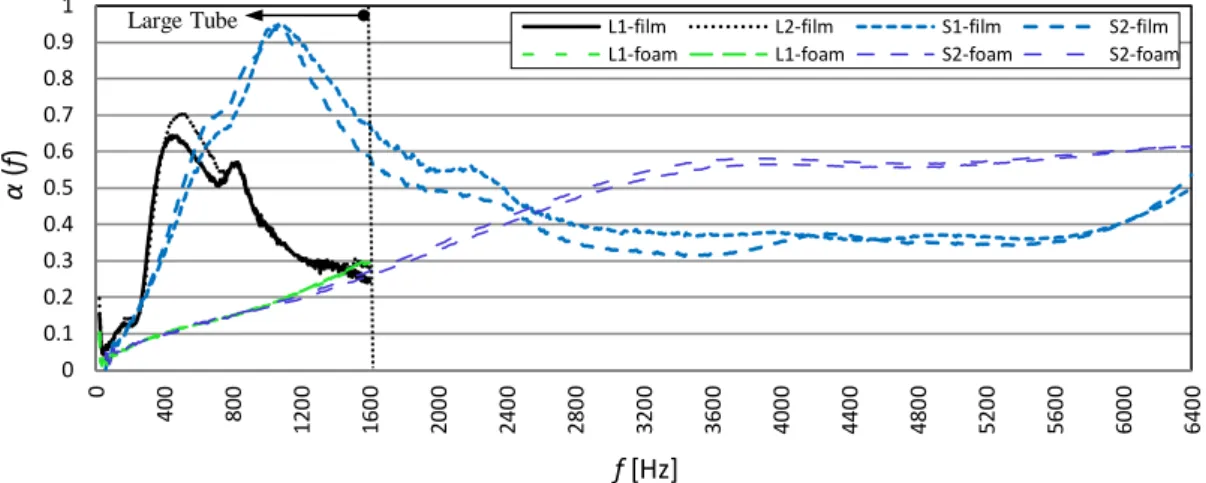
f are measured also when the foam side of the testsample is looking towards the sound source (exposed to acoustic energy); the results are plotted in Fig. 6. It is again seen that the results obtained using small tube are different from the results obtained using large samples in the matching frequency range f = 50 Hz – 1.6 kHz when the film side of the sample is looking towards the sound source. However, nearly similar results are identified from both tubes when the foam sides of the samples are looking towards the sound
source, and the results are also more repeatable in this case. These results indicate that the variations in the results are mostly due to the PU film. The performances of the impedance tubes for a
reflective material whose sound absorption is expected to be low is also investigated using the reflective material M12 here; the results are presented in Fig. 7. It is seen that the results obtained from the small tube are different from the results obtained using the large tube; the differences between small and large samples being increased from 800 Hz to 1.6 kHz as seen in Fig. 7. In addition, the performance of the impedance tubes for an acoustic egg crate foam is also investigated here; the results for the same material without (M13) and with (M14) an egg crate are plotted in Fig. 8. It is seen that both small and large tubes produce the similar results for these samples; the
samples are also quite repeatable. The results presented in this section are examined and evaluated in the next sections.
H. Koruk 13
Fig. 6. Identified sound absorption
( )
f values using two ‘identical’ test samples with d = 29 mm (S) and d = 100 mm (L) diameters when the film and foam sides of the test samples are exposed to acoustic energy.
Fig. 7. Identified sound absorption
( )
f values using two ‘identical’ test samples with d = 29 mm (S) and d = 100 mm (L) diameters for a reflective (M12) material.
a) b)
Fig. 8. Identified sound absorption
( )
f values using two ‘identical’ test samples with d = 29 mm (S) and d = 100 mm (L) diameters for test samples (a) without a profile - M13 and (b) with a profile - M14. 0 0.1 0.2 0.3 0.4 0.5 0.6 0.7 0.8 0.9 1 0 400 800 1200 1600 2000 2400 2800 3200 0036 4000 4400 4800 5200 5600 6000 6400 α (f) f [Hz]L1-film L2-film S1-film S2-film L1-foam L1-foam S2-foam S2-foam
Large Tube 0 0.1 0.2 0.3 0.4 0.5 0.6 0.7 0.8 0.91 0 400 800 1200 1600 2000 2400 2800 3200 0036 4000 4400 4800 5200 5600 6000 6400 α (f) f [Hz] L1 L2 S1 S2 0 0.1 0.2 0.3 0.4 0.5 0.6 0.7 0.8 0.91 0 400 800 1200 1600 2000 2400 2800 3200 0036 4000 4400 4800 5200 5600 6000 6400 α (f) f [Hz] L1 L2 S1 S2 Large Tube 0 0.1 0.2 0.3 0.4 0.5 0.6 0.7 0.8 0.91 0 400 800 1200 1600 2000 2400 2800 3200 0036 4000 4400 4800 5200 5600 6000 6400 α (f ) f [Hz] L1 L2 S1 S2 Large Tube
H. Koruk 14
5. DETERMINATION OF UNCERTAINTY LEVELS IN SOUND ABSORPTION
COEFFICIENTS
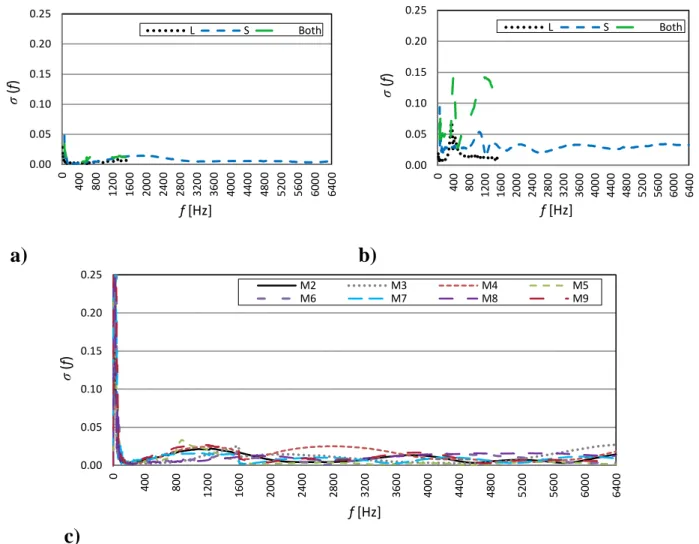
First, the standard deviations ( )f in the identified sound absorption
( )
f values of a conventional sound absorbing material (M1) and an acoustic material with a PU film (M10) described in Section 3 for the small and large samples are plotted in Fig. 9a and Fig. 9b,respectively. The deviations calculated by including the results of both the small and large samples (combined data) in the matching frequency range (f = 50 Hz – 1.6 kHz) are also plotted in Fig. 9a and 9b. It is seen that the deviations for both the small and large samples and combined data are small for the conventional sound absorbing material (M1). However, the variations can be quite high for the sample with a film (M10) though the variations in the cases of small and large separate groups are relatively small. Overall, the variations
( )
f for various sound absorbing materials (M2 to M9) with different and h values are plotted in Fig. 9c. It is seen that the average standard deviation ( )
f can be greater than 0.15 for f < 50 Hz. However, the average standard deviation( )
f is about 0.02 for f = 50-100 Hz and
( )
f < 0.01 for f = 100 Hz – 6.4 kHz for these sound absorbing materials.The results in Figs. 5 and 9 show that the identified sound absorption properties of conventional sound absorbing materials (i.e., M1 to M9) using ‘identical’ samples (for both small and large tubes) are close even at the local minima and maxima of the sound absorption coefficient curves. It is also seen that both the small and large samples produce similar sound absorption coefficient values at resonant frequencies for these materials. However, the consistency and trend of the results are different for a sample with a PU film and for a reflective sample. Various reasons for the
variations in sound absorptions of these samples can be listed as follows. A film or a sample whose surface is sensitive to an applied force can deform and modify when inserting the sample inside an impedance tube; note that the small and large samples produce similar sound absorption coefficient
H. Koruk 15
values when the foam side of a sample with a PU film is exposed to acoustic energy during H12( )f
measurements. The changes in the resonances of samples with surface coatings29-30 are also more
sensitive to sample surface (i.e., thin film) properties and sample mounting conditions. However, as the tolerances of the samples examined here are close, and the same tubes, hardware and software26
are used to measure transfer functions for all materials, similar results would be encountered in the practical impedance tube measurements20, 29, 31-32. Therefore, the researchers should be aware of
these practical problems, and this study motivates that the users of an impedance tube experiment should be more careful when handling the samples with PU films and reflective materials, or they should verify (or obtain) their results by using different tubes if possible.
a) b)
c)
Fig. 9. Standard deviations
( )
f of the identified sound absorption ( )
f values for (a) the conventional sound absorbing material - M1, (b) the sample with a film - M10 and (c) all other conventional sound absorbing materials (M2 to M9).0.00 0.05 0.10 0.15 0.20 0.25 0 400 800 1200 1600 2000 2400 2800 3200 0036 4000 4400 4800 5200 5600 6000 6400 σ (f) f [Hz] L S Both 0.00 0.05 0.10 0.15 0.20 0.25 0 400 800 1200 1600 2000 2400 2800 3200 0036 4000 4400 4800 5200 5600 6000 6400 σ (f) f [Hz] L S Both 0.00 0.05 0.10 0.15 0.20 0.25 0 400 800 1200 1600 2000 2400 2800 3200 0036 0040 4400 4800 5200 5600 6000 6400 σ (f) f [Hz] M2 M3 M4 M5 M6 M7 M8 M9
H. Koruk 16
6. ASSESSMENT OF FREQUENCY LIMITS
The lowest and highest frequencies ( fL and fU) for the tubes with d = 29 mm and s = 20 mm and d = 100 mm and s = 50 mm are determined using the expressions in Table 1; the results are listed in Table 4. It is seen that the lowest frequency is determined as fL= 865 Hz based on ISO 10534-24 and
L
f = 173 Hz based on ASTM E 10505 for the tube d = 29 mm and s = 20 mm and
L
f = 346 Hz based on ISO 10534-24 and
L
f = 69 Hz based on ASTM E 10505 for the tube d = 100
mm and s = 50 mm; the suggested lowest frequency limits by the standards4-5 are very different for
the same tube as the tolerance limits in these standards4-5 are different. On the other hand, the
results for conventional sound absorbing materials show that the lowest frequencies can be taken even as fL = 100 Hz for d = 29 mm and s = 20 mm and fL = 30 Hz for d = 100 mm and s = 50 for an average standard deviation
( )
f <0.01.Table 4
The lowest and highest frequencies ( fL and fU) for the tubes with d = 29 mm and s = 20 mm and
d = 100 mm and s = 50 mm determined using the expressions in Table 1.
Tube
d = 29 mm, s = 20 mm d = 100 mm, s = 50 mm ISO 10534-2 [4] ASTM E 1050 [5] ISO 10534-2 [4] ASTM E 1050 [5]
L
f (Hz) 865 173 346 69
U
f (Hz) 6920 6920 2007 2028
The transfer function measurements so far are conducted up to f = 1.6 and 6.4 kHz for the large and small tubes, respectively; f = 6.4 kHz being a quite high frequency for most practical
applications25-27, 33. Here, the maximum frequency values are set to f = 3.2 and 10 kHz for the large
and small tubes, respectively, and the identified
( )
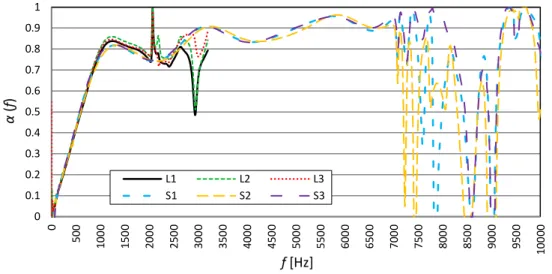
f functions for M15 material using three ‘identical’ samples are plotted in Fig. 10. It is seen that the results identified using both tubes are nearly the same for f = 50 Hz – 1.0 kHz and the results are close for f = 1.0 – 2.0 kHz. However, the results identified using the large tube are very different from the results obtained using the smallH. Koruk 17
tube for f = 2.0 – 3.2 kHz; the deviations for the large tube when f > 2 kHz are quite big and strange (not expected). It is also seen that the small tube produces very consistent results up to f = 7 kHz. However, the results have again big and strange deviations beyond f = 7 kHz. Some other materials are also examined and the similar results are obtained though they are not presented here for
brevity. Overall, the results show that the highest frequency limits recommended in the standards4-5
are appropriate.
Fig. 10. Identified sound absorption
( )
f values using three ‘identical’ test samples with d = 29 mm (S) and d = 100 mm (L) diameters for M15 material.The results of a large number of materials presented here suggest that there is a need to revise the frequency limits in the impedance tube method, or the researchers should be aware of the situation about fL and fU as explored in this study, and they can use the data quite below the lowest frequency limits presented in the standards4-5. The results obtained for a large number of absorbing
materials in this study also show that the small tube covers a large frequency range (i.e., f = 100 Hz – 7 kHz), and the small tube can be used to identify the acoustic material properties at the lower frequencies instead of using the large tube. As the small tube covers also lower frequencies, there may be no need for large tubes unless the determination of sound absorption coefficients at very low frequencies (i.e., f<50 or 100 Hz) is required.
0 0.1 0.2 0.3 0.4 0.5 0.6 0.7 0.8 0.9 1 0 500 1000 1500 2000 0025 3000 3500 4000 4500 0050 5500 6000 6500 7000 7500 8000 8500 9000 9500 10 00 0 α (f) f [Hz] L1 L2 L3 S1 S2 S3
H. Koruk 18
Although the frequency ranges f = 865 – 2007 Hz and f = 173 – 2028 Hz can be measured according to ISO 10534-24 and ASTM E 10505, respectively, using both the small and large tubes
in this study, the results show that the measured sound absorption
( )
f values can be quite different for a sample with a PU film and a reflective sample even in these convenient frequency ranges. As stated before, one of the reasons for the difficulty in the identification of soundabsorbing properties of these materials is related to sample mounting problem. Therefore, there is a strong need for an effective way for mounting test samples inside impedance tubes to minimize the uncertainty due to sample mounting; hence it is studied in the next section.
7. SAMPLE MOUNTING PROBLEM AND ITS SOLUTION
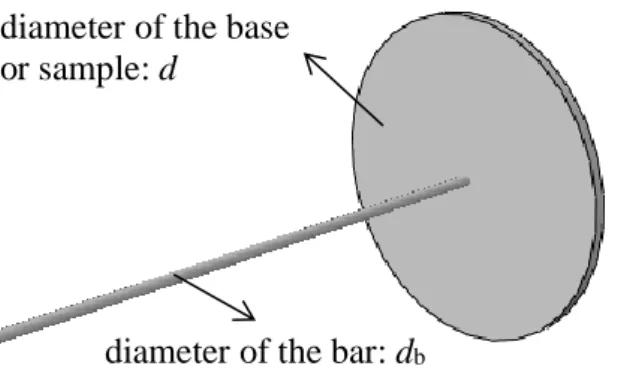
It is noted that a small pushing force applied to a sample to insert it inside the impedance tube can lead to an air space between the test sample and the rigid plunger while a big pushing force can modify the test sample (change the acoustic properties of the test sample). The problems related to sample mounting issue are more obvious when the samples are long. Therefore, there is a need to utilize a fixture to insert a test sample inside an impedance tube so that there is no modification of sound absorbing properties of a test sample and air space problem. The (mounting) fixture should be inexpensive and simple. The design of the mounting fixture suggested here is shown in Fig. 11; the fixture mainly has a circular flat base and a thin bar. First, a test sample is mounted on the fixture in Fig. 11; the rear surface of the sample touches the front surface of the fixture base; hence the air space problem is eliminated. It should be noted that the diameter of the thin bar can be quite small (let say d b 1 mm) so that it can easily pass through the sample, or a small hole with a diameter of db can be opened during sample preparation (note that the most sound absorbing materials do not need such a hole as the thin needle-like bar can easily pass through acoustic materials). After the sample is mounted on the fixture, the fixture is inserted inside the impedance tube by applying a force using the bar (not the test sample); hence the modification of a material is
H. Koruk 19
prevented. There may be a few small holes on the base of the fixture to prevent air space between the fixture and the rigid plunger. However, such issues are some details, and different solutions can be proposed to solve such minor problems. Also, some other designs can be proposed to mount a test sample inside an impedance tube noting that the main idea for utilizing a mounting fixture is to prevent the modification of the test sample and air space problem as explained above.
Fig. 11. A sample fixture to mount a test sample inside an impedance tube for minimizing
uncertainty due to sample mounting.
Here, there would be an effect of sound reflection due the tip surface of the thin bar (not covered by the test material) on the measured sound absorbing properties. However, it can be calculated here as follows. The average sound absorption coefficient in this case is calculated by34:
( )
b( )
b b ( )f f S f S S S = + + (4) where ( )
f and b( )
f are the sound absorbing coefficients of the test sample and the thin bar (or fixture), and S and Sb are the areas of the front surfaces of the test sample and the thin bar,respectively. For the worst case (i.e., when b( )f = 0), the following expression is obtained:
2 2 b 2 ( ) ( ) f d d f d − = (5)
Overall, the error percentage in the sound absorption coefficient can be calculated as:
2 b (%) 100 d d = (6) diameter of the bar: db
diameter of the base or sample: d
H. Koruk 20
where = −1 . Eqn. (6) shows that the error due to the sound reflection of the front surface of the thin bar (not covered by the test sample) is quite low; note that = 0.04 and 0.1% when
b
d d = 50 and 30, respectively.
8. DISCUSSION
Results in this paper show that the tube with a smaller diameter (d = 29 mm) in general yields more reliable results for the conventional sound absorbing materials even at the frequencies that are quite below the lowest (convenient) frequency limits fLsuggested in the standards4-5. For example,
the measurement results suggest that the lowest frequency limit fL for the tube d = 29 mm and s = 20 mm is very close to the fL for d = 100 mm and s = 50 mm though quite different fL frequencies are recommended for these tubes in the standarts4-5. One of the reasons is the higher possibility of
non-plane mode wave propagation and the difficulty in generating a travelling wave in the case of a large tube. As a tube with a smaller diameter provides also the higher frequencies to be measured, it can be said that the tubes with smaller diameters are more effective for the identification of
absorption properties of acoustic materials in the frequency range of interest of most practical applications (i.e., f = 100 Hz – 6 kHz). On the other hand, the measured sound absorption
coefficients measured using small and large samples are quite different for samples with PU films (and reflective materials) even at the convenient frequencies that are suggested in the standards4-5.
One of the reasons is that a sample whose surface is sensitive to an applied force can deform and the acoustic properties of the test sample can change when inserting the sample inside an impedance tube. The changes in the resonances of samples with surface coatings are also more sensitive to sample surface (i.e., thin film) properties and sample mounting conditions. A mounting fixture can be used to eliminate sample modification problems when inserting a sample inside an impedance tube. Overall, the results presented in this paper suggest that some revisions are needed in the standards4-5 as the frequency limits in the standards are too conservative.
H. Koruk 21
9. CONCLUSION
This paper investigates the performance of the impedance tube method as a function of frequency for different tube dimensions and materials. Specific contributions of this paper include the following. Sound absorption coefficients of a variety of materials ranging from very absorbing acoustic materials to samples with PU films are identified using two acoustic impedance tubes with different diameters and microphone spacing; the frequency range being quite wide. The uncertainty levels in the identified sound absorption coefficients are
determined for different material types as a function of frequency. By analyzing the
experimental data and the theoretical formulations for the lower and upper frequency limits in the impedance tube experiment, the frequency limits are evaluated, and new limits are
suggested. A solution is presented to mount a sample inside an impedance tube so that the change of sample acoustic properties and air space problem are eliminated (or minimized).
The results show that the sound absorption coefficients of conventional sound absorbing materials can be measured with low levels of uncertainties at the frequencies even quite below the limits given in the standards; this indicates that the frequency limits need revisions. On the other hand, the variations in sound absorption coefficients can be quite high for samples with PU films and reflective materials in practice, even in the convenient frequency range of interest suggested in the standards mostly due to difficulties arising from the nature of these materials, i.e., a PU film is quite sensitive to an applied force, the changes in the resonances of samples with surface coatings are also more sensitive to sample surface (i.e., thin film) properties and sample mounting
conditions. However, the uncertainty in the measured sound absorption coefficients can be reduced by using a sample mounting fixture. Multiple tubes can be used to cover a wide frequency range and ensure the accuracy of measured sound absorption coefficients. Subsequently, one could identify the sound reflection and absorbing coefficients and acoustic impedances of materials with better accuracy taking into account the outcomes of this paper.
H. Koruk 22
ACKNOWLEDGEMENT
The author would like to thank to Mr. Tolga Aras and Teksan Jeneratör for the assistance with preparation of test samples.
REFERENCES
1. A.F Seybert, D.F. Ross, “Experimental determination of acoustic properties using a two-microphone random-excitation technique”, J. Acoust. Soc. Am., 61, 1362–1370, (1977).
2. J.Y. Chung, D.A. Blaser, "Transfer function method of measuring in-duct acoustic properties. I: Theory”, J. Acoust. Soc. Am., 68, 907–913, (1980).
3. J.Y. Chung, D.A. Blaser, “Transfer function method of measuring in-duct acoustic properties. II: Experiment”, J. Acoust. Soc. Am., 68, 914-921, (1980).
4. Acoustics-Determination of Sound Absorption Coefficient and Impedance in Impedance
Tube-Part 2: Transfer Function Method, International Standard ISO 10534–2: 2001, International
Organization for Standardization, Geneva, Switzerland, (2001).
5. Standard Test Method for Impedance and Absorption of Acoustical Materials Using A Tube, Two
Microphones and A Digital Frequency Analysis System, ASTM E 1050: 1998, American
National Standards Institute, New York, NY, (1998).
6. A.F. Seybert, B. Soenarko, “Error analysis of spectral estimates with application to the
measurement of acoustic parameters using random sound fields in ducts”, J. Acoust. Soc. Am.,
69(4), 1190-1199, (1981).
7. H. Bodén, M. Åbom, “Influence of errors on the two-microphone method for measuring acoustic properties in ducts”, J. Acoust. Soc. Am., 79, 541-549, (1986).
8. M. Åbom, H. Bodén, “Error analysis of two-microphone measurements in ducts with flow”, J.
H. Koruk 23
9. T. Schultz, M. Sheplak, L.N. Cattafesta III, “Uncertainty analysis of the two-microphone method”, J. Sound Vib., 304, 91-109, (2007).
10. B.F.G. Katz, “Method to resolve microphone and sample location errors in the two-microphone duct measurement method”, J. Acoust. Soc. Am., 108(5), 2231-2237, (2000).
11. B.H. Song, J.S. Bolton, Y.J. Kang, “Effect of circumferential edge constraint on the acoustical properties of glass fiber materials”, J. Acoust. Soc. Am., 110(6), 2902-2916, (2001).
12. N. Kino, T. Ueno, “Investigation of sample size effects in impedance tube measurements”, Appl. Acoust., 68(11-12), 1485-1493, (2007).
13. P. Dickens, J. Smith, J. Wolfe, “Improved precision in measurements of acoustic impedance spectra using resonance-free calibration loads and controlled error distribution”, J. Acoust. Soc.
Am., 121(3), 1471-1481, (2007).
14. R. Boonen, P. Sas, W. Desmet, W. Lauriks, G. Vermeir, “Calibration of the two microphone transfer function method with hard wall impedance measurements at different reference sections”, Mech. Syst. Signal Pr., 23(5), 1662:1671, (2009).
15. A. Cummings, “Impedance tube measurements on porous media: The effect of air-gaps around the sample”, J. Sound Vib., 151(1), 63-75, (1991).
16. J.-P., Dalmon, “Acoustic impedance measurement part I: A review”, J. Sound Vib., 243(3), 427:439, (2001).
17. J.-P. Dalmon, “Acoustic impedance measurement part II: A new calibration method”, J. Sound
Vib., 243(3), 441-459, (2001).
18. D. J. Ewins, Modal Testing: Theory, Practice and Application, Second ed., Research Studies Press, Baldock, Hertfordshire, England, (2000).
19. D.A. Pierce, Acoustics: An Introduction to Its Physical Principles and Applications, Acoustical Society of America, Melville, NY, (1989).
20. D.R. Stanley, “Impedance tube specimen preparation and mounting issues”, Inter Noise 2012, New York City, NY, (2012).
H. Koruk 24
21. A.F. Seybert, X. Hua, D.W. Herrin, “Controlling uncertainty of sound absorption measurements using the impedance tube method”, Inter Noise 2013, Innsbruck, Austria, (2013).
22. N. Voronina, “Acoustic properties of fibrous materials”, Appl. Acoust., 42(2), 165–174, (1994). 23. C. Vuye, S. Vanlanduit, P. Guillaume, “Accurate estimation of normal incidence absorption
coefficients with confidence intervals using a scanning laser Doppler vibrometer”, Opt. Laser
Eng., 47, 644-650, (2009).
24. R. Del Rey, J. Alba, J.P. Arenas, V.J. Sanchis, “An empirical modelling of porous sound absorbing materials made of recycled foam”, Appl. Acoust., 73, 604-09, (2012).
25. J.S. Bendat, A.G. Piersol, “Random Data Analysis and Measurement Procedures”, 4th ed., John Wiley, (2010).
26. PULSE LabShop, Sound and vibration measurement software, Brüel and Kjaer, Copenhagen, Denmark, (2012).
27. D.E. Newland, An Introduction to Random Vibrations, Spectral And Wavelet Analysis, Third ed., Wiley, New York, (1993).
28. R. F. Barron, Industrial Noise Control and Acoustics, Marcel Dekker, New York, (2001). 29. J.F. Allard, C. Depollier, P. Guignouard, “Free field surface impedance measurements of
sound-absorbing materials with surface coatings”, Appl. Acoust., 26, 199-207, (1989).
30. L.L. Beranek, I.L. Ver, Noise and Vibration Control Engineering, John Wiley and Sons, New York, (1992).
31. K.V. Horoshenkov, M.J. Swift, “The effect of consolidation on the acoustic properties of loose rubber granulates”, Appl. Acoust., 62, 665-690, (2001).
32. H.S. Seddeq, “Factors influencing acoustic performance of sound absorptive materials”, Aust. J. Basic Appl. Sci., 3(4), 4610-4617, (2009).
33. J.P. Arenas, M.J. Crocker, “Recent trends in porous sound-absorbing materials”, Sound Vib.,
H. Koruk 25
34. B.J. Smith, R.J. Peters, S. Owen, Acoustics and Noise Control, 2nd ed., Pearson Education, London, England, (1996).