http://jppres.com/jppres
Original Article | Artículo Original
_____________________________________
In vitro antioxidant capacity and phytochemical characterization of
Eryngium kotschyi Boiss.
[Capacidad antioxidante in vitro y caracterización fitoquímica de Eryngium kotschyi Boiss.] Leyla Paşayeva1*, Esra Köngül Şafak1, Tunahan Arıgün1, Hanifa Fatullayev2, Osman Tugay3
1Department of Pharmacognosy, Faculty of Pharmacy, Erciyes University, Turkey. 2Department of Pharmaceutical Chemistry, Faculty of Pharmacy, Erciyes University, Turkey.
3Department of Pharmaceutical Botany, Faculty of Pharmacy, Selçuk University, Turkey.
*E-mail: [email protected]
Abstract Resumen
Context: Eryngium kotschyi is one of the species of Eryngium genus and was endemic to Turkey. It was known, that traditionally uses of this plant in the South-Western part of Turkey for the treatment of various diseases.
Aims: To evaluate the antioxidant capacities of methanol extract and ethyl acetate, n-butanol and water sub-extracts as well as to determine the phytochemical composition and to quantify the major antioxidant compounds in the active sub-extract.
Methods: Besides the total phenolic compounds and total flavonoid compounds, the antioxidant capacity of E. kotschyi was evaluated by DPPH●, ABTS+● and FRAP methods and qualitative and quantitative determination of phytochemical constituents in active sub-extract by LC-MS/MS.
Results: The highest total phenolic (173.710 ± 1.088 mg gallic acid equivalent/gextract) and total flavonoid content (86.978 ± 0.650 mg catechin equivalent/gextract) was found in ethyl acetate sub-extract of E. kotschyi (EKE) and this sub-extract showed the highest antioxidant capacity on DPPH● (IC50 = 0.264 ± 0.040 mg/mL), ABTS+● (at a concentration of 0.125 mg/mL equivalent to 0.497 µM Trolox) and FRAP (at a concentration of 1 mg/mL equivalent to 1476 ± 5.292 mmol Fe2+) tests. Preliminary examination of the mass spectrums revealed the presence of 24 phytochemical compounds in this sub-extract and 7 of them was quantified. According to quantitative analyses the main compounds of EKE sub-extract were rosmarinic acid (490.820 ± 0.703 µg/mgextract), chlorogenic acid (80.405 ± 0.170 µg/mgextract), isorhamnetin 3-O-rutinoside (72.280 ± 0.33 µg/mgextract), rutin (63.020 ± 0.052 µg/mgextract) and caffeic acid (55.153 ± 0.523 µg/mgextract).
Conclusions: The data suggest that EKE possess utilizable antioxidant properties in vitro. The antioxidant capacity of this sub-extract could be due to high content of phenolic and flavonoid contents.
Contexto: Eryngium kotschyi es una de las especies del género Eryngium y era endémica de Turquía. Se sabía que tradicionalmente utiliza esta planta en la parte suroeste de Turquía para el tratamiento de diversas enfermedades.
Objetivos: Evaluar la capacidad antioxidante de extracto de metanol y los sub-extractos en acetato de etilo, n-butanol y agua, así como determinar la composición fitoquímica y cuantificar los principales compuestos antioxidantes en el sub-extracto activo.
Métodos: Además de los compuestos fenólicos totales y los compuestos flavonoides totales, la capacidad antioxidante de E. kotschyi se evaluó mediante los métodos DPPH●, ABTS+● y FRAP y la determinación cualitativa y cuantitativa de los componentes fitoquímicos en el sub-extracto activo por LC-MS / MS.
Resultados: Los contenidos más altos de fenoles totales (173.710 ± 1.088 mg equivalente de ácido gálico/g de extracto) y flavonoides totales (86.978 ± 0.650 mg equivalente de catequina/g de extracto) se encontraron en el sub-extracto de acetato de etilo de E. kotschyi (EKE) y este sub-extracto mostró la mayor capacidad antioxidante en las pruebas de DPPH● (IC50 = 0,264 ± 0,040 mg/mL), ABTS+● (a una concentración de 0,125 mg/mL equivalente a 0,497 µM Trolox) y FRAP (a una concentración de 1 mg/mL equivalente a 1476 ± 5.292 mmol Fe2+) . El examen preliminar de los espectros de masas reveló la presencia de 24 compuestos fitoquímicos en este sub-extracto y 7 de ellos se cuantificaron. De acuerdo con los análisis cuantitativos, los compuestos principales del sub-extracto EKE fueron ácido rosmarínico (490,820 ± 0,703 µg/mg de extracto), ácido clorogénico (80,405 ± 0,170 µg/mg de extracto), isorhamnetin 3-O-rutinoside (72,280 ± 0,33 µg/mg de extracto), rutina (63,020 ± 0,052 µg/mg de extracto) y ácido cafeico (55,153 ± 0,523 µg/mg de extracto).
Conclusiones: Los datos sugieren que EKE posee propiedades antioxidantes utilizables in vitro. La capacidad antioxidante de este sub-extracto podría deberse al alto contenido de contenido fenólico y flavonoide.
Keywords: ABTS+●; antioxidant DPPH●; Eryngium kotschyi; FRAP;
LC-MS/MS. Palabras Clave: ABTS
+●; antioxidante DPPH●; Eryngium kotschyi; FRAP; LC-MS/MS.
ARTICLE INFO Received: May 22, 2019.
Received in revised form: October 6, 2019. Accepted: October 12, 2019.
Available Online: October 17, 2019.
Declaration of interests: The authors declare no conflict of interest.
http://jppres.com/jppres J Pharm Pharmacogn Res (2020) 8(1): 19
INTRODUCTION
Free radicals are linked to pathology of various diseases such as diabetes, cancer and cirrhosis. Reactive oxygen species (ROS) can react with fatty acids in the cell membrane and with sulfhydryl bonds in nucleotides and proteins, leading to cell damage. Natural antioxidants can scavenge theses free radicals that are responsible for the pathology of ROS-related diseases. Because of their natural antioxidant compositions, the plants are rich sources and are being widely investigated in such diseases (Roopan et al., 2009).
The genus of Eryngium L. (Apiaceae, Saniculoide-ae) is widely distributed in the world and used in traditional medicine for different therapeutic pur-poses. In Turkish folk medicine, various species of the genus are used for a wide range of ailments; particularly, roots are used against various in-flammatory disorders, edema, sinusitis, urinary infections or inflammations and snake or scorpion bites or goiter; roots and leaves for infertility and herbs for wound healing (Küpeli et al., 2006).
Eryngium genus comprises about 250 species, growing in Eurasia, North and South America, North Africa, and Australia. It is the most species-rich genus of the Apiaceae (Pimenov and Leonov, 1993). The most recent monograph of Eryngium is now over 90 years old (Wolff, 1913) and outdated. Many regional treatments in “Floras” were subse-quently published, among them Davis (1972) for Turkey, Pimenov and Tamamschian (1987) for the Flora Iranica area and Mathias and Constance (1941) for North America (Wörz and Duman, 2004). There are 23 taxa in Turkey according to Turkey Plant List (Güner and Aslan, 2012).
It was reported that some species of Eryngium have different biological activities such as cytotox-ic (Kartal et al., 2005; Bogucka-Kocka et al., 2008; Zhang et al., 2008; Vukic et al., 2018), anti-inflammatory and anti-nociceptive (Küpeli et al., 2006), amebicide (Derda et al., 2013), anti-snake and scorpion venom (Alkofahi et al., 1997), leishmania (Rojas-Silva et al., 2014), anti-malarial (Fokialakis et al., 2007), antioxidant
(Thomas et al., 2017) , antibacterial (Çelik et al., 2011), antifungal (Cavaleiro et al., 2011) and anti-diabetic (Pereira et al., 2019). These pharmacologi-cal effects are mainly related to the terpenoids, triterpenoid saponins, flavonoids, coumarins, pol-yacetylenes and steroids (Küpeli et al., 2006; Çelik et al., 2011; Wang et al., 2012).
There are few studies concerning the antioxi-dant activity and chemical composition of E. ko-tschyi. In light of this, the present study is mainly designed to evaluate the total phenolic and flavo-noid content, and antioxidant capacity by 1,1-diphenyl-2-picrylhydrazyl (DPPH+●) scavenging
activity, 2,2’-azino-bis (3-ethylbenzothiazoline-6-sulphonic acid) (ABTS+●.) scavenging activity and
ferric-reducing ability power (FRAP) methods of E. kotschyi methanol, ethyl acetate, n-butanol and water extract. Further the phytochemical profile of active sub-extract was evaluated, and quantitative analyses was carried out on this sub-extract using LC-MS/MS.
MATERIAL AND METHODS Chemicals
All chemicals and reagents were analytical or HPLC grade and purchased from Sigma-Aldrich.
Plant material
E. kotschyi Boiss. was harvested from Konya; South Hadim at 1600 m altitude of steppe areas on 2015 year (GPS coordinates: 36°58'32.1"N 32°23'13.6"E). The plant was identified and collect-ed by Osman Tugay (Selçuk University). Plant samples was deposited in the Herbarium of Sci-ence Faculty at Selcuk University (Herbarium No: KNYA 26907). In this study flowering aerial parts were air dried and cut into small pieces and grounded to coarse powder using a blender (IKA MF 10 Basic, 1000 W, Grinder).
Preparation of extracts
Air dried parts of E. kotschyi (500 g) were pow-dered and extracted three times (during 24 h, at room temperature) with 600 mL 70% methanol by
http://jppres.com/jppres J Pharm Pharmacogn Res (2020) 8(1): 20
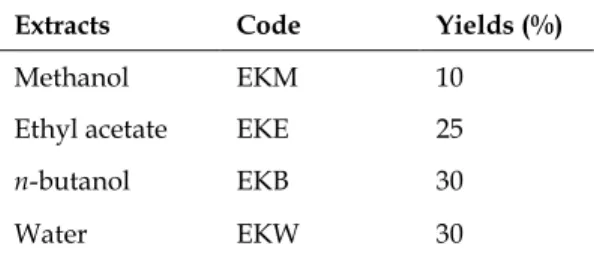
maceration. Combined macerates filtered and evaporated to dryness under reduced pressure at 37°C using a rotary evaporator. E. kotschyi metha-nol extract (EKM) dispersed with water and parti-tioned with ethyl acetate (EKE) and n-butanol (EKB) sequentially. The crude extracts were lyoph-ilized and stored in dark at -20°C. A total 3 sub-extracts were obtained from EKM extract. Yields of extract and sub-extracts are given in Table 1.
Table 1. Yield of extracts and sub-extracts.
Extracts Code Yields (%)
Methanol EKM 10
Ethyl acetate EKE 25
n-butanol EKB 30
Water EKW 30
EKM: E. kotschyi methanol extract; EKE: E. kotschyi ethyl acetate sub-extract; EKB: E. kotschyi n-butanol sub-extract; EKW: E. kotschyi water sub-extract.
Determination of Total Phenolic Content (TPC)
The TPC was estimated using method of Saeed et al. (2012). Briefly, 100 µL of the sample solution or standard was mixed with 100 µL of Folin-Ciocalteu (FC) reagent and 900 µL of ultrapure water and after 5 min 1 mL of 7% sodium car-bonate added to start the reaction. The absorbance was measured at 765 nm after 90 min of reaction in dark at ambient temperature. The TPC was report-ed as gallic acid equivalents (GAE) per gram of dry extract. Response function of the gallic acid calibration curve was y = 4.5906x + 0.0129 and the correlation coefficient (r2) of the calibration curve
was 0.999.
Determination of Total Flavonoid Content (TFC)
Total flavonoid content (TFC) was carried out according to the Marinova et al. (2015) with some modifications. A volume of 250 µL of a sample was mixed with 1 mL ultrapure water and 75 µL of NaNO2 solution (5%, w/v) and after 5 min 75 µL
of AlCl3 solution (10%, w/v) was added. A sample
was mixed and six minutes later was neutralized with 0.5 mL of 1 mol/L NaOH solution. The mix-ture was left for 10 min at room temperamix-ture and then absorbance was measured at 510 nm.
Cate-chin was used for the construction of a standard curve. All tests were carried out in triplicate. The TFC was reported as catechin equivalents (CA) per gram of dry extract. Response function of the cate-chin calibration curve was y = 3.0525x - 0.0085 and the correlation coefficient (r2) of the calibration
curve was 0.999.
Antioxidant capacity
1,1-diphenyl-2-picrylhydrazyl (DPPH●) radical
scav-enging capacity
1,1-diphenyl-2-picrylhydrazyl radical (DPPH●)
scavenging abilities of samples were determined using the method of Gyamfi and Aniya (2002). Stock solutions of samples were prepared in meth-anol at 4 mg/mL concentrations. Then the stock solutions were diluted to obtain working concen-trations (0.025, 0.05, 0.1, 0.2, 0.4, 0.6, 0.8, 1 and 2 mg/mL). A volume of 50 µL of a sample concen-tration was mixed with 950 µL 0.05 M Tris-HCl buffer and 1 mL of DPPH solution. The mixture was left for 30 min at room temperature and then absorbance was measured (Shimadzu UV-1800 UV-Vis Spectrophotometer, Shimadzu Corpora-tion, Kyoto, Japan) at 517 nm. In this study, bu-tylated hydroxyanisole (BHA) was the reference standard and all tests carried out in triplicate. The % inhibition was calculated using Equation [1]. The IC50 (concentration providing 50% inhibition)
values were calculated use the dose inhibition curve in nonlinear regression mentioned of plots of the percentage of antiradical capacity against the concentration of the samples.
% inhibition = [(Abs control- Abs sample)/ Abs control) 100] [1]
2,2’-azino-bis (3-ethylbenzothiazoline-6-sulphonic acid)
(ABTS+●) radical scavenging capacity
In this study, 2,2-azinobis (3-ethylbenzo-thiazoline-6-sulfonate) radical (ABTS+●) model was
used as an alternative radical scavenging capacity test and was estimated using method of Thaipong et. al. (2006) with some modifications. The ABTS+●
stock solution was prepared by reacting 7.4 mM ABTS with 2.6 mM K2S2O8 in equal quantities and
allowing the mixture to stand in the dark for 12 h before use. The ABTS+ working solution was
di-http://jppres.com/jppres J Pharm Pharmacogn Res (2020) 8(1): 21
luted with a methanol to an absorbance of 1.1 ± 0.02 (734 nm). A volume of 150 μL of sample were mixed with fresh 2850 μL of ABTS+ reagent. The
absorbance reading was taken after 30 min of in-cubation at room temperature in the dark. Trolox was chosen as a reference compound. Absorbance was measured on a UV spectrophotometer (madzu UV-1800 UV-Vis Spectrophotometer, Shi-madzu Corporation, Kyoto, Japan) at 734 nm and results are given in terms of TEAC (Trolox equiva-lent antioxidant capacity). The assay was carried out in triplicate.
Ferric-reducing ability power (FRAP)
The FRAP assay was carried out with method described by Guo et al. (2003) with some modifica-tions. Briefly, 40 μL of the extract or standard were mixed with 200 μL ultrapure water and 1800 μL of freshly prepared FRAP reagent. The FRAP reagent contained 2.5 mL of a 10 mmol/L TPTZ (2,4,6- tripyridy-s-triazine) solution in 40 mmol/L HCl adding 2.5 mL of 20 mmol/L FeCl3 and 25 mL of
0.3 mol/L acetate buffer, pH 3.6 and was prepared freshly and warmed at 37°C. Samples were incu-bated for 10 min at 37°C, and then, absorbance was recorded at 593 nm. FRAP values were calculated using FeSO4·7H2O as standard ferric reducing
ac-tivity. Trolox was used as a reference compound in this assay. The results were expressed as mmol of Fe2+ equivalents per g of extract weight (mmol
Fe2+/g). The assay was carried out in triplicate. LC–MS/MS instrumentation
Compounds in active sub-extract were deter-mined by using liquid chromatography-electrospray ionization–mass spectrometry/mass spectrometry (LC-ESI-MS/MS, Shimadzu 8040, Shimadzu Corporation, Kyoto, Japan). Mass spec-trometry was conducted using a Shimadzu LC-MS/MS-8040 triple quadrupole mass spectrometer equipped with an electrospray ionization (ESI) interface in the negative ion mode.
The samples were prepared in methanol. The following instrument settings were used for analy-sis: column Restek C18 (150 x 4.6 mm x 3 µm); col-umn heat, 40°C; heat block temperature, 400°C; DL
temperature, 250°C; nebulizing gas (N2), 3 L/min;
drying gas (N2), 15 L/min; collision energy, 25.0, 12.0, 9; dwell time, 100 msec. A mixture of metha-nol (A) and water: formic acid (99:1, v/v) (B) was selected as the mobile phase. The mobile phase consisted of 50% solvent A and 50% solvent B at a flow rate of 0.4 mL/min, and injection volume was 1 µL.
Statistical analysis
Statistical analysis was performed GraphPad Prism Software Version 8.0 (La Jolla, CA, USA) using to compare differences in values between the standard and experimental group. The results are expressed as the mean ± standard deviation (SD). Statistically significant values were com-pared using two-way ANOVA with Tukey Multi-ple Comparison Test and p-values of less than 0.05 were considered statistically significant.
RESULTS
Determination of Total Phenolic Content (TPC) and Total Flavonoid Content (TFC)
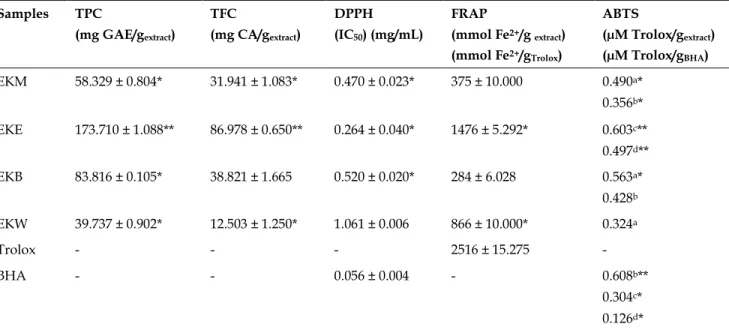
The results for TPC and TFC of the extracts are shown in Table 2. The TPC and TFC of methanol extract were 58.329 ± 0.804 mg GAE/g dryextract
and 31.941 ± 1.083 mgCA /gextract, respectively.
Moreover, it was found that the EKE sub-extract contains higher (**p<0.001) TPC (173.710 ± 1.088 mg GAE/gextract) as well as TFC (**p <0.001) (86.978
± 0.650 mgCA/gextract) than other extracts.
Fur-thermore, lower results (*p <0.05) for TPC (and TFC) were detected in water extract (39.737 ± 0.902 mg GAE/gextract and 12.503 ± 1.250 mgCA /gextract,
respectively).
Antioxidant capacity
1,1-diphenyl-2-picrylhydrazyl (DPPH●) radical
scav-enging capacity
The DPPH● assay determines the ability of
anti-oxidants to eliminate DPPH radicals by an electron transfer reaction. The results for DPPH●
antioxi-dant capacity of EK extract and sub-extracts are presented in Table 2. According to results EKM
http://jppres.com/jppres J Pharm Pharmacogn Res (2020) 8(1): 22
extract showed moderate antioxidant capacity with 0.470 ± 0.023 mg/mL IC50 values. In the
pre-sent study, the higher DPPH radical scavenging capacity was determined in EKE sub-extract (IC50 =
0.264 ± 0.040 mg/mL) and was followed by EKB, EKM and EKS extracts (IC50 = 0.520 ± 0.020
mg/mL, 0.470 ± 0.023 mg/mL and 1.061 ± 0.006 mg/mL, respectively). The EKE sub-extract showed statistically similar capacity (p<0.05) with BHA (IC50 = 0.056 ± 0.004 mg/mL), but none of the
extracts showed high capacity than BHA.
2,2’-azino-bis (3-ethylbenzothiazoline-6-sulphonic acid)
(ABTS+●) radical scavenging capacity
The ABTS radical scavenging capacity of EKM extract and EKB, EKW sub-extracts were deter-mined at the concentrations of 0.50 and 1 mg/mL and EKE 0.125, 0.25 and 0.5 mg/mL. The concen-trations of BHA as a standard were 0.125, 0.25 and 0.5 mg/mL. The methanol extract and EKB, EKW sub-extract revealed the highest capacity at 1 mg/mL, but EKE sub-extract showed it at 0.125 mg/mL. The ABTS value of EKM extract was de-termined with 0.490 ± 0.050 µM Trolox/gextract. EKE
sub-extract was found more active at 0.125 mg/mL concentration than water and n-butanol sub-extracts (0.497 ± 0.065 µM Trolox/gextract)
(Ta-ble 2). Except of EKE sub-extract none of extract and sub-extracts surpassed the activity of BHA. The activity of the EKE at a concentration of 0.125 mg/mL was found statistically higher from the capacity at a concentration of 0.125 mg/mL of BHA (p<0.05) (0.126 ± 0.078 µM Trolox/gBHA).
Ferric-reducing ability power (FRAP)
To determine the antioxidant activity of E. ko-tschyi extract and sub-extracts FRAP assay was applied, which represented single electron mecha-nism. Table 2 shows FRAP values obtained from EKM extract and sub-extracts. According to this results ethyl acetate sub-extract from EKM extract was the most active (1476 ± 5.292 mmol Fe2+/g
extract) and was followed by EKW, EKM and EKB
(866 ± 10.000, 375 ± 10.000 and 284 ± 6.028 mmol
Fe2+/g extract, respectively). Trolox was used as a
standard and EKE sub-extract was not significant-ly different from Trolox (p<0.05).
Table 2. Total phenolic and flavonoid content and antioxidant activity results of Eryngium kotschyi extract and sub-extracts. Samples TPC (mg GAE/gextract) TFC (mg CA/gextract) DPPH (IC50) (mg/mL) FRAP (mmol Fe2+/g extract) (mmol Fe2+/gTrolox) ABTS (µM Trolox/gextract) (µM Trolox/gBHA) EKM 58.329 ± 0.804* 31.941 ± 1.083* 0.470 ± 0.023* 375 ± 10.000 0.490a* 0.356b* EKE 173.710 ± 1.088** 86.978 ± 0.650** 0.264 ± 0.040* 1476 ± 5.292* 0.603c** 0.497d** EKB 83.816 ± 0.105* 38.821 ± 1.665 0.520 ± 0.020* 284 ± 6.028 0.563a* 0.428b EKW 39.737 ± 0.902* 12.503 ± 1.250* 1.061 ± 0.006 866 ± 10.000* 0.324a Trolox - - - 2516 ± 15.275 - BHA - - 0.056 ± 0.004 - 0.608b** 0.304c* 0.126d*
Values are mean ± SD, n = 3. Different letters for the same column indicate significant differences at *p<0.05, **p<0.001 and ***p<0.0001. aConcentration at 1 mg/mL; bconcentration at 0.5 mg/mL; cconcentration at 0.25 mg/mL; dconcentration at 0.125 mg/mL. EKM: E. kotschyi methanol extract, EKE: E. kotschyi ethyl acetate extract, EKB: E. kotschyi n-butanol extract, EKW: E. kotschyi water sub-extract.
http://jppres.com/jppres J Pharm Pharmacogn Res (2020) 8(1): 23
Qualitative analyses of compounds
The structural characterizations of compounds in active sub-extract were evaluated based on the registered mass spectra fragmentation patterns, NIST (National Institute of Standards and Tech-nology) mass spectral database (version 2.3, USA) and literature data. The mass spectrometric behav-ior of compounds was studied using both positive-ion and negative-positive-ion mode. But negative-positive-ion mode provided a better sensitivity for these compounds due to more efficient ionization, simpler fragmen-tation, and lower baseline noise.
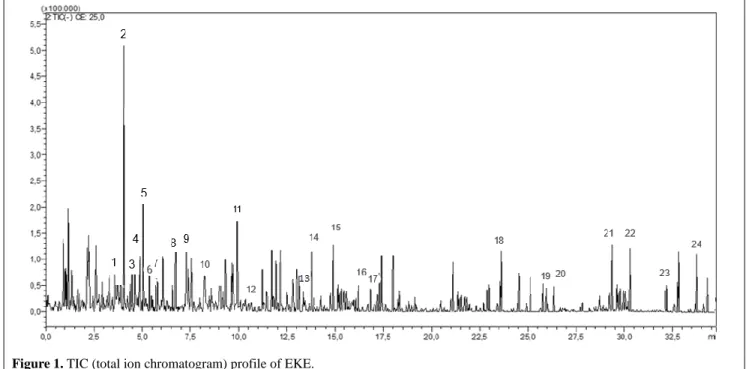
Preliminary examination of the mass spectrums revealed the presence of apigenin-7-O-rutinoside (Lin et al., 2000), caffeic acid-3-glucoside (Sadeghi et al., 2018), caffeic acid derivative-I (Riethmüller et al., 2013), cholorogenic acid (Lin et al., 2000), epicatechin-3-O-(4-O-metil) gallate (Kelebek, 2016), ferulic acid dimer (Bravo et al., 2007), iso-rhamnetine 3-O-rutinoside (Lin et al., 2000), kaempferol cumaroil hexoside (Simirgiotis and Schmeda-Hirschmann, 2010),
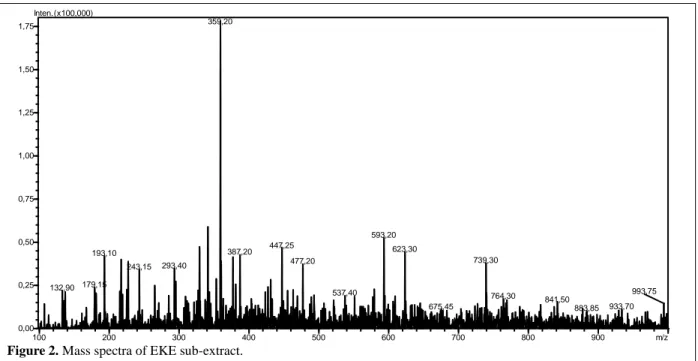
kaempferol-3-O-glucoside (Ribeiro et al., 2008), malic acid (Gonzá-lez et al., 2011), quinic acid (Clifford et al., 2003) rosmarinic acid (Tang et al., 2016), rutin (Karaçelik et al., 2015), 5-cynapoil quinic acid (Lin et al., 2000) and others. The total ion chromatogram and mass spectra of sub-extract are shown in Figs. 1 and 2. Molecular ion, retention time (RT), MS/MS data of identified compounds are given in Table 3. Prelim-inary examination of the mass spectrums revealed the presence of flavonoid and flavonoid glyco-sides, phenolic acids and derivatives, organic ac-ids, pentacyclic triterpene and hydroquinone gly-coside in EKE sub-extract.
Quantitative analyses of compounds
Compounds were subsequently analyzed in Q1Scan (Product Ion Scan) mode, using [M−H]–
ions as precursors. Obtained MS2 spectra were used to select the optimal product ions. The MRM parameters, such as the precursor ion m/z, collision energy, and product ion m/z for compounds were optimized by an automatic MRM optimization function.
http://jppres.com/jppres J Pharm Pharmacogn Res (2020) 8(1): 24 100 200 300 400 500 600 700 800 900 m/z 0,00 0,25 0,50 0,75 1,00 1,25 1,50 1,75 Inten.(x100,000) 359,20 593,20 447,25 623,30 387,20 193,10 739,30 477,20 293,40 243,15 179,15 132,90 537,40 764,30 841,50 993,75 933,70 675,45 883,85
Figure 2. Mass spectra of EKE sub-extract.
As a result of LC-MS/MS analysis for malic ac-id the loss of water [M−H−H2O]- provided an ion
at m/z 115 and with the loss of CO2 an intense ion
at m/z 71 (Fernández-Fernández et al., 2010). The peak identified as a chlorogenic acid (m/z 353), produced to the loss of one of the caffeoyl moieties [M-H-caffeoyl]-, and subsequent fragmentation of
ion yielded the fragments at m/z 191 (deprotonated quinic acid), 179 [caffeic acid-H]-, 135 and the peak
of the ion at m/z 173 (the absence of a C4 substitu-ent) (Barros et al., 2013). Fragmentation of [M-H]
-ion (m/z 609) of rutin resulted in two major -ions at m/z 300 and 301, showing the loss of rhamnose– glucose unit. The other flavonol diglycoside iso-rhamnetin 3-O-rutinoside is a 3'-methoxylated derivative of rutin. Fragmentation of this molecule [M-H]- ion (m/z 623) resulted ions m/z 285, 300 and
315. Isorhamnetin represents specific fragmenta-tion with the loss of CH3 radical from the
deproto-nated aglycone, thus giving m/z 315→ m/z 300 and the m/z 285 pattern as a result of fragmentation in C-ring (Martucci et al., 2014). The tentative mass spectrum for rosmarinic acid ([M-H]- ion at m/z
359.08) showed the caffeic acid at m/z 179.0 and m/z 161.0, m/z 135.0 corresponding to loss of water and carbon dioxide molecules respectively from the precursor ion (Hossain et al., 2010). The ob-tained LC-MS/MS chromatogram and mass spec-trum of compounds are presented in Fig. 3.
Preparation of standard and sample solutions
Stock solutions of compounds were prepared in methanol at 8 µg/mL concentrations. The extract and sub-extracts solutions were prepared in meth-anol at 10 µg/mL.
Calibration curve
Linearity of the methods was established by triplicate injections of each concentration (0.01-8 µg/mL) of standard solutions. Response function of the standards calibration curve was y = 2842x + 54.151 for rosmarinic acid, y = 10074x + 994.36 for malic acid, y = 33716x – 2152.2 for chlorogenic ac-id, y = 16535x + 275.47 for quinic acac-id, y = 181197x + 9999 for caffeic acid, y = 511143x - 4056 for rutin and y = 18006x + 928.47 for isorhamnetin 3-O-rutinoside. The correlation coefficient (r2) of the
calibration curves was 0.9989, 0.9988, 0.9995, 0.9994, 0.9991, 0.9997 and 0.9996, respectively.
The quantitative results of compounds are giv-en in Table 4. As segiv-en in the table, rosmarinic acid (490.820 ± 0.703 µg/mgextract), chlorogenic acid
(80.405 ± 0.170 µg/mgextract),
isorhamnetin-3-O-rutinoside (72.280 ± 0.336 µg/mgextract), rutin
(63.020 ± 0.052 µg/mgextract) and caffeic acid (55.153
± 0.523 µg/mgextract) were the main constituents of
http://jppres.com/jppres J Pharm Pharmacogn Res (2020) 8(1): 25
Table 3. Mass spectral characteristics and identify of compounds in EKE sub-extract. Pick No RT (min) [M−H] − (m/z) MS/MS (m/z) Compounds References
1 3.60 455 189, 207, 248, 456 Betulinic acid NIST MS database 2 4.31 359 133,161,179 Rosmarinic acid (Tang et al., 2016) 3 4.42 377 341, 215, 179, 161,119 Caffeic acid derivative-I (Riethmüller et al., 2013) 4 5.15 191 191, 93, 85 Quinic acid (Clifford et al., 2003)
5 5.16 353 191 Chlorogenic acid (Lin et al., 2000)
6 5.21 341 179,135 Caffeic acid-3-glucoside (Gardana et al., 2007)
7 5.61 179 135, 87 Caffeic acid (Horai et al., 2010)
8 6.82 477 477, 315, 287, 271, 187 Nepetin 7-glucoside (Zou et al., 2015)
9 7.23 133 115 Malic acid (González et al., 2011)
10 8.10 609 301 Rutin (Karaçelik et al., 2015)
11 10.22 623 315 İsorhamnetin
3-O-rutinoside
(Lin et al., 2000) 12 11.83 537 284, 537 Hinokiflavone (Yin et al., 2017)
13 13.81 271 108 Arbutin (de la Luz Cádiz-Gurrea et
al., 2013) 14 13.91 593 285, 255 Kaempferol cumaroil
hexoside
(Simirgiotis and Schmeda-Hirschmann, 2010) 15 14.22 387 223,191,179 5-cynapoil quinic acid (Lin et al., 2000) 16 16.31 447 273, 285, 257, 151 Kaempferol-3-O-glucoside (Ribeiro et al., 2008)
17 16.93 331 168 Glycogallin (de la Luz Cádiz-Gurrea et
al., 2013)
18 23.62 739 285, 593 Robinin NIST MS database
19 26.21 521 359, 161, 197 Glucopyranosyl rosmarinic acid
(de la Luz Cádiz-Gurrea et al., 2013)
20 26.73 463 300 Isoquercitrin (de la Luz Cádiz-Gurrea et
al., 2013) 21 29.32 577 269 Apigenin-7-O-rutinoside (Lin et al., 2000)
22 30.41 579 285
Naringenin-7-O-rhamnoside-O-β-glucoside (de la Luz Cádiz-Gurrea et al., 2013) 23 32.12 455 289,183
Epicatechin-3-O-(4-O-methyl) gallate
(Kelebek, 2016) 24 34.79 735 191,193,367 Ferulic acid dimer (Bravo et al., 2007)
http://jppres.com/jppres J Pharm Pharmacogn Res (2020) 8(1): 26
Figure 3. LC-MS/MS chromatogram and mass spectra of malic acid (a), caffeic acid (b), quinic acid (c), chlorogenic acid (d), rutin (e), isorhamnetin 3-O-rutinoside (f) and rosmarinic acid (g).
DISCUSSION
Many studies have shown that, natural antioxi-dants are capable of preventing oxidative stress related diseases such as cancer, rheumatoid arthri-tis, cardiovascular diseases, and
neurodegenera-tive diseases. On the other hand, because of their wide application, therapeutic efficacy and low toxicity, increasing attention has been paid to nat-ural products for evaluation of their antioxidant activities. In this direction, flavonoids and phenol-ic acids are known as potential natural antioxidant
http://jppres.com/jppres J Pharm Pharmacogn Res (2020) 8(1): 27
compounds and have been related to the capacity to scavenge free radicals and to reduce Fe3+ to Fe2+
(Pham-Huy et al., 2008; Fadus et al., 2017).
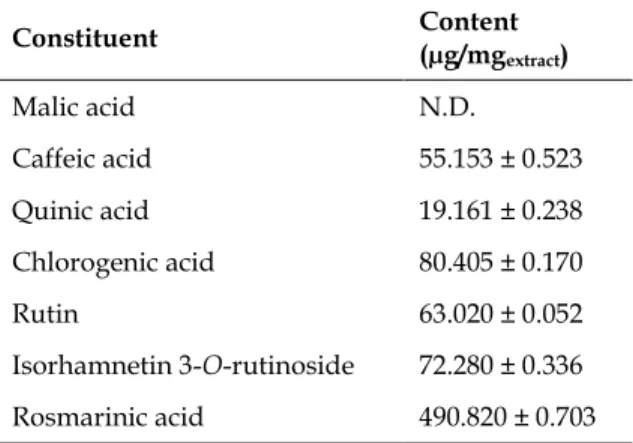
Table 4. Contents of compounds in EKE sub-extract.
Constituent Content (µg/mgextract) Malic acid N.D. Caffeic acid 55.153 ± 0.523 Quinic acid 19.161 ± 0.238 Chlorogenic acid 80.405 ± 0.170 Rutin 63.020 ± 0.052 Isorhamnetin 3-O-rutinoside 72.280 ± 0.336 Rosmarinic acid 490.820 ± 0.703
Results were given as means ± SD. ND: Not determined.
According to previous studies revealed that dif-ferent Eryngium species have demonstrated vari-ous biological activities including cytotoxic, anti-oxidant, apoptotic, antifungal, antimicrobial and anti-inflammatory effect (Yurdakök et al., 2013; Toktas et al., 2017; Roshanravan et al., 2018).
In this study, the antioxidant activity of E. ko-tschyi extract and sub-extracts measured with free radical (DPPH, FRAP, ABTS) scavenging capacity tests. Also, TPC and TFC of extract and sub-extracts were investigated. Among the sub-extracts TPC and TFC were found higher in EKE sub-extract than others (TPC: 173.710 ± 1.088 mgGAE/gextract, TFC: 86.978 ± 0.650 mgCA/gextract).
Due to the presence of high amount of phenolic acids and flavonoids EKE sub-extract showed higher antioxidant capacity than others (DPPH●:
IC50 = 0.264 ± 0.040 mg/mL, ABTS+●: at a
concen-tration of 0.125 mg/mL equivalent to 0.497 µM Trolox, FRAP: at a concentration of 1 mg/mL equivalent to 1476 ± 5.292 mmol Fe2+). Although
TFC and DPPH radical scavenging activity of EKM extract was described before (Yurdakök et al., 2014), there is no information available about ABTS+● and FRAP antioxidant activity and
chemi-cal composition of this extract and sub-extract. Unlike this report, to maximize the recovery of phenolic compounds and flavonoids as potential antioxidant agents we applied a sequential extrac-tion procedure using solvents with different
polar-ities and obtained ethyl acetate, n-butanol and water sub-extracts. In a result the antioxidant ca-pacity of EKE sub-extract was found significantly high (p<0.05) in DPPH● and FRAP tests and higher
even BHA as a standard in ABTS+● antioxidant
test. Thus, these findings led us to investigate the phytochemical composition of this sub-extract. Hereby, 10 flavonoids and flavonoid glycosides, 12 phenolic acids and derivatives, 1 pentacyclic triterpene and 1 hydroquinone glycoside were determined in EKE sub-extract and major antioxi-dant compounds, as rosmarinic acid, chlorogenic acid, isorhamnetin-3-rutinoside, rutin and caffeic acid were quantified in this sub-extract. As a re-sult, rosmarinic acid was found higher amount in this extract with 490.820±0.703 µg/mgextract and
was followed chlorogenic acid, isorhamnetin-3-rutinoside, rutin and caffeic acid. According to literature rosmarinic acid, isorhamnetin-3-rutinoside, rutin and caffeic acid were played ma-jor role in DPPH and ABTS radical scavenging activity and chlorogenic acid in FRAP test (de la Luz Cádiz-Gurrea et al., 2013).
Some Eryngium species have previously evalu-ated for the antioxidant activity such as E.
palma-tum (FRAP value: 0.2 ± 0.0 mmol Fe2+/g; DPPH+●:
IC50=0.6 ± 0.0 mg/mL), E. bourgatii (FRAP value:
59.8 ± 2.4 mmol Fe2+/g) (Wang et al., 2012), E.
tri-cuspidatum (DPPH+●: IC50 = 180 µg/mL)
(Benmera-che et al., 2016), E. caucasicum (TPC: 105.5 ± 2.8 mgGAE/gextract, TFC: 18.7 ± 0.9 mgCA/gextract,
DPPH+●: 83.1 ± 2.1 µg/mL) (Ebrahimzadeh et al.,
2009), E. creticum (DPPH+●: 89.92%) (Hijazi et al.,
2015), E. bornmuelleri acetone extract (FRAP: 909.1 ± 37.5 µmol Fe2+/gDW) (Dalar et al., 2014), E.
mari-timum (TPC: 8.09 mgGAE/gextract, TFC: 1.03
mgCA/gextract, DPPH+●: IC50 = 47.87 μg/mL) (Rjeibi
et al., 2017) and E. triquetrum (DPPH+●: IC50 = 136
μg/mL) (Khalfallah et al., 2014). As described in some of these manuscripts, the antioxidant capaci-ty of extract/sub-extract was related to flavonoid and phenolic compounds as similar to our study (Ribeiro et al., 2008; Ebrahimzadeh et al., 2009; Dalar et al., 2014; Benmerache et al., 2016; Rjeibi et al., 2017).
So, the higher antioxidant capacity of EKE sub-extract compared to other sub-extracts may be due to
http://jppres.com/jppres J Pharm Pharmacogn Res (2020) 8(1): 28
the higher content of phenolic compounds and flavonoids quantified as well as to the highest con-tent of rosmarinic acid, chlorogenic acid and caf-feic acid, which are the most efficient free radical scavengers (Chen and Ho, 1997). According to Rice-Evans et al. (1996) the antioxidant capacity of phenolic acids and their esters related to number of hydroxyl groups in the molecule and the elec-tron-withdrawing properties of the carboxylate group (Rice-Evans et al., 1996). To the best of our knowledge, the higher antioxidant capacity of this sub-extract besides the phenolic acids is correlated to the flavonoids as rutin and isorhamnetin 3-O-rutinoside. It is well known that antioxidant effect of flavonoid compounds is related to structure conformation of these compounds. The free radical scavenging activity of flavonoids is linked pres-ence of -OH groups, 2,3-double bond in conjunc-tion with 4-carbonyl group in ring C, allowing for delocalization of the phenoxyl radical electron to the flavonoid nucleus (Atoui et al., 2005). Antioxi-dant effect of these compounds have previously been reported (Benavente-Garcia et al., 2000; Heim et al., 2002; Shibano et al., 2008; Salem et al., 2011).
CONCLUSIONS
This is the first report on the antioxidant capaci-ty and phytochemical analyses of E. kotschyi spe-cies. The results showed that the ethyl acetate sub-extract of this species has highest antioxidant ca-pacity by DPPH●, ABTS+● and FRAP methods.
Identification and quantification of the antioxidant constituents of this sub-extract were evaluated in this study and their protective effect with other minor compounds may be investigated. Moreover, because of the limited studies on E. kotschyi species and identified compounds this qualitative and quantitative study combined with the antioxidant evaluation will shed new lights to the advanced studies.
CONFLICT OF INTEREST
The authors declare no conflict of interest.
ACKNOWLEDGMENTS
Authors thank to Erciyes University Scientific Research Projects Coordinating Unit (BAP, project number TLO-2019-9411) for financial support and to Erciyes University Drug Application and Research Center (ERFARMA) for LC-MS/MS facility.
REFERENCES
Alkofahi A, Sallal A and Disi A (1997) Effect of Eryngium
creticum on the haemolytic activities of snake and
scorpion venoms. Phytother Res 11(7): 540–542.
Atoui AK, Mansouri A, Boskou G, Kefalas P (2005). Tea and herbal infusions: their antioxidant activity and phenolic profile. Food Chem 89(1): 27–36.
Barros L, Dueñas M, Dias MI, Sousa MJ, Santos-Buelga C, Ferreira IC (2013) Phenolic profiles of cultivated, in vitro cultured and commercial samples of Melissa officinalis L. infusions. Food Chem 136(1): 1–8.
Benavente-Garcia O, Castillo J, Lorente J, Ortuno A, Del Rio J (2000) Antioxidant activity of phenolics extracted from
Olea europaea L. leaves. Food Chem 68(4): 457–462.
Benmerache A, Magid AA, Berrehal D, Kabouche A, Voutquenne-Nazabadioko L, Messaili S, Kabouche Z (2016) Chemical composition, antibacterial, antioxidant and tyrosinase inhibitory activities of glycosides from aerial parts of Eryngium tricuspidatum L. Phytochem Lett 18: 23–28.
Bogucka-Kocka A, Smolarz H, Kocki J (2008) Apoptotic activities of ethanol extracts from some Apiaceae on human leukaemia cell lines. Fitoterapia 79(7-8): 487–497. Bravo L, Goya L, Lecumberri R (2007) LC/MS
characterization of phenolic constituents of mate (Ilex
paraguariensis, St. Hil.) and its antioxidant activity
compared to commonly consumed beverages. Food Res Int 40(3): 393–405.
Cavaleiro C, Gonçalves MJ, Serra D, Santoro G, Tomi F, Bighelli A, Salgueiro L, Casanova J (2011) Composition of a volatile extract of Eryngium duriaei subsp. juresianum (M. Laínz) M. Laínz, signalised by the antifungal activity. J Pharm Biomed Anal 54(3): 619–622.
Çelik A, Aydınlık N, Arslan I (2011) Phytochemical constituents and inhibitory activity towards methicillin‐resistant Staphylococcus aureus strains of
Eryngium species (Apiaceae). Chem Biodivers 8(3): 454–
459.
Chen JH, Ho C-T (1997) Antioxidant activities of caffeic acid and its related hydroxycinnamic acid compounds. J Agric Food Chem 45(7): 2374–2378.
http://jppres.com/jppres J Pharm Pharmacogn Res (2020) 8(1): 29 Hierarchical scheme for LC-MSn identification of
chlorogenic acids. J Agric Food Chem 51(10): 2900–2911. Dalar A, Türker M, Zabaras D, Konczak I (2014) Phenolic
composition, antioxidant and enzyme inhibitory activities of Eryngium bornmuelleri leaf. Plant Foods Hum Nutr 69(1): 30–36.
Davis P (1972) Eryngium in flora of Turkey and the East Aegean Islands, 5th edn., Ankara.
de la Luz Cádiz-Gurrea M, Fernández-Arroyo S, Joven J, Segura-Carretero A (2013) Comprehensive characterization by UHPLC-ESI-Q-TOF-MS from an
Eryngium bourgatii extract and their antioxidant and
anti-inflammatory activities. Food Res İnt 50(1): 197–204. Derda M, Thiem B, Budzianowski J, Wojt W,
Wojtkowiak-Giera A (2013) The evaluation of the amebicidal activity of Eryngium planum extracts. Acta Pol Pharm 70(6): 1027– 1034.
Ebrahimzadeh MA, Nabavi SF, Nabavi S M (2009) Antioxidant activity of leaves and inflorescence of
Eryngium caucasicum Trautv at flowering stage.
Pharmacognosy Res 1(6): 435–439.
Fadus MC, Lau C, Bikhchandani J, Lynch HT (2017) Curcumin: An age-old inflammatory and anti-neoplastic agent. J Tradit Complem Med 7(3): 339–346 Fernández-Fernández R, López-Martínez JC,
Romero-González R, Martínez-Vidal JL, Flores MIA, Frenich AG (2010) Simple LC–MS determination of citric and malic acids in fruits and vegetables. Chromatographia 72(1-2): 55–62.
Fokialakis N, Kalpoutzakis E, Tekwani B, Khan S, Kobaisy M, Skaltsounis A, Duke S (2007) Evaluation of the antimalarial and antileishmanial activity of plants from the Greek island of Crete. J Natural Med 61(1): 38–45. Gardana C, Scaglianti M, Pietta P, Simonetti P (2007) Analysis
of the polyphenolic fraction of propolis from different sources by liquid chromatography–tandem mass spectrometry. J Pharm Biomed Anal 45(3): 390–399. González O, Alonso RM, Ferreirós N, Weinmann W,
Zimmermann R, Dresen S (2011) Development of an LC– MS/MS method for the quantitation of 55 compounds prescribed in combined cardiovascular therapy. J Chromatogr B 879(3-4): 243–252.
Güner A, Aslan S (2012) Türkiye bitkileri listesi: (damarlı bitkiler). Nezahat Gökyiǧit, Botanik Bahçesi Yayınları. Guo C, Yang J, Wei J, Li Y, Xu J, Jiang Y (2003) Antioxidant
activities of peel, pulp and seed fractions of common fruits as determined by FRAP assay. J Food Nutr Res 23(12): 1719–1726.
Gyamfi MA, Aniya Y (2002) Antioxidant properties of thonningianin A, isolated from the African medicinal herb, Thonningia sanguinea. Biocheml Pharmacol 63(9): 1725–1737.
Heim KE, Tagliaferro AR, Bobilya DJ (2002) Flavonoid antioxidants: chemistry, metabolism and structure-activity relationships. J Nutr Biochem 13(10): 572–584. Hijazi A, Al Masri DS, Farhan H, Nasser M, Rammal H,
Annan H (2015) Effect of different ethanol concentrations, using different extraction techniques, on the antioxidant capacity of Lebanese Eryngium creticum. Pharm Chem Biol Sci 3(2): 262–271.
Horai H, Arita M, Kanaya S, Nihei Y, Ikeda T, Suwa K, Ojima Y, Tanaka K, Tanaka S, Aoshima K (2010) MassBank: a public repository for sharing mass spectral data for life sciences. J Mass Spectrom 45(7): 703–714.
Hossain MB, Rai DK, Brunton NP, Martin-Diana AB, Barry-Ryan C (2010) Characterization of phenolic composition in Lamiaceae spices by LC-ESI-MS/MS. J Agric Food Chem 58(19): 10576–10581.
Karaçelik AA, Küçük M, İskefiyeli Z, Aydemir S, De Smet S, Miserez B, Sandra P (2015) Antioxidant components of
Viburnum opulus L. determined by on-line HPLC–UV–
ABTS radical scavenging and LC–UV–ESI-MS methods. Food Chem 175: 106–114.
Kartal M, Mitaine-Offer AC, Abu-Asaker M, Miyamoto T, Calis I, Wagner H, Lacaille-Dubois MA (2005) Two new triterpene saponins from Eryngium campestre. Chem Parm Bull 53(10): 1318–1320.
Kelebek H (2016) LC-DAD–ESI-MS/MS characterization of phenolic constituents in Turkish black tea: Effect of infusion time and temperature. Food Chem 204: 227–238. Khalfallah A, Berrehal D, Kabouche A, Karioti A, Bilia AR,
Kabouche Z (2014) Flavonoids, antioxidant and antibacterial activities of Eryngium triquetrum. Chem Nat Compd 50(1): 130–132.
Küpeli E, Kartal M, Aslan S, Yesilada E (2006) Comparative evaluation of the anti-inflammatory and antinociceptive activity of Turkish Eryngium species. J Ethnopharmacol 107(1): 32–37.
Lin LZ, He XG, Lindenmaier M, Yang J, Cleary M, Qiu SX, Cordell GA (2000) LC-ESI-MS study of the flavonoid glycoside malonates of red clover (Trifolium pratense). J Agric Food Chem 48(2): 354–365.
Marinova D, Ribarova F, Atanassova M (2005) Total phenolics and total flavonoids in Bulgarian fruits and vegetables. J Chem Technol Metall 40(3): 255–260.
Martucci, MEP, De Vos RC, Carollo CA, Gobbo-Neto L (2014) Metabolomics as a potential chemotaxonomical tool: Application in the genus Vernonia Schreb. PLoS One 9(4): e93149.
Mathias ME, Constance L (1941) New combinations and new names in the Umbelliferae. Bull Torrey Bot Club 68(2): 121– 124.
Pereira C, Locatelli M, Innosa D, Cacciagrano F, Polesná L, Santos T, Rodrigues M, Custódio L (2019) Unravelling the
http://jppres.com/jppres J Pharm Pharmacogn Res (2020) 8(1): 30 potential of the medicinal halophyte Eryngium maritimum
L.: In vitro inhibition of diabetes-related enzymes, antioxidant potential, polyphenolic profile and mineral composition. S Afr J Bot 120: 204–212.
Pham-Huy LA, He H, Pham-Huy C (2008) Free radicals, antioxidants in disease and health. Int J Biomed Sci 4(2): 89–96.
Pimenov M, Tamamschian S (1987) Eryngium L. Flora Iranica, Akademische Druck und Verlagsanstalt, Graz. 162: 45–60. Pimenov MG, Leonov MV (1993) The genera of the
Umbelliferae: A nomenclator. London: Royal Botanic
Gardens, Kew and Botanical Garden of Moscow University, Russia.
Ribeiro S, Barbosa L, Queiroz J, Knödler M, Schieber A (2008) Phenolic compounds and antioxidant capacity of Brazilian mango (Mangifera indica L.) varieties. Food Chem 110(3): 620–626.
Rice-Evans CA, Miller NJ, Paganga G (1996) Structure-antioxidant activity relationships of flavonoids and phenolic acids. Free Radic Biol Med 20(7): 933–956. Riethmüller E, Alberti Á, Tóth G, Béni S, Ortolano F, Kéry Á
(2013) Characterisation of diarylheptanoid‐and flavonoid‐type phenolics in Corylus avellana L. leaves and bark by HPLC/DAD–ESI/MS. Phytochem Anal 24(5): 493–503.
Rjeibi I, Saad AB, Ncib S, Souid S (2017) Phenolic composition and antioxidant properties of Eryngium maritimum (sea holly). J Coast Life Med 5(5): 212–215.
Rojas-Silva P, Graziose R, Vesely B, Poulev A, Mbeunkui F, Grace MH, Kyle DE, Lila MA, Raskin I (2014) Leishmanicidal activity of a daucane sesquiterpene isolated from Eryngium foetidum. Pharm Biol 52(3): 398– 401.
Roopan SM, Khan N, Rahman F (2009) Synthesis, antioxidant, hemolytic and cytotoxicity activity of AB ring core of mappicine. ARKIVOC (xiii): 161–169.
Roshanravan N, Asgharian P, Dariushnejad H, Alamdari NM, Mansoori B, Mohammadi A, Alipour S, Barati M, Ghavami A, Ghorbanzadeh V (2018) Eryngium billardieri induces apoptosis via Bax gene expression in pancreatic cancer cells. Adv Pharm Bull 8(4): 667–674.
Sadeghi Ekbatan S, Li XQ, Ghorbani M, Azadi B, Kubow S (2018) Chlorogenic acid and its microbial metabolites exert anti-proliferative effects, S-phase cell-cycle arrest and apoptosis in human colon cancer Caco-2 Cells. Int J Mol Sci 19(3): E723.
Saeed N, Khan MR, Shabbir M (2012) Antioxidant activity, total phenolic and total flavonoid contents of whole plant extracts Torilis leptophylla L. BMC Complement Altern Med 12(1): 221.
Salem JH, Chevalot I, Harscoat-Schiavo C, Paris C, Fick M, Humeau C (2011) Biological activities of flavonoids from
Nitraria retusa (Forssk.) Asch. and their acylated
derivatives. Food Chem 124(2): 486–494.
Shibano M, Kakutani K, Taniguchi M, Yasuda M, Baba K (2008) Antioxidant constituents in the dayflower (Commelina communis L.) and their α-glucosidase-inhibitory activity. J Nat Med 62(3): 349–353.
Simirgiotis MJ, Schmeda-Hirschmann G (2010) Determination of phenolic composition and antioxidant activity in fruits, rhizomes and leaves of the white strawberry (Fragaria
chiloensis spp. chiloensis form chiloensis) using
HPLC-DAD–ESI-MS and free radical quenching techniques. J Food Compost Anal 23(6): 545–553.
Tang CB, Zhang WG, Wang YS, Xing LJ, Xu XL, Zhou GH (2016) Identification of rosmarinic acid-adducted sites in meat proteins in a gel model under oxidative stress by triple TOF MS/MS. J Agric Food Chem 64(33): 6466–6476. Thaipong K, Boonprakob U, Crosby K, Cisneros-Zevallos L, Byrne DH (2006) Comparison of ABTS, DPPH, FRAP, and ORAC assays for estimating antioxidant activity from guava fruit extracts. J Food Compost Anal 19(6-7): 669–675.
Thomas PS, Essien EE, Ntuk SJ, Choudhary MI (2017)
Eryngium foetidum L. essential oils: Chemical composition
and antioxidant capacity. Medicines 4(2): E24.
Toktas U, Nalbantsoy A, Durmuskahya C, Kayalar H (2017) Cytotoxic and anti-inflammatory effects of Eryngium
creticum Lam. growing in Izmir, Turkey. Planta Med Int
Open 4(S01): Tu-PO-137.
Vukic MD, Vukovic NL, Djelic GT, Obradovic A, Kacaniova MM, Markovic S, Popović S, Baskić D (2018) Phytochemical analysis, antioxidant, antibacterial and cytotoxic activity of different plant organs of Eryngium
serbicum L. Ind Crop Prod 115: 88–97.
Wang P, Su Z, Yuan W, Deng G, Li S (2012) Phytochemical constituents and pharmacological activities of Eryngium L. (Apiaceae). Pharm Crops 3: 99–120.
Wolff KFAH (1913) Umbelliferae – Saniculoideae. In: Engler, Das Pflanzenreich. Leipzig: Verlag von Wilhelm Engelmann (Druck von Breitkopf & Härtel in Leipzig) IV: 228. Wörz A, Duman H (2004) Eryngium trisectum (Apiaceae,
Saniculoideae), a new species from Turkey. Willdenowia
34(2): 421–425.
Yin R, Xiong K, Wen S, Wang Y, Xu F (2017) Development and validation of an LC–MS/MS method for the determination of hinokiflavone in rat plasma and its application to a pharmacokinetic study. Biomed Chromatogr 31(3): e3821.
Yurdakök B, Baydan E (2013) Cytotoxic effects of Eryngium
kotschyi and Eryngium maritimum on Hep2, HepG2, Vero
and U138 MG cell lines. Pharm Biol 51(12): 1579–1585. Yurdakök B, Gencay YE, Baydan E, Aslan Erdem S, Kartal M
(2014) Antibacterial and antioxidant activity of Eryngium
kotschyi and Eryngium maritimum. J Food Agric Environ
12(2): 35–39.
Zhang Z, Li S, Ownby S, Wang P, Yuan W, Zhang W, Beasley RS (2008) Phenolic compounds and rare
polyhydroxy-http://jppres.com/jppres J Pharm Pharmacogn Res (2020) 8(1): 31 lated triterpenoid saponins from Eryngium yuccifolium.
Phytochemistry 69(10): 2070–2080.
Zou D, Wang J, Zhang B, Xie S, Wang Q, Xu K, Lin R (2015)
Analysis of chemical constituents in Wuzi-Yanzong-Wan by UPLC-ESI-LTQ-orbitrap-MS. Molecules 20(12): 21373– 21404.
_________________________________________________________________________________________________________
AUTHOR CONTRIBUTION:
Contribution Paşayeva L Köngül Şafak E Arıgün T Fatullayev H Tugay O
Concepts or ideas x x x
Design x x x
Definition of intellectual content x x
Literature search x x x Experimental studies x x x x Data acquisition x x x x Data analysis x x Statistical analysis x x Manuscript preparation x x x x x Manuscript editing x x x x Manuscript review x x x x x
Citation Format: Paşayeva L, Köngül Şafak E, Arıgün T, Fatullayev H, Tugay O (2020) In vitro antioxidant capacity and phytochemical
characterization of Eryngium kotschyi Boiss. J Pharm Pharmacogn Res 8(1): 18–31.