KADIR HAS UNIVERSITY
GRADUATE SCHOOL OF SCIENCE AND ENGINEERING
PREDICTION OF 3D STRUCTURE OF THE DIMERIC STATE OF
HUMAN β
2-ADRENERGIC RECEPTOR
GRADUATE THESIS
January, 2016 A yç a K oro ğlu M .S . T he sis 2016
PREDICTION OF 3D STRUCTURE OF THE DIMERIC STATE OF
HUMAN β
2-ADRENERGIC RECEPTOR
AYÇA KOROĞLU
Submitted to the Graduate School of Science and Engineering in partial fulfillment of the requirements for the degree of Master of Science in Computational Biology and Bioinformatics
KADIR HAS UNIVERSITY January, 2016
“I, Ayça Koroğlu, confirm that the work presented in this thesis is my own. Where information has been derived from other sources, I confirm that this has been indicated in the thesis”
_______________________ AYÇA KOROĞLU
THEPREDICTION OF 3D STRUCTURE OF THE DIMERIC STATE OF HUMAN β2-ADRENERGIC RECEPTOR
Abstract
A significant amount of experimental and computational data points out a possible role of TM6 in the dimerization of β2-adrenergic receptor (β2AR). Peptide– and protein–protein docking experiments guided by this assumption were conducted in order to confirm the potential participation of TM6 at the interface region of β2AR dimers. Firstly, a derived peptide consisting of 23 residues of TM6 was blindly docked to β2AR monomer using a rigid body approach. The resulting complexes in which the peptide preferred to be near TM5 and TM6 regions have also the highest scores. Secondly, a total of seven peptides were derived from each TM regions and were blindly docked to β2AR using the same rigid body approach. TM6 was found to be the most preferred binding site region in the receptor for each peptide. As for the protein-protein dockings, a full rigid-body docking returned a total of 16,000 dimer conformations and is followed by a membrane topology filtering. 149 complexes fit the topology requirements. A root mean-squared deviance (RMSD) value of 6 Å was used to cluster all 149 complexes and it is observed that the highest populated cluster of conformers have the highest score value and moreover TM6 presents at the interface region. Finally, an information-driven semi flexible docking approach used by given the interface residue data for seven TM regions. Interface residue data derived from the SASA values of residues in each TM region. The generated complexes were filtered due to membrane topology requirements. The complex with the TM6 interface was the highest scored docking pose among the complexes with a proper membrane topology.
DİMERİK FAZDA İNSAN β2-ADRENERJİK RESEPTÖRÜNÜN
3D YAPISININ BELİRLENMESİ
Özet
Önemli sayıda deneysel ve bilişsel veri, β2-adrenerjik reseptörünün (β2AR)
dimerizasyonunda TM6’ nın olası bir rolüne işaret ediyor. Bu varsayımın rehberliğinde, β2AR dimerinin interfaz bölgesinde TM6’ nın olası bir katılımını
doğrulamak için peptit- ve protein-protein docking deneyleri gerçekleştirildi. İlk olarak, TM6’nın 23 rezidüsüden oluşan bir peptit, β2AR monomerine rastlantısal
olarak rijit kütle yaklaşımıyla dock edildi. Tüm yüksek skorlu konformasyonların reseptörün TM5 ve TM6 bölgelerini tercih ettikleri görüldü. İkinci olarak, herbir TM bölgesinden toplamda yedi tane peptit oluşturuldu ve aynı rijit kütle yaklaşımı kullanılarak β2AR' a sırayla dock edildi. TM6, her peptit icin reseptörde en çok
tercih edilen bağlanma bölgesi olarak bulundu. Protein-protein docking deneylerinde ise, tam rijit kütle docking taraması toplamda 16,000 dimer konformasyonu oluşturdu ve herbir dimer, membran topolojisini esas alan bir seçilim değeri ile filtrelendi. 149 konformasyon 6Å değerinde RMSD ile kümelendi ve en yüksek populasyona sahip olan kümenin TM6 yı interfaz bölgesinde
bulunduran ve en yüksek skora sahip olan küme olduğu görüldü. Son olarak, enformasyon güdümlü yarı-esnek bır docking protokolü yedi TM bölgesinden interfazda bulunmaya yatkın rezidüler verilerek kullanıldı. Interfaz rezidü dataları, her TM bölgesindeki rezidülerin SASA değerlerine göre oluşturuldu. Oluşan kompleksler membran topoloji koşullarına göre filtrelendi. TM6‘ nın interfaz bölgesini oluşturduğu kompleks, membran topolojisine uyan diğerleri içerisinde en yüksek skorlu docking pozu oldu.
Acknowledgements
First and utmost, I would first like to acknowledge my thesis advisor, Assoc. Prof. Ebru Demet AKTEN for giving me the opportunity to work in her project. This thesis would not have been possible without her valuable advice and efforts. However, most importantly, along the way she taught me how to research and analyze. I am grateful to be a student of such a true scientist.
I would like to express my gratitude for graduate scholarship ensured by TUBİTAK for my M.S. study via the project #109M281.
Additionally, I would like to thank Prof. Dr. Kemal YELEKÇİ and Asst. Prof. Tuğba Arzu Özal İLDENİZ for agreeing to serve on my dissertation committee.
I also want to thank my parents for seeing me through all these years and my friend Beril for her love and support.
Table of Contents
Abstract i Özet ii Acknowledgements iii Table of Contents iv List of Tables viList of Figures viii
List of Abbreviations xi
1. Introduction 1
2. Beta-2 Adrenergic Receptor 6
2.1 Structure ... 7
2.2 β2AR in Action ... 15
2.2.1 Constitutive and ligand determined activity of β2ARs ... 15
2.2.2 Interacting Partners ... 16
2.2.3 β2ARs In Their Natural Habitat ... 20
2.2.4 Oligomerization ... 21
3. Results and Discussion 24
3.1 Peptide Docking ... 24
3.1.1 Short Peptide Docking ... 27
3.1.2 Long Peptide Docking ... 37
3.2 Protein-Protein Docking ... 41
3.2.1 Setting up and analyzing the ZDOCK runs ... 41
3.2.2 HADDOCK (High Ambiguity Driven protein–protein DOCKing) .... 59
References 68 Appendix A Sample Parameter File For AutoDock Runs 80 Appendix B Long Peptide Docking Runs 82
List of Tables
Table 2.1 Topology of GPCR ... 9
Table 2.2 Structures of β2AR are grouped based on the efficacy of the ligands: inverse agonists, antagonists, and agonists. ... 17
Table 2.3 Crystal structures of homo-oligomeric GPCRs ... 23
Table 3.1 Docking results for the short peptide consisting of residues from 276 to 296 in TMVI. ... 31
Table 3.2 Docking results for the seven long peptides derived from different
transmembrane regions of the receptor. ... 38
Table 3.3 Set of docking experiments with different conformers and blocked
residues. ... 43
Table 3.4 The percentage values of conformations that fit the membrane topology requirements. ... 46
Table 3.5 Seven docking runs with the given active residues ... 60
Table 3.6 The percentage values of complexes that fit the membrane topology requirements. ... 62
Table 3.7 HADDOCK results for the complexes fit membrane topology
requirements ... 63
List of Figures
Figure 2.1 2D view and amino acid sequence of human β2AR ... 8
Figure 2.2 3D view of a GPCR with a residue conservation profile ... 10
Figure 2.3 An overall mechanism for β2AR ... 18
Figure 2.4 Potential roles of G-protein-coupled receptor dimerization ... 20
Figure 3.1 Schematic illustrations of the the 7th, 1st and 11th clusters’ representative conformations which are closest to the centroids. ... 26
Figure 3.2 β2AR monomer inside a single box and four smaller boxes ... 29
Figure 3.3 Snapshot of the short peptide’s best pose using one single box, the corresponding profile of the neighboring residues, snapshot of the short peptide’s pose from highest-populated cluster and the corresponding profile of the neighboring residues. ... 33
Figure 3.4 Snapshots of the short peptide’s best pose in box #1, the corresponding profile of the neighboring residues, snapshot of the short peptide’s pose from highest-populated cluster in box #1 and the corresponding profile of the neighboring residues. ... 34
Figure 3.5 Snapshot of the short peptide’s best pose in box #4, the corresponding profile of the neighboring residues, snapshot of the short peptide’s pose from
highest-populated cluster in box #4 and the corresponding profile of the neighboring residues. ... 35
Figure 3.6 Snapshot of the short peptide’s best pose in box #2, the corresponding profile of the neighboring residues within a distance of 5Å, Snapshot of the short peptide’s best pose in box #3, the corresponding profile of the neighboring residues within a distance of 5Å. ... 36
Figure 3.7 Snapshot of the TM6-derived peptide’s best pose, the corresponding profile of the neighboring residues within a distance of 5Å, Snapshot of the TM6-derived peptide from the highest populated cluster, the corresponding profile of the neighboring residues within a distance of 5Å. ... 40
Figure 3.8 The flowchart that describes the procedure for determining the most plausible dimer conformation among the docked poses generated by ZDOCK. .. 44
Figure 3.9 The z-offset, tilt angle and Z-rank score values of all 2000 conformations for Group A sets. The color bar indicates the Z-rank score values. ... 49
Figure 3.10 The z-offset, tilt angle and Z-rank score values of all 2000
conformations for Group B sets. ... 50
Figure 3.11 Representative snapshots of the most-populated cluster for parallel and antiparallel dimers with the views form the side and extracellular side of the
receptor. Their corresponding dSASAi profiles illustrated respectively. ... 55
Figure 3.12 Representative snapshots of the second most-populated cluster for parallel and antiparallel dimers with the views form the side and extracellular side of the receptor (EC view). Their corresponding dSASAi profiles illustrated,
Figure 3.13 Cluster profiles for parallel and antiparallel dimer structures passed the membrane topology filter. ... 57
Figure 3.14 Z-rank scores for 47 parallel and 102 antiparallel dimer structures passed the membrane topology filter. ... 58
Figure 3.15 Representative snapshot for the complex that have the highest cluster score ... 62
List of Abbreviations
TM Transmembrane
GPCR G-Protein Coupled Receptor
ß2AR Human Beta-2 Adrenergic Receptor
ICL Intracellular Loop
ECL Extracellular Loop
Hx8 Helix 8
RMSD Root-Mean-Square Deviation
PDB Protein Data Bank
µ-OR µ-Opioid Receptor
β1AR Beta-1 Adrenergic Receptor
κOR κ-Opioid Receptor
Chapter 1
Introduction
Known as complex molecular machines that are able to moderate many essential physiologic functions, seven transmembrane (TM) helix G-protein coupled receptors (GPCRs) comprise the largest family of integral membrane proteins. These gatekeepers and molecular messengers of the cell are targeted by approximately 40% of the pharmaceutical industry (1, 2). The activation of these receptors is induced by a broad spectrum of molecules ranging from odors to neurotransmitters (3). The formation of a ternary complex between the signalling molecule, the G protein and the active GPCR is crucial for the initiation of any GPCR-mediated signalling pathway (4). In this context, it is suggested that the beta-2 adrenergic receptor (ß2AR) - which is one of the types of GPCRs - is sufficient to activate the signalling pathways while in a monomeric state (5). However, a monomeric receptor’s ability to trigger the signaling pathways does not preclude a potential dimer formation from having a functional role as well. As a matter of fact several experimental studies demonstrated that ß2ARs forming functional dimers and even oligomers (6,7,8,9,10).
In this respect, differential epitope tagging and co-immunoprecipitation experiments by Hebert et al. (8) demonstrated that the homodimerization of ß2AR is a reversible process
hence the equilibrium between monomeric and dimeric forms is dynamic. Furthermore, a breakdown in agonist induced stimulation of adenylyl cyclase activity was observed in the presence of a peptide which is consisting from a portion of transmembrane domain 6 (TM6). This finding suggested that the TM6 derived peptide blocked the dimeric interface organization. Assuming that the receptor forms a symmetrical interface, TM6 region was predicted to have a role in dimerization.
A further biophysical approach; bioluminescence resonance energy transfer (BRET) study regarding ß2AR dimerization, unambiguously demonstrated that the human ß2AR forms constitutive homodimers that are expressed at the surface of living mammalian cells, where they interact with agonists (6). In a following study, the same research group took BRET experiments one step further to determine whether the ß1- and ß2AR can form heterodimers in cells and, if so, to investigate the potential functional consequences of such dimerization (11,12). The heterodimerization was occurred owing to their high level of sequence identity. The study highlighted a tendency for heterodimerization between ß1- and ß2AR, and a significantly high amount of constitutive dimeric receptors. Although the adenylyl cyclase activity was not affected by heterodimerization, the agonist-induced internalization of the ß2AR and the activation of the ERK1/2 MAPK signaling pathway was interrupted by the presence of ß1AR/ ß2AR heterodimerization. In the sequel of these findings, the hypothesis that ß2AR homodimerization is required for the trafficking from the endoplasmic reticulum to the plasma membrane was proposed by the same research group (13). Also the study showed that the mutations on the dimerization motif 276GXXXGXXXL284 on TM6
confer a dominant negative effect on the transportation of the receptor to the plasma membrane.
For the first time fluorescence recovery after photobleaching studies revealed the formation of stable ß2ARs oligomers (approximately 4- 5 receptor) (14). Following the
same year, fluorescence resonance energy transfer (FRET) studies suggested that the ß2AR oligomers consist of more than two monomers, and one probably tetramers in a model lipid bilayer (15). Agonists had little effect on ß2AR oligomerization whereas inverse agonists promoted the higher order oligomerization and stabilize the oligomers by reducing conformational fluctuations in individual monomers.
Computer simulation studies were performed on models of the ß2AR dimer including 5,6 domain swapped dimers -where the dimer interface lies between TM5 and TM6- proposed as the active, high affinity form (16). The correlated mutations amongst the external residues which occurred mainly at the TM5 - TM6 interface were determined in the same study. The presence of correlated mutations which is known to indicate a functionally important interface region, also were observed by a large amount of computational studies (17,18,19,20,21,22).
A computational residue conservation study also proposed TM6 as one of the most potent interface candidate (23). Moreover, a sequence alignment study composed of multiple alignment of 700 GPCRs (24) determined that the external faces of TM5 and TM6 have a high level of conservation and thus assign these regions as potential functional sites for the receptors (25,26). In immunological studies regarding A1
adenosine receptor (27), intracellular loop 3 (ICL3) which binds TM5 and TM6 had been suggested to becomes less exposed in the dimer, thus again indicating a possible role of TM5 and TM6 in dimerization.
In spite of various computational and bioinformatics studies that looked for possible dimerization / oligomerization interfaces of GPCRs did not predict exactly the same interfaces for all the GPCR subfamilies, it is noted that some TM segments appear more often than others in the prediction of such interfaces (28). TM4, TM5, TM6 regions lead the way on having the most of the lipid-exposed residues that are predicted more often, this points out a specific role for these three helices. 4.58, 5.48, and 6.42 had been found to have the greatest number of occurrences among the residues identified. 6.30 which is located between TM6 and ICL3 had a similar amount of occurrence as 6.42 suggesting a possible role of ICL3 in dimerization / oligomerization. The atomic force microscopy studies (29) conducted on rhodopsin also indicating that ICL3 facilitates the formation of rows of dimers.
Guided by the experimental and computational findings regarding the location of the interface region, we designed a computational study in which short and long peptides derived from each TM regions of ß2AR that are subjected to a docking procedure. In this procedure, derived peptides were rigidly and blindly docked to the monomeric form of the receptor, in order to determine the TM regions of the receptor for which the docked peptide would have the highest affinity and suggest a plausible interface region. Peptide docking experiments were modeled according to the studies of Hebert and his coworkers
predict a dimeric form and an interface by using two identical ß2AR monomers. The receptor structure which was used in all docking runs represents an inactive form with a relatively wrapped up ICL3 that occupies the binding site of G-protein. This position of ICL3 is selected in order to the assumption that it wouldn’t interfere any kind of dimeric or oligomeric formation. An inactive state with fewer conformational fluctuation was also preferred because of its favor on the closer packing of dimeric / oligomeric associations, as suggested by FRET experiments (4).
Chapter 2
Beta-2 Adrenergic Receptor
Beta-2 adrenergic receptors (β2AR) are the members of G-protein coupled receptor (GPCR) superfamily. GPCRs reside on the lipid bilayer of the plasma membrane of almost every eukaryotic cells. In mammalian genomes, they have a highly diversified repertoire from 800 to 1000 genes which corresponds 2-3 percent of the human proteome (30). Their involvement in almost every physiological function makes them essential to human life. In any GPCR malfunction scenario, dozens of diseases, including diabetes, blindness, asthma, depression and some forms of cancer emerge. Therefore their importance nominates them as an enticing target for drug companies.
By the recent classification system GRAFS ( Glutamate, Rhodopsin, Adhesion,
Frizzled/Taste2, Secretin) GPCRs are grouped into 6 classes based on sequence
homology and functional similarity (31). These groups can be ordered as
•Class A (or 1) Rhodopsin-like (which is by far the largest)
•Class B (or 2) Secretin receptor family
•Class C (or 3) Metabotropic glutamate/pheromone
•Class E (or 5) Cyclic AMP receptors
•Class F (or 6) Frizzled/Smoothened
These classes further spread into subfamilies in a hierarchical fashion. β2AR belongs to the highly abundant Class A-often called the “rhodopsin-like family”-which accounts for about 80 % of all GPCR genes (32). β2AR is a member of the family biogenic amine receptors and finally subfamily adrenoceptors.
GPCRs have indeed a complex machinery receiving many outputs and compiling many inputs. Upon activation, the extracellular (ligand) and intracellular (G-proteins, arrestins) guests couple with GPCRs, in the transduction the stimuli into biochemical signals (33, 34). β2AR which is mostly found in muscles interacts with hormone ligands like adrenaline (epinephrine) whose signaling causes dilation of blood vessels, increased contraction speed in cardiac or skeletal muscle and relaxation in smooth muscle.
2.1 Structure
Through 40 years, plenty of varied investigations conducted to elucidate the structure of GPCRs have been provided the most of what we know today about these intriguing macromolecules. Although membrane proteins are notoriously known as difficult to study owing to their partially hydrophobic surfaces, flexibility and lack of stability, by the year 2000 structural biologists managed to obtain the first X-ray crystallography structure of a GPCR (bovine rhodopsin) which has induced the steady increase on publications of the subsequent ones.
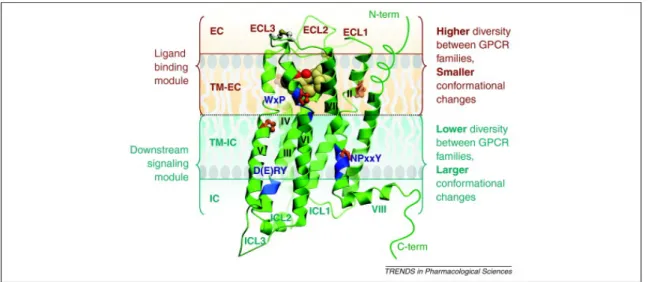
GPCRs share a common architecture in which one chain snakes back and forth through the membrane seven times, hence they are also called serpentine receptors. In general these receptors are characterized by an extracellular N-terminal region (N-terminus), followed by seven transmembrane domains (TM1 to TM7) connected by three intracellular (ICL1 to ICL3) and three extracellular loops (ECL1 to ECL3), a cytoplasmic α-helix (Hx8) parallel to the cell membrane, and finally an intracellular C-terminal region (C-terminus) (Figure 2.1 (35) and Table 2.1).
Figure 2.1 2D view and amino acid sequence of human β2AR (35)
Table 2.1 Topology of GPCR
Feature key Position(s) Length Description Topological domain 1 – 34 34 Extracellular
Transmembrane 35 – 58 24 Helical; Name=1
Topological domain 59 – 71 13 Cytoplasmic
Transmembrane 72 – 95 24 Helical; Name=2
Topological domain 96 – 106 11 Extracellular
Transmembrane 107 – 129 23 Helical; Name=3
Topological domain 130 – 150 21 Cytoplasmic
Transmembrane 151 – 174 24 Helical; Name=4
Topological domain 175 – 196 22 Extracellular
Transmembrane 197 – 220 24 Helical; Name=5
Topological domain 221 – 274 54 Cytoplasmic
Transmembrane 275 – 298 24 Helical; Name=6
Topological domain 299 – 305 7 Extracellular
Transmembrane 306 – 329 24 Helical; Name=7
Topological domain 330 – 413 84 Cytoplasmic
The X-ray crystallography structure of β2AR was first published in 2007 (PDB:2RH1). β2AR arranges itself into a tertiary structure resembling a hourglass with seven helical TM regions. Hourglass figure results from the proline kinks in TM2, TM5, TM6 and TM7 that are in the middle of the membrane span. This structure which is narrower at the waist, forms a cavity at either side of the membrane. The binding domain of the
natural agonist adrenaline is in the cavity formed near the extracellular side of the receptor.
Increased crystallography data, mutagenesis, and computational studies had yielded a residue conservation analysis for GPCRs. According to this analysis, the residues in the intracellular region which affect the coupling selectivity with G proteins are highly conserved (36). In contrast, extracellular region which operates the ligand binding selectivity have a low degree of sequence conservation (Figure 2.2 (37)). This phenomenon can ben explained by the evolutionary pressure of recognizing enormous amount of ligands by the extracellular regions.
Figure 2.2 3D view of a GPCR with a residue conservation profile (37)
All crystal structures of GPCRs have analogous TM bundle structures despite a low percentage of sequence identity (38). As a matter of fact, it is known that membrane proteins maintain a strong structure conservation for TM bundle even at low sequence
identity (<20 %) (40). Structure conservation in the GPCR family is known to be caused by a highly conserved amino acid in each TM region (38): N1.50 in TM1 (98 % of the sequences), D2.50 in TM2 (93%), R3.50 in TM3 (95%), W4.50 in TM4 (96%), P5.50 in TM5 (76%), P6.50 in TM6 (98%), and P7.50 in TM7 (93 %). The superscripts denotes for Ballesteros and Weinstein numbering (40) where the first number (1 through 7) is for the TM regions and the second number is for indicating its position according to the most conserved residue (which is 50) in the TM. Interestingly, the position of these conserved amino acids in TM regions is the same in the superimposition of the current crystal structures.
Both experimental and in silico studies have shown that GPCR superfamily share highly conserved sequence motifs (SMs) that inherent functional microdomains (FMs) which are responsible for the activation of the receptor (41-51). The known examples of these SMs/FMs for the Class A receptors are
•“arginine cage” around the (D/E)R(Y/W) motif in TM3 (41), •the NPxxY motif in TM7 (41-45) and,
•WxP(F/Y) motif in TM6
Additionally, β2AR contains PSD-95/Discs-large/ZO-1 (PDZ) protein binding sequences (PDZ domain).
A comparative study regarding the conservation of TM regions revealed that the majority of TM regions have kinks and bulges (52). In biogenic amine receptors, TM1 is found to be pointing outside of the bundle. N1.50 is suggested to be responsible for the
packing of the TM bundle since its atoms let the residues at positions 1.46 and 7.46 to bind TM1 and TM7. Moreover, N1.50 also interacts with D2.50 causing a link between TM1 and TM2. The position of TM2 (towards TM1 and away from TM3) at the extracellular part is similar in all structures. TM2 of biogenic amine receptors turns in every ~4.8 residues. Trp residue of ECL1 is found in the (W/F) x (F/L)G motif (53), and leans toward TM2 and TM3.TM3 which has the most conserved residues among all TM regions, is the longest and most tilted helix among the receptor structures. The cytoplasmic side of TM3 contains the (D/E)R3.50 (Y/W) motif involved in receptor activation. The central location of TM3 makes the interaction with the ligand at the extracellular part and with the G protein at the intracellular part possible (22). C3.25 forms a disulphide bridge with a Cys residue of ECL2 which is important for ligand recognition, since it lines the interhelical binding cavity for many GPCRs. Adrenoceptors (e.g. β2AR) have a helical ECL2 and this α-helix is not conserved in the other members of the biogenic amine receptor family suggesting that each receptor subfamily has developed a specific N-terminus/ECL2 to adapt to diverse ligands (55-57). TM4 is the shortest helix and is almost perpendicular to the membrane. Important structural diversities at the extracellular part of TM4 are found among structures, which may be related to ECL2 and selectivity of dimerization with other GPCRs, since TM4 has been shown to present at the dimer interface in several GPCRs (58). P5.50 makes a kink in TM5, at the 5.43–5.48 turn, which suggests an involvement in the mechanism of ligand-induced receptor activation (59, 60). Y5.58 (73 % of the sequences), involves in the stabilization of the active state of the receptor by interacting
with R3.50 of the (D/E)RY motif in TM3 which was observed in the crystal structures of β2AR in complex with Gs protein (PDB:3SN6)(61).
TM6 have the most severe kink which is energetically stabilized through two elements that are P6.50 of CWxP6.50(Y/F) motif and a structural water molecule between TM6 and TM7. In addition to stabilizing the kink of TM6, this water molecule also binds TM6 and TM7. TM4, TM5 and TM6 are the most diverse helices among the biogenic amine family receptors. TM5 and TM6 give selectivity to the specific ligands. TM7 is kinked at P7.50 of the highly conserved NPxxY motif. This region of TM7, involved in important conformational changes associated with GPCR activation (48), is very irregular.
Another analysis on the features of the crystal structures of various biogenic amine receptors (including β2AR) demonstrated that conserved residues are located inside of the TM bundle, most likely improving the efficiency of packing (39). These inward residues are more conserved than the residues that face to the membrane in the TM bundle. Moreover the extracellular region of TM bundle is more divergent than the intracellular part.
The loops on the other hand differ highly between GPCRs in sequence identity, length, and structure. For biogenic amine receptors, the extracellular loops show less conserved residues than the intracellular loops (ICL1 is highly conserved in all biogenic amine receptors). The extracellular surface of GPCRs is composed of the N-terminus region and ECL1, ECL2 and ECL3. X-ray crystallography studies also highlighted that the
N-terminus and ECL2 have diverse structures that adopt different conformations among the members of the GPCR superfamily (62).
2.2 β2ARs in Action
2.2.1 Constitutive and ligand determined activity of β2ARs
β2ARs have a basal activity which enables them to exist in multiple “active” and “inactive” conformational states even in the absence of ligand (63, 64). Multiscale computational methods showed that the population of the “active” states of β2AR are found to be much lower than those of the “inactive” states. And ligand binding stabilizes some of the “active” conformations already sampled. Supportively, this was later observed in the NMR study on the dynamics of β2AR (65).
There are currently 16 crystal structures deposited in the PDB for β2AR (Table 2.2). The structures of β2AR bound to the inverse agonists represent the inactive state of the receptor (PDB:2RH1 with carazolol bound and PDB:3D4S with timolol bound). Structures that reflect the active states are bound to the agonist BI-167107 in complex with either a camelid nanobody (PDB:3P0G) or Gs protein (PDB : 3SN6).
However the structures of the active and inactive forms of β2AR are very similar (RMSD 1.0 Å for residues 29-265 and 299-365) , activation of β2AR induces a conformational change in TM6 (or vice versa) (66-68), as a result Leu266 in N-terminal end moves by 11 Å. As mentioned before, TM6 is known to be very dynamic with a kink angle among GPCRs. This movement of TM6 consequently alters the shape of the
intracellular face of the molecule and results a splaying of the helices at the cytoplasmic end of the receptor.
This change increases the affinity between β2AR and G-protein. The crystal structure of the active state bound to the BI-167107 agonist shows hydrogen bonding interactions which stabilize a receptor conformation that includes a 2.1 Å inward movement of TM5 relative to the inactive, carazolol-bound structure (69). Thus, this inward movement causes a rotation and outward movement of TM6 leading a receptor activation (60). The structure of the β2AR bound to Gs have shown that the C-terminal α5 helix of Gα binds to the intracellular cavity that is opened by the movement of the cytoplasmic end of TM6 away from TM3 and towards TM5. The C-terminal α5 helix of the α-subunit interacts with the short loop connecting TM7 and Hx8, and the inner side of the cytoplasmic TM5 and TM6.
2.2.2 Interacting Partners
The life cycle of β2ARs, consists of biosynthesis in the endoplasmic reticulum (ER), maturation in the Golgi apparatus, transportation to the membrane, signal transduction and receptor internalization. β2ARs are coupled by interacting proteins and small molecules through these stages (70, 71). GPCR-interacting proteins (GIPs) are roughly heat-shock proteins, kinases (for example GRKs), GPCR-associated sorting proteins (GASPs), PSD-95/Discs-large/ZO-1 (PDZ) domain-containing proteins, G-proteins, arrestins and many more (70, 72). The heterotrimeric G-protein complex which is vital for GPCR signal transduction is consisting of subunits that are called Gα, Gβ and Gγ (73). Gα comprises two domains: a Ras domain and an alpha-helical domain. β2AR can
interact with two different G-proteins, Gs and Gi. The structure of the ternary complex of β2AR, Gs G-protein and agonist BI-167107 (PDB:3SN6) revealed how all the parts of the complex interact. The Ras domain of Gα contacts TM5 and TM6 of β2AR via its C-terminal helix (α5 helix) such that the G-protein complex binds to the the cytoplasmic face of β2AR. There are no interactions between β2AR and the Gβ or Gγ subunits. The binding site in β2AR into which Gα inserts is only available when TM6 is in its active conformation. Also, mutation of Phe139 to an alanine significantly reduces the binding of Gα to β2AR (74) suggesting the need for a hydrophobic residue at this position.
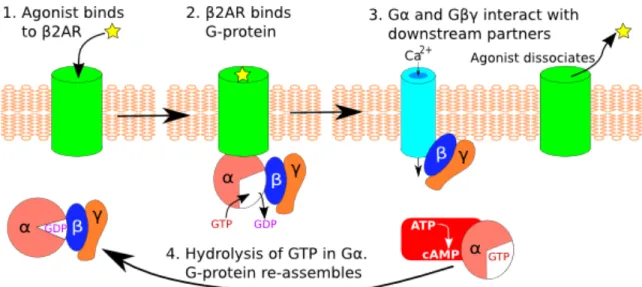
When an agonist binds to the extracellular side of β2AR, a signal to the cytoplasmic side of the GPCR emerges through conformational changes of the receptor. This rearrangement increase the affinity for the GDP-bound form of the G-protein αβγ trimer. Upon binding, the GDP in Gα is exchanged for GTP which causes dissociation of the G-protein complex from the receptor. Afterwards Gα and Gβγ regulate downstream processes separately. Gα subsequently hydrolyses its bound GTP, thus increasing the affinity for Gβγ and stopping the downstream signalling. The trimer is then able to bind to an activated GPCR once more, completing the cycle (75) (Figure 2.3 (76)).
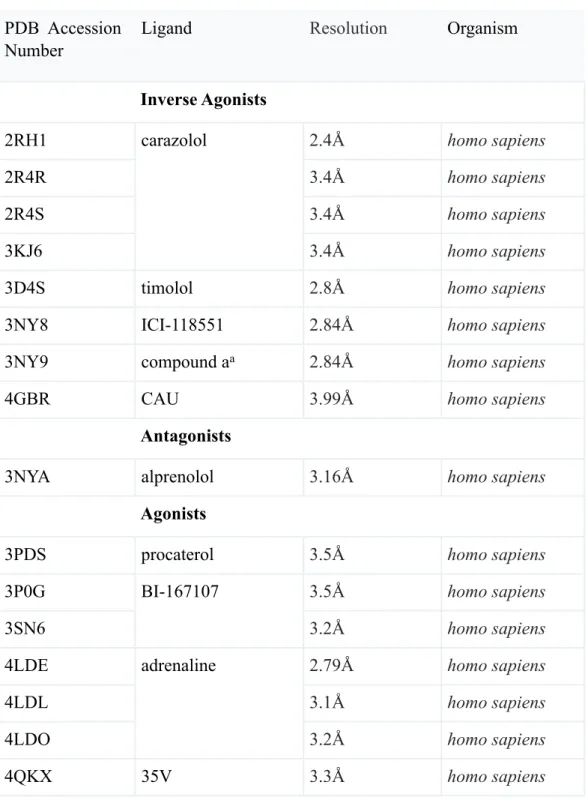
Table 2.2 Structures of β2AR are grouped based on the efficacy of the ligands: inverse agonists, antagonists, and agonists.
PDB Accession Number
Ligand Resolution Organism
Inverse Agonists Inverse Agonists Inverse Agonists
2RH1 carazolol 2.4Å homo sapiens
2R4R carazolol 3.4Å homo sapiens 2R4S carazolol 3.4Å homo sapiens 3KJ6 carazolol 3.4Å homo sapiens
3D4S timolol 2.8Å homo sapiens
3NY8 ICI-118551 2.84Å homo sapiens
3NY9 compound aa 2.84Å homo sapiens
4GBR CAU 3.99Å homo sapiens
Antagonists Antagonists Antagonists
3NYA alprenolol 3.16Å homo sapiens
Agonists Agonists Agonists
3PDS procaterol 3.5Å homo sapiens
3P0G BI-167107 3.5Å homo sapiens
3SN6
BI-167107
3.2Å homo sapiens
4LDE adrenaline 2.79Å homo sapiens
4LDL adrenaline 3.1Å homo sapiens 4LDO adrenaline 3.2Å homo sapiens 4QKX 35V 3.3Å homo sapiens
a Ethyl 4-[(2S)-2-hydroxy-3-[(propan-2-yl)amino]propoxy]-3-methyl −1- benzofuran −2-carboxylate.
Figure 2.3 An overall mechanism for β2AR (76)
β2ARs can bind two different arrestin proteins: arrestin-2 and arrestin-3 (non-visual arrestins) interact and regulate the activity of the receptor (77). Desensitization of β2ARs has been shown to be mediated by phosphorylation by G-protein-coupled receptor kinase 2 (GRK2) and followed by binding of arrestins to the phosphorylated receptor. Binding of arrestin to the receptor is a prerequisite for subsequent receptor desensitization.
2.2.3 β2ARs In Their Natural Habitat
Experimental data suggesting that the membrane environment affects oligomerization, stability, and activity of GPCRs. Clearly, the effects of the membrane environment are dependent on the lipid composition which are exist in different combinations in different cell types. Functionally relevant interaction of lipids with GPCRs have two different types: (1)-specific lipid-protein interactions, e.g., the binding of individual cholesterol
molecules to specific residues of the GPCR; and (2)-non-specific interactions, such as hydrophobic mismatch (78-82).
The membrane deforms differently near different parts of the GPCRs. A hybrid Continuum-MD (CTMD) method study concluded that the radial asymmetry of the membrane deformation is due to the radially asymmetric hydrophobic surface of the GPCRs, which have TMs of different hydrophobic lengths (83). This membrane deformation creates a context of adjacent hydrophobic and polar residues at specific sites of the GPCRs where hydrophobic matching may remain incomplete. Moreover, it is due to this radial asymmetry that there exist a few specific sites where specific lipid molecules such as cholesterol bind. The residual mismatch emerged from the hydrophobic mismatch carries a significant energy cost.
Although hydrophobic mismatch is energetically costly, membrane deformations do not achieve a complete hydrophobic matching at all TM segments (83), and residues in the TM-bundle can remain exposed to unfavorable hydrophobic-polar interactions. That adjacencies responsible for the residual exposure are a common feature of GPCRs. This is evident from the recently determined crystal structures and validated structural models of a variety of rhodopsin-like GPCRs, including B2AR (83-85).
2.2.4 Oligomerization
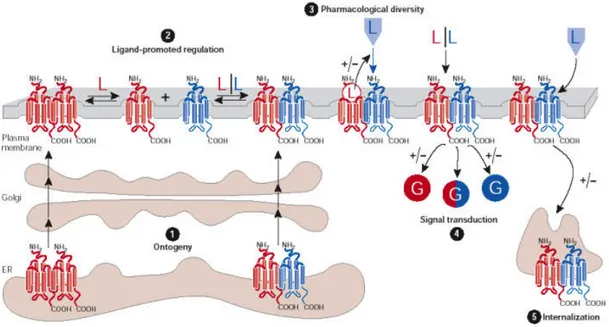
Dimerization of GPCRs is suggested to have roles in receptor maturation, G-protein coupling, downstream signalling and regulatory processes such as internalization. Figure 2.4 (86) summarize the five stages of the GPCRs that could be mediated by
dimerization. Cell fractionation studies by Salahpour et al. (13) revealed that β2AR homodimerization is an event occurring as early as the ER.
Figure 2.4 Potential roles of G-protein-coupled receptor (GPCR) dimerization (86)
In the membrane environment, the receptor activation is modulated by allosteric communication between protomers of GPCR dimers (87). Oligomerization evokes different activation patterns for the receptors. For instance, the complex consisting of two monomers and a single G protein, is activated by agonist binding to a single monomer and interestingly, inverse agonist binding to the second monomer enhances signaling. On the other hand agonist binding to the second monomer blunts signaling. Additionally, β2AR oligomerization is regulated by the binding of agonists or the G
protein (15). Therefore it seems like activation and oligomerization have correlative impacts on each other.
Hydrophobic mismatch stemmed from membrane environment, has been shown to promote oligomerization in several studies (79, 88, 89). Clearly, oligomerization reduce the energy cost caused by the residual mismatch. This underlies a stochastic nature for GPCR dimerization in addition to a ligand driven mechanism. A computational study by Periole et al. (90) explored the effects of hydrophobic mismatch on the oligomerization of rhodopsin, using the MARTINI force field. The results demonstrated that oligomerization is driven by frustration of lipid-protein interactions. Rhodopsin significantly altered the local membrane thickness, encouraging oligomerization as a way to reduce unfavorable protein-lipid interactions.
Continuum-Molecular Dynamics (CTMD) software tool yields an energetic quantification for the hydrophobic mismatch deformation in membrane bilayers. This method can predict an optimal monomeric orientation for the oligomers. Results from both CTMD calculations and coarse-grained simulations of the interaction of GPCRs in the membrane provided results consistent with the experimental observations, and brought important information on the mechanism of oligomerization (90, 91). Especially, these calculations suggest that GPCR oligomerization at “specific interfaces” reduces the hydrophobic mismatch and its energy cost (84, 85)
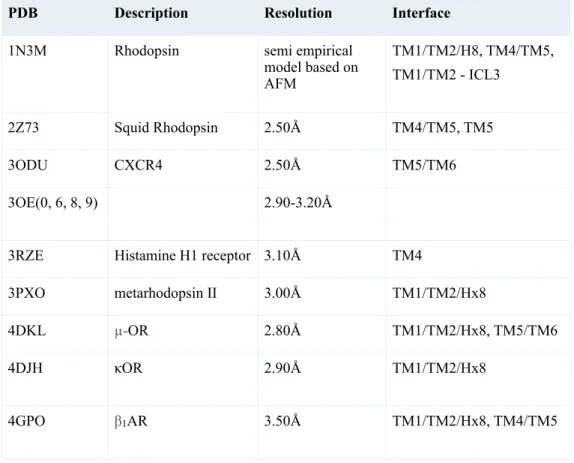
Several crystal structures with homo-oligomeric GPCRs have been published (66, 92-98) (See Table 2.3). The interface via TM1 and TM2 and Hx8 is observed in the
dimeric structures of µ-OR, β1AR, κOR, opsin, metarhodopsin II. The second interface of µ-OR comprises TM5 and TM6. Moreover the second interface of β1AR (consisting of TM4 and TM5) resembles the interface previously obtained for rhodopsin using atomic force microscopy (AFM) (99). The crystal structure of the histamine H1 receptor (97) contains a TM4 interface, which is different from the TM4/5 interface of β1AR due to the absence of TM5 contacts. Similarly, the structures of CXCR4 (94) and squid rhodopsin (98) contain a TM5 interface, which are different from TM5/6 interface of β1AR and µ-OR.
In a coarse grained study (58), a pair of the DOP ( a subtype of opioid receptors) receptor protomers generated by homology modeling, -using the crystal structure of the β2AR- was placed facing one another at a proposed symmetrical interface, involving residue 4.58, inferred from cysteine cross-linking data on this and other GPCRs (100, 101). This yielded two kinds of interfaces involving either,TM4 or TM4/TM5. The comparison of the interfaces revealed that the TM4 interface was marginally more stable than the interface involving both TM4 and TM5, indicating that the stability of the dimer pair is dependent on the region of contact between the protomers.
A recent Martini MD study which explores the dimerization of β2AR in lipid bilayers showed that cholesterol binds to TM4, and cholesterol occupancy at this site restricts its involvement at the dimer interface (102). This restriction enables TM1 and TM2 to present in the interface likewise the crystal structure of β1AR dimer.
Table 2.3 Crystal structures of homo-oligomeric GPCRs
PDB Description Resolution Interface
1N3M Rhodopsin semi empirical model based on AFM TM1/TM2/H8, TM4/TM5, TM1/TM2 - ICL3 2Z73 Squid Rhodopsin 2.50Å TM4/TM5, TM5 3ODU CXCR4 2.50Å TM5/TM6 3OE(0, 6, 8, 9) 2.90-3.20Å
3RZE Histamine H1 receptor 3.10Å TM4
3PXO metarhodopsin II 3.00Å TM1/TM2/Hx8
4DKL µ-OR 2.80Å TM1/TM2/Hx8, TM5/TM6 4DJH κOR 2.90Å TM1/TM2/Hx8
Chapter 3
Results and Discussion
3.1 Peptide Docking
To determine the binding affinity of TM6 (transmembrane 6) to monomer ß2AR (beta- adrenergic receptor), a set of docking experiments were conducted. In these docking runs, a peptide molecule consisting of a portion of TM6 was docked to monomer ß2AR using a rigid body approach where both peptide and monomer were taken as rigid entities with no rotatable bonds. The monomeric conformation of the receptor was taken from the X-ray crystallographic structure of ß2AR in complex with partial inverse agonist carazolol (PDB:2RH1, resolution: 2.40 Å). The complex structure includes another protein, T4 lysozyme (T4L), instead of the third intracellular loop (ICL3) region. The removal of highly unstructured ICL3 region had facilitated the crystallization process yielding a conformational stability.
In a previous Molecular Dynamics (MD) study (103), T4L was removed and the structure of ICL3 was generated via the homology modeling tool MODELLER (104). One 800 ns and three 100 ns long MD trajectories produced 5608 snapshots which were then clustered based on the root-mean-square deviation (RMSD) value of ICL3 after
being aligned to the starting conformation with respect to the transmembrane region. The clustering was performed using K-means algorithm implemented in the k-clust module of the Multiscale Modeling Tools for Structural Biology (MMTSB) Tool Set (105) and yielded a total of 18 clusters. All the snapshots in a cluster were averaged to produce a centroid and the conformation which would be closest to the centroid was selected as a representative of that cluster. The representatives of the 1st , 7th and the 11th clusters out of 18 are illustrated as in Figure 3.1. The side view and the view from the intracellular side (IC view) of these three representatives of the receptor reveals the positioning of ICL3 through the TM bundle. The 1st and 11th cluster representatives have looser conformations comparatively to the conformation of the 7th cluster representative. The position of ICL3 is distant from the TM bundles of the representatives in the 1st and 11th clusters. The representative of the 7th cluster was considered to be the most adequate conformer for the docking study, as it has the most packed ICL3 under the receptor (Figure 3.1a). This type of closely packed conformation would not block the way of another monomer/peptide when the receptor was found in a complex structure.
a b c
Figure 3.1 Schematic illustrations of the the 7th (a) ,1st (b) and 11th (c) clusters’ representative conformations which are closest to the centroids. The intracellular view (IC view) of the receptors are located under the side views of each conformations. 7th cluster representative’s ICL3 region (green colored) is closely packed under the transmembrane (a). The conformation closest to the 7th cluster’s centroid was chosen for the docking studies. Red colored region designated as TM6.
3.1.1 Short Peptide Docking
The short peptide molecule was derived from TM6 region consisting of residues from 276 to 296, GIIMGTFTLCWLPFFIVNIVH as synthesized in the experimental work by Hebert et al. (8). By adopting the same conformation as in the receptor, the peptide was rigidly docked to the receptor using AutoDock v4.0 software tool (106). Conformations were then reevaluated with a knowledge-based scoring function called DSXonline v0.88 (107). A rigid body approach was preferred due to computational difficulty of a whole flexibile peptide. Furthermore, a rigid peptide also represent a preserved helical segment likewise the corresponding TM6 preserves its secondary structure while it is embedded in the transmembrane bundle.
AutoDock was employed for the docking studies in order to fact that its capability to predict membrane protein complexes in a high accuracy rate (108-110). its robust and efficient The algorithm implemented in AutoDock was known as highly efficient in the blind docking peptide studies (111). The membrane environment was simply regarded by accounting the constitutive behavior of the GPCR dimers which eventually assign them as ligand independent and the formation of dimeric structure in the endoplasmic reticulum (13). In this way the lipid contribution to dimerization was excluded in this experiment.
AutoGrid v4.0 which is implemented in AutoDock was used to generate a three-dimensional energy grid prior to docking (106). Two different approaches were employed for determining the possible docking site for the peptide. First, a blind docking was performed using a grid box large enough to cover the entire receptor, yet
excluding the intracellular and extracellular loops as illustrated in Figure 3.2a. The grid spacing was increased to 0.45 Å to allow the highest amount of coverage. Taking the number of grid points as 126 (maximum allowed value) in xy dimensions and 95 in z dimension, the dimensions of the single box became 56.25 Å x 56.25 Å x 42.3 Å. By generating a grid volume that was large enough to cover the entire transmembrane region of the protein, a particular binding site preferred by the peptide over the other sites can be determined.
In the second approach, four separate grid boxes were generated with the default grid spacing of 0.375 Å. As shown in Figure 3.2b and Table 3.1, boxes #2 and #3 sufficiently cover almost all TM6 region whereas boxes #1 and #4 exclude this region completely. The number of grid points in all three xyz directions was set to 126 which is the maximum allowed number of grid points and corresponds to a dimension of 46.88 Å x 46.88 Å x 46.88 Å. For each five docking system as illustrated in Figure 3.2, a total of 200 docking runs were performed using Lamarckian genetic algorithm (GA-LS) (114) with default docking parameters (a sample parameter file for docking is given in Appendix A). At the end of each docking, all 200 conformers were clustered based on a 2 Å (RMSD) value. Additionally, all 200 poses were reevaluated with two knowledge-based scoring functions which are found in DSXonline v0.88 software tool.
a b
box #1 box #2
box #3 box #4
Figure 3.2 β2AR monomer inside (a) a single box with .45 Å grid spacing and 56.25 x 56.25 x 42.3 Å dimensions, (b) four smaller boxes each with .375 Å grid spacing and 46.88 x 46.88 x 46.88 Å dimensions. The transmembrane 6 is colored in red and the ICL3 is colored in green. (115)
In blind docking using one single box (See Fig. 3.2a), conformers from the first cluster and the highest populated cluster preferred TM5 and TM6 as the binding site. Representative structures taken from the first cluster and the highest populated cluster can be seen in Figure 3.3a and Figure 3.3c. Especially, the pose from the first cluster was found to be well aligned near TM6. Additionally, the profiles in Figure 3.3b and Figure 3.3d illustrates the interacting residues of the receptor within a 5Å distance from the docked peptide. Clearly, TM5 and TM6 dominate as the most preferred binding site.
Moreover, DSX/CDS and DSX/PDB score values of the first cluster were found to be the highest among the first clusters of five docking results as listed in Table 3.1. For docking runs inside box #1 and box #4 which do not include TM6 region, the most preferred binding site was determined as TM2, TM3 and TM4, as the peptide had the
highest AutoDock score value (See Figures 3.4a,b and 3.5a,b). The clustering analysis showed that the lowest energy clusters for box #1 and box #4, designated as the “first cluster” in Table 3.1, are the least populated among the others, with 38 and 43 conformations respectively. Also, the highest-populated cluster contains 109 and 73 conformers located mostly near TM3 and TM4 (See Figures 3.4c,d and 3.5c,d). Moreover, the DSX score value of their first cluster are the lowest ones among other first clusters, -89.9 and -93.3 for DSX/CDS and -100.2 and -98.4 for DSX/PDB.
For docking runs inside box #2 and box #3 which include the whole TM6 region, TM5 and TM6 were determined as the most preferred binding site regions (See Figures 3.6a-d). Interestingly, the number of conformations in the first cluster is found as 199 and 197 for boxes #2 and #3, respectively (See Table 3.1). This is a significant amount of conformers observed in the first cluster, considering the total number of conformers as 200. Moreover their DSX score values were found to be relatively high among all five docking runs. All these docking results are in the favor of TM5 and TM6 which can be suggested as the most preferred binding site with the highest number of docked conformers in the first cluster and the highest score values.
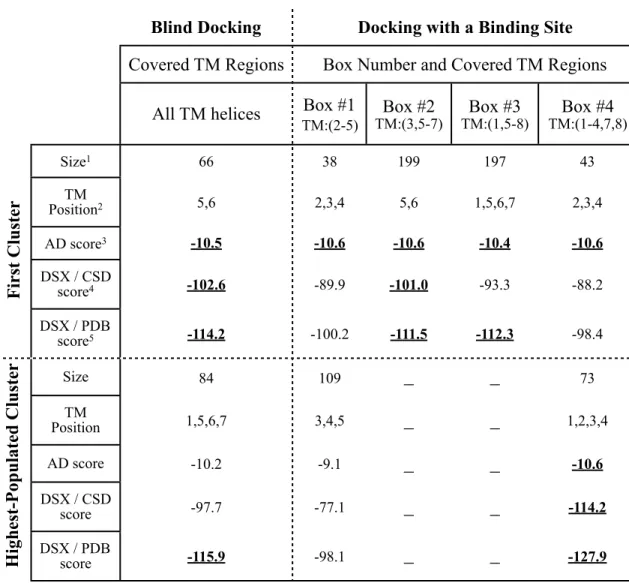
Table 3.1 Docking results for the short peptide consisting of residues from 276 to 296 in TMVI. (115)
Blind Docking Docking with a Binding SiteDocking with a Binding SiteDocking with a Binding SiteDocking with a Binding Site
Covered TM Regions Box Number and Covered TM RegionsBox Number and Covered TM RegionsBox Number and Covered TM RegionsBox Number and Covered TM Regions All TM helices Box #1
TM:(2-5) Box #2 TM:(3,5-7) TM:(1,5-8)Box #3 TM:(1-4,7,8)Box #4 Size1 66 38 199 197 43 TM Position2 5,6 2,3,4 5,6 1,5,6,7 2,3,4 AD score3 -10.5 -10.6 -10.6 -10.4 -10.6 DSX / CSD score4 -102.6 -89.9 -101.0 -93.3 -88.2 DSX / PDB score5 -114.2 -100.2 -111.5 -112.3 -98.4 Size 84 109 _ _ 73 TM Position 1,5,6,7 3,4,5 _ _ 1,2,3,4 AD score -10.2 -9.1 _ _ -10.6 DSX / CSD score -97.7 -77.1 _ _ -114.2 DSX / PDB score -115.9 -98.1 _ _ -127.9 F ir st C lu ste r H igh es t-P op u late d C lu ste r
1 Number of docked poses in the cluster
2 Transmembrane region to which the docked pose is within a distance of 5 Å at most. 3 Highest negative AutoDock score in the first cluster (kcal/mol)
4 DSX / CSD score of the best pose of AutoDock (unitless) 5 DSX / PDB score of the best pose of AutoDock (unitless)
In docking results of box #1 and box #4, the difference between the mean energies of clusters are less than 2.5 kcal/mol which is the standard deviation of the AutoDock force field (106). Therefore, it is not easy to predict which cluster is the correct one. The failure of AutoDock for these docking cases that do not include TM6 (box #1 and #4) suggests that there is no transmembrane helix strongly preferred in these confined regions. On the other hand, for docking runs where TM6 was incorporated, the docking results strongly suggest TM6 as the most preferred binding site based on both score value and the number of docked conformers in the first cluster.
On the other hand, it is important to mention about the orientations of these peptides with respect to the target monomer. Except the docking result of the highest populated cluster for box #4, in all docking runs the peptide was found to be antiparallel to ß2AR monomer. In other words, the amino acid sequence in the peptide is the reverse of the corresponding amino acid sequence in TM6 on the receptor. Although ß2AR dimers are known to exist in parallel orientations, previous studies have shown that in rare occasions they also form antiparallel dimers (49, 50, 74, 113, 114). However, despite this unfavorable orientation, the best pose of the peptide provide a valuable and satisfactory information about the preference of TM5 and TM6 over the other helices.
0 1 32 60 67 95 103 136 148 171 197 230 267 298 305 328 interacting residues residue number TM1 TM2 TM3 TM4 TM5 TM6 TM7 a b c d 0 1 32 60 67 95 103 136 148 171 197 230 267 298 305 328 interacting residues residue number TM1 TM2 TM3 TM4 TM5 TM6 TM7
Figure 3.3 (a) Snapshot of the short peptide’s best pose (green) using one single box, (b) the corresponding profile of the neighboring residues, (c) snapshot of the short peptide’s pose from highest-populated cluster (magenta) and (d) the corresponding profile of the neighboring residues. The dots on the peptides correspond to amino terminal end. TM6 region of the receptor illustrated in red. Interacting residues for the first cluster are Ile205, Tyr209, Val213, Met215, Val216, Phe217, Tyr219, Ser220, Arg221, Phe223, Gln224, Lys227, Gln231, Lys273, Gly276, Ile277, Met279, Gly280, Thr283, Leu284, Leu287, Ile291. Interacting residues for the highest populated cluster are Trp32, Gly35, Met36, Ile38, Val39, Ile43, Tyr219, Phe223, Lys273, Gly276, Ile277, Gly280, Thr281, Leu284, Trp313, Ile314, Val317, Asn318, Phe321, Leu324, Ile325, Arg328. (115)
a b c d 0 1 32 60 67 95 103 136 148 171 197 230 267 298 305 328 interacting residues residue number TM1 TM2 TM3 TM4 TM5 TM6 TM7 0 1 32 60 67 95 103 136 148 171 197 230 267 298 305 328 interacting residues residue number TM1 TM2 TM3 TM4 TM5 TM6 TM7
Figure 3.4 (a) Snapshots of the short peptide’s best pose (green) in box #1, (b) the corresponding profile of the neighboring residues, (c) snapshot of the short peptide’s pose from highest-populated cluster (magenta) in box #1 and (d) the corresponding profile of the neighboring residues. Interacting residues for the first cluster are Gln65, Tyr70, Thr73, Cys77, Val81, Phe104, Glu107, Phe108, Ser111, Ile112, Leu115, Arg151, Val152, Leu155, Met156, Trp158, Ile159, Gly162, Phe166, Leu167, Ile169, Gln170. Interacting residues for the highest populated cluster are Glu122, Val126, Val129, Asp130, Phe133, Lys140, Tyr141, Gln142, Leu144, Leu145, Ile153, Met156, Val157, Val160, Leu163, Thr164, Leu167, Pro168, Met171, Trp173, Ala202, Ser203, Val206, Ser207.
a b c d 0 1 32 60 67 95 103 136 148 171 197 230 267 298 305 328 interacting residues residue number TM1 TM2 TM3 TM4 TM5 TM6 TM7 0 1 32 60 67 95 103 136 148 171 197 230 267 298 305 328 interacting residues residue number TM1 TM2 TM3 TM4 TM5 TM6 TM7
Figure 3.5 (a) Snapshot of the short peptide’s best pose (green) in box #4, (b) the corresponding profile of the neighboring residues, (c) snapshot of the short peptide’s pose from highest-populated cluster (magenta) in box #4 and (d) the corresponding profile of the neighboring residues. Interacting residues for the first cluster are Gln65, Tyr70, Thr73, Cys77, Val81, Phe104, Glu107, Phe108, Ser111, Ile112, Leu115, Arg151, Val152, Leu155, Met156, Trp158, Ile159, Gly162, Phe166, Leu167, Ile169, Gln170. Interacting residues for the highest populated cluster are Val52, Ile55, Thr56, Ile58, Ala59, Lys60, Glu62, Gln65, Tyr70, Thr73, Cys77, Leu80, Val81, Leu84, Ala85, Phe89, Trp105, Phe108, Ile112, Leu115, Lys147, Arg151, Ile154, Leu155, Trp158, Phe166.
a b c d 0 1 32 60 67 95 103 136 148 171 197 230 267 298 305 328 interacting residues residue number TM1 TM2 TM3 TM4 TM5 TM6 TM7 0 1 32 60 67 95 103 136 148 171 197 230 267 298 305 328 interacting residues residue number TM1 TM2 TM3 TM4 TM5 TM6 TM7
Figure 3.6 (a) Snapshot of the short peptide’s best pose (green) in box #2, (b) the corresponding profile of the neighboring residues within a distance of 5Å, (c) Snapshot of the short peptide’s best pose in box #3, (d) the corresponding profile of the neighboring residues within a distance of 5Å. Interacting residues for box #2 are Tyr209, Val213, Met215, Val216, Phe217, Tyr219, Ser220, Arg221, Phe223, Gln224, Lys227, Gln231, Lys273, Gly276, Ile277, Met279, Gly280, Thr283, Leu284, Leu287, Ile291. Interacting residues for box#3 are Trp32, Gly35, Met36, Ile38, Val39, Ile43, Tyr219, Phe223, Lys273, Gly276, Ile277, Gly280, Thr281, Leu284, Trp313, Ile314, Val317, Asn318, Phe321, Leu324, Ile325, Arg328.
3.1.2 Long Peptide Docking
Seven distinct peptide molecules were derived from each helical transmembrane regions of ß2AR. Each peptide incorporates a large portion of the helix between residues 32-60, 67-95, 103-136, 148-171, 197-230, 267-298 and 305-328 corresponding to TM1 through TM7, respectively. Thus, for seven TM helices, seven independent blind docking experiments with 200 runs each, were performed using a single box with 0.45 Å grid spacing, similar to the blind docking of the short peptide. This approach enabled to compare the binding of TM6-derived peptide with those of other TM-derived peptides, to find out a possible significance of TM6 region to be at a certain site of the receptor, and consequently at the interface of a dimeric structure.
For each docking, all 200 docked poses were clustered with an RMSD value of 2 Å. The results of the first cluster and the highest-populated cluster are listed in Table 3.2. Remarkably, for all seven peptides, the best pose in the first cluster and the pose in the highest-populated cluster were always found near TM5, TM6 and TM7 regions. The score values ranked in the top three for all 10 clusters (7 first and 3 highest populated) are typed in bold and underlined as in the Table 3.1. Accordingly, the TM1-, TM2-, and TM6-derived peptides were found to dock with three high score values, which are all ranked in the top three and their best poses are located near TM5, TM6, and TM7 regions of the receptor. Moreover, for peptides derived from TM1 through TM4, the first cluster was observed to be the highest-populated cluster with a number of peptide conformations varying between 104 and 178, and additionally, their corresponding best
Table 3.2. Docking results for the seven long peptides derived from different transmembrane regions of the receptor.
Docked Peptide Docked Peptide Docked Peptide Docked Peptide Docked Peptide Docked Peptide Docked Peptide TM1 TM2 TM3 TM4 TM5 TM6 TM7 Size1 104 178 136 162 14 62 9 TM Position2 5,6 5,6,7 5,6,7 5,6,7 1,5,6,7 6,7 6,7 AD score3 -9.5 -9.8 -10.6 -9.8 -8.3 -9.1 -9.2 DSX / CSD score4 -95.7 -103.6 -86.3 -82.0 -79.7 -101.6 -78.2 DSX / PDB score5 -115.2 -71.8 -106.7 -99.2 -95.8 -121.5 -77.9 Size _ _ _ _ 52 73 58 TM Position _ _ _ _ 5,6,7 5,6,7 5,6,7 AD score _ _ _ _ -7.9 -8.8 -8.8 DSX / CSD score _ _ _ _ -100.3 -90.7 -97.4 DSX / PDB score _ _ _ _ -114.7 -111.0 -110.2 F ir st C lu ste r H igh es t-P op u late d C lu ste r
1 Number of docked poses in the cluster
2 Transmembrane region to which the docked pose is within a distance of 5 Å at most. 3 Highest negative AutoDock score in the first cluster (kcal/mol)
4 DSX / CSD score of the best pose of AutoDock (unitless) 5 DSX / PDB score of the best pose of AutoDock (unitless)
pose has a high negative AutoDock score varying between -10.6 and -9.5 kcal/mol. As listed in Table 3.2, the highest negative AutoDock score value of -10.64 belongs to TM3-derived peptide that was bound to the monomer near TM5, TM6, and TM7 regions. Moreover the highest negative DSX/PDB score value of -121.5 belongs TM6-derived peptide.
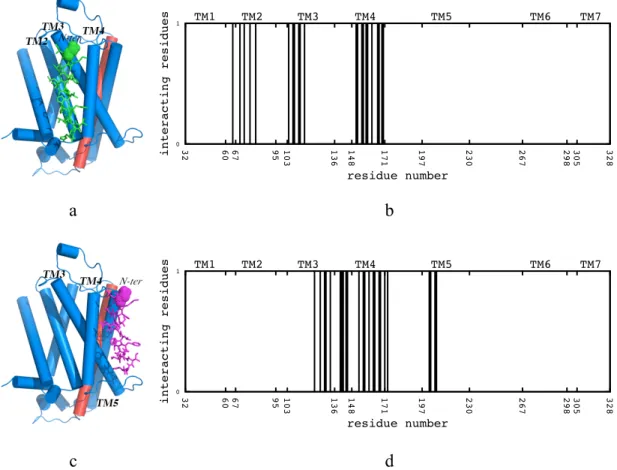
The position of the peptide conformation from the first cluster and the highest populated cluster were illustrated in Figure 3.7 alongside their interacting residues within a radius of 5 Å (See Figure 3.7b and d). Figure 3.7a and c illustrate the position of the best pose and the pose from the highest populated cluster of TM6-derived peptide interacting with the monomer’s TM6 region. Similar profiles for the other six peptides are given in Appendix B. While TM6-derived peptide's best pose docked in an antiparallel orientation to the receptor, the peptide from the highest populated cluster's orientation with respect to the receptor is almost 90 degrees. Even if it is known that antiparallel dimeric membrane proteins do exist, a 90° degrees orientation in one monomer in a dimeric membrane protein is not plausible. Although the spatial positions of the peptides were not favorable, it is remarkable that TM6-derived peptide preferred to docked to TM6 region of the receptor with a very high score among the other dockings.
a b c d 0 1 32 60 67 95 103 136 148 171 197 230 267 298 305 328 interacting residues residue number TM1 TM2 TM3 TM4 TM5 TM6 TM7 0 1 32 60 67 95 103 136 148 171 197 230 267 298 305 328 interacting residues residue number TM1 TM2 TM3 TM4 TM5 TM6 TM7
Figure 3.7 (a) Snapshot of the TM6-derived peptide’s best pose (green), (b) the corresponding profile of the neighboring residues within a distance of 5Å, (c) Snapshot of the TM6-derived peptide from the highest populated cluster (magenta), (d) the corresponding profile of the neighboring residues within a distance of 5Å. Interacting residues for the first cluster are Gln243, Asn244, Leu245, Ser246, Gln247, Ile277, Thr281, Leu284, Cys285, Pro288, Ile291, Val292, Leu302, Ile303, Val307, Leu310, Leu311, Trp313, Ile314, Val317, Asn318, Phe321, Leu324, Ile325, Arg328. Interacting residues for the highest populated cluster are Val213, Val216, Ser220, Hse241, Val242, Gln243, Asn244, Leu245, Ser246, Gln247, Ile277, Gly280, Thr281, Thr283, Leu284, Leu287, Pro288, Phe290, Ile291, Ile294, Val295, Phe321, Leu324, Ile325, Cys327, Arg328, Arg333. (115)
3.2 Protein-Protein Docking
In this part of the thesis, the protein-protein docking tool ZDOCK v3.0.2 (116) and HADDOCK2.2 (117, 118) was used to estimate the dimer structure of ß2AR and consequently the interface region. Two identical copies of the monomeric conformation of ß2AR, that were also used in the previous peptide dockings, were docked to each other to generate a set of dimer forms of the receptor, which are further analyzed with the membrane topology filtering, cluster analysis and rescoring. The existence of TM6 region at the interface of these dimeric structures had been investigated.
3.2.1 Setting up and analyzing the ZDOCK runs
ZDOCK program which is based on a FAST Fourier Transform takes two monomer coordinates as the input data and searches all possible binding modes in the translational and rotational space in order to estimate their relative orientation to generate the final complex structure. Moreover, it takes into account surface complementarity, electrostatics, and desolvation to find the optimal fit between two proteins.
The input parameters were provided via a web-based interface. Default parameters cannot be modified, however, one can select certain residues that are not likely to appear in the protein-protein interface and these residues will simply be blocked from the conformational search space.
The computing time scales as 1/∆3, where ∆ is the rotational sampling interval. A value of 6˚ was used since it provides more accurate predictions by sampling 54,000 poses.
The average computing time with a 6˚ rotational sampling interval and a total of 128 x 128 x 128 grid points with a spacing of 1.2 Å is 30 min on a 16-processor IBM SP3.
By default, the program can yield up to 2000 complexes that have the highest scores among 54,000 poses in a single run. To obtain the largest possible amount of distinct complexes, the docking runs were separated into two groups. In group A, two identical conformations of the receptor that include ICL3 were used as the initial conformations subjected to the docking runs. In the case of group B, two identical ß2AR structures excluding ICL3 were used as the input conformations. Furthermore, certain residues such as intra- and extracellular loop regions were blocked from being in the binding site during conformational search. Accepting the fact that the intracellular and extracellular loops couldn’t be located at the interface region, blocking the loops prevented the generation of unrealistic dimer conformers for a membrane protein.
A total of eight different ZDOCK runs were performed. Table 3.3 summarizes eight different layouts in protein-protein docking experiments, each generating 2000 complexes, which amounts to a total of 16,000 conformers to be analyzed.
All 16,000 dimer conformations were filtered based on their “membrane topology” feature consisting of the tilt angle about the z-axis that is perpendicular to the surface of the membrane and the z-offset taken as the displacement of the geometrical center of the monomer along the z-axis. The tilt angle is calculated as the angle between the first principle coordinate axis and the z-axis. 0.4 radians and 6 Å were employed as maximum allowable values for tilt angle and z-offset, respectively.
Consequently, a total of 149 conformations have passed the membrane topology filtering. Further examination of these 149 conformations revealed that 47 of them were parallel dimers with monomers oriented in the same direction, whereas the remaining 102 conformers had the two monomers arranged with an antiparallel orientation. Although the antiparallel association was considered as a rare and nonphysiological state, it was previously observed in several crystal packing of GPCRs (49, 60, 74, 113, 114) .
Table 3.3. Set of docking experiments with different conformers and blocked residues.
Set # Presence of ICL3 Blocked residues # of complexes
1 Yes NONE 2000
2 Yes ECL21 and ICL32 on one monomer 2000
3 Yes All loops3 on one monomer 2000
4 Yes All loops on both monomers 2000
5 No NONE 2000
6 No ECL2 on one monomer 2000 7 No All loops3 on one monomer 2000
8 No All loops3 on both monomers 2000
1 Extracellular loop region incorporating residues from 172 to 196. 2 Intracellular loop region incorporating residues from 231 to 262.
3 All intra and extracellular regions from 61 to 66, 96 to 102, 137 to 147, 172 to 196, 231 to 266, 299 to 304, 329 to
342. G roup A G roup B