http://journals.tubitak.gov.tr/agriculture/ © TÜBİTAK
doi:10.3906/tar-1508-27
High levels of segregation distortion in the molecular linkage map of bread wheat
representing the West Asia and North Africa region
Faheem Shehzad BALOCH1,*, Ahmad ALSALEH2,3, Enver Ersoy ANDEDEN2,**, Rüştü HATİPOĞLU1, Miloudi NACHIT3, Hakan ÖZKAN1,***
1Department of Field Crops, Faculty of Agriculture, Çukurova University, Adana, Turkey
2Department of Biotechnology, Institute of Natural and Applied Science, Çukurova University, Adana, Turkey 3International Center of Agricultural Research in Dry Areas, Aleppo, Syria
1. Introduction
Bread wheat (Triticum aestivum L.) is one of the most widely grown crops in the world. It is a polyploid species with a huge genome size of 16 GB/1 C (Bennett and Smith, 1976) and a nuclear genome that is characterized by seven homologous chromosome groups. Modern bread wheat is a true breeding hybrid of its ancestors, linked to wild grass species, which still grow in the Fertile Crescent (Patnaik and Khurana, 2001). Bread wheat has been subjected to many genetic studies, and several genetic linkage maps have been constructed in the last few decades by using different molecular markers. The genetic map of wheat was first based on restriction fragment length polymorphisms (RFLPs), published by Cadalen et al. (1997), and additional maps were later published by integrating various DNA-based molecular markers such as amplified fragment
length polymorphisms (AFLPs), random amplified polymorphic DNA (RAPD), and simple sequence repeats (SSRs). Candidate genes and quantitative trait loci (QTLs) that are associated with important agronomic traits such as flowering time, yield components, quality traits, disease, and pest resistance have been assigned to these maps. Furthermore, some diagnostic markers have been cloned that are now available in wheat for marker-assisted selection (MAS) of dwarfing genes (Yediay et al., 2011), wheat-rye translocations (Yediay et al., 2010), vernalization genes, and genes responsible for photoperiod sensitivity (Andeden et al., 2011) and grain softness. However, QTLs/ genes associated with yield and other traits of economic interest must be identified to ensure the future success of wheat breeding. Due to the large and complex genome of bread wheat, QTL mapping for most traits remains distant.
Abstract: The Fertile Crescent is a primary center of wheat domestication and diversity. Despite its importance for bread wheat breeding,
few efforts have been made to fully understand the genetic structure of the Anatolian bread wheat. A lack of information regarding the genetic structure of the bread wheat from this region is evident. Therefore, this study aimed to provide new insights into the genetic structure of bread wheat from Anatolia. A genetic linkage map was constructed based on recombinant inbred lines derived from a cross between the Turkish cultivar Gerek-79 and the Moroccan cultivar Arrehane, by using DArT markers anchored with simple sequence repeat markers. This map consisted of 54 linkage groups belonging to 21 bread wheat chromosomes, spanning a total of 935.629 cM. The total number of mapped markers varied from 5 to 87, depending on the chromosome. Seventy-seven DArT markers with unpublished chromosomal locations were mapped on different chromosomes, whereas 23 were mapped onto chromosomes that deviated from those detailed in the literature. This linkage map represents a key starting point towards our understanding of the genome structure of Anatolian bread wheat, which would, in turn, permit us to genetically dissect important agromorphological and quality characteristics. This linkage map will be useful for the identification of QTL for biotic and abiotic stresses, and for important agronomic traits that are valuable for Anatolian wheat.
Key words: Bread wheat, genetic map, Turkey, DArT, DNA markers, segregation distortion, Fertile Crescent
Received: 09.08.2015 Accepted/Published Online: 22.01.2016 Final Version: 18.05.2016 Research Article
* Current address: Department of Field Crops, Faculty of Agricultural and Natural Sciences, Abant İzzet Baysal University, Bolu, Turkey
** Current address: Department of Molecular Biology and Genetics, Faculty of Science and Letters, Nevşehir Hacı Bektaş Veli University, Nevşehir, Turkey
Therefore, to identify new QTLs and to increase the efficiency of QTL mapping and MAS, new and updated high-density genetic linkage maps should be constructed using germplasm of diverse origins with many PCR-based markers in bread wheat.
Plant breeding is a long-term process, and molecular tools can be used to overcome difficulties and to ensure the development of more rapid breeding strategies (Alsaleh et al., 2014). The future success of crop breeding relies on the effective utilization of available genetic diversity and on the identification of important genes/QTLs by genetic resources. Various DNA-based molecular marker technologies (such as RFLP, RAPD, AFLP, SSR, ISSR, SRAP, DArT, and SNP) have been developed over the last three decades. These DNA marker technologies differ in their efficiency when used to genotype agricultural crops, and they have some pros and cons according to the nature of their inheritance. Among the various molecular marker techniques that have been developed over the past two decades, microsatellites or SSR markers are attractive for population genetic research and for genomic mapping, owing to their codominant nature, abundance in the genome, high polymorphism, high repeatability, and reliability, as well as the high degree of information they carry. SSRs have become the markers of choice for cereal genetic analysis and mapping.
Diversity array (DArT) markers involve the use of methylation-sensitive restriction enzymes to digest genomic DNA, which therefore reduces the genome complexity and enriches the low copy sequences for marker development. DArT marker systems are very cost-effective and highly reproducible. DArT marker technology permits several hundred polymorphic loci that are distributed across the whole genome to be genotyped simultaneously without any previous sequence information. As a result, this technology was originally developed for rice, a diploid crop with a small genome of 430 Mbp, and is now available for whole-genome profiling in more than 60 organisms, including many less-privileged crops (Petroli et al., 2012). The DArT system has been applied in various plant species, including in linkage and QTL analysis in barley (Wenzl et al., 2004), durum and bread wheat (Semagn et al., 2006), pigeon pea (Yang et al., 2006), eucalyptus (Petroli et al., 2012), and many other plant species.
Turkey is a major producer of bread wheat in the world. During the last 35 years, wheat production in Turkey has steadily increased, reaching about 21 × 106 t/year out of 9 × 10⁶ ha, the seventh largest area in the world (Andeden et al., 2011). Genetic resources from Turkey have contributed significantly to increased wheat production in many countries. Germplasm exploration and collection, resulting in samples from different countries and landraces (e.g., Turkey Red), were evaluated and used to breed new
varieties (Yediay et al., 2011). In Turkey, modern wheat breeding began in 1925. The main goal was to select lines that were adapted to different regions of the country from the local population. This breeding effort quickly produced many cultivars. In 1967, the National Wheat Release and Training Project was established, with the contribution of international organizations, resulting in the Turkish Green Revolution. Since then, many cultivars and breeding lines have been introduced from international research centers such as the International Center for Agricultural Research in the Dry Areas (ICARDA) and the International Maize and Wheat Improvement Center (CIMMYT). Unfortunately the genetic structure and QTLs of these cultivars remain largely unknown. Here, for the first time, we have attempted to develop a linkage map of bread wheat by using the local Turkish cultivar Gerek-79 and the Moroccan cultivar Arrehane, representing the West Asia and North Africa (WANA) region. The WANA region, with Morocco in Northwest Africa and Turkey in Northwest Asia, is characterized by high population growth, low and erratic rainfall, limited arable land, and severely limited water resources. A few genetic linkage maps were constructed using germplasm from this region and some QTL studies have been done to dissect the genetics of complex traits. Therefore, we have attempted to develop a linkage map, using DArT anchored with SSR markers, in order to test and verify the efficiency of DArT markers for use in linkage studies of bread wheat. We also expect that this linkage map will represent the first study using a local cultivar from Turkey, as well as a cultivar from Morocco, and this map will be used for QTL dissection for agronomic traits in further studies.
2. Materials and methods 2.1. Plant material
The mapping population consisted of 114 F7 generations of recombinant inbred lines (RILs) developed through the single-seed descent method at ICARDA from a cross between the two cultivars Gerek-79 and Arrehane. The parents were chosen because they exhibited contrasting characters associated with morphology and quality, and different responses to biotic and abiotic stresses. The wheat parent Gerek-79 (Mentana/Mayo-48//4-11/3/Yayla-305) was released as a cultivar in Turkey in 1967. This is a winter type and is adapted to high altitude areas. It is drought- and cold-tolerant, tall and late-flowering, and has thinner and shorter grains with poor kernel characteristics. The wheat parent Arrehane is a spring bread wheat cultivar, bred at National Institute of Agricultural Research (IRNA) and released as a commercial cultivar in Morocco in 1996. It is a semidwarf that exhibits early heading, drought susceptibility, and resistance to the Hessian fly, and it combines characteristics associated with adaptation, high
yield potential, and yield stability. These parents contrast in their major agronomic traits, such as 1000-kernel weight, spike characteristics, and days to heading, as well as physical characteristics of the kernel such as grain length, width, height, and area.
2.2. Molecular analysis and genotyping 2.2.1. DNA extraction
Leaf samples were collected from all RILs along with the two parents, frozen in liquid nitrogen, and stored at –70 °C until use. Genomic DNA was extracted from leaf tissue according to the CTAB method described by Doyle and Doyle (1990), with minor modifications as reported by Baloch et al. (2010).
2.2.2. Simple sequence repeat analysis
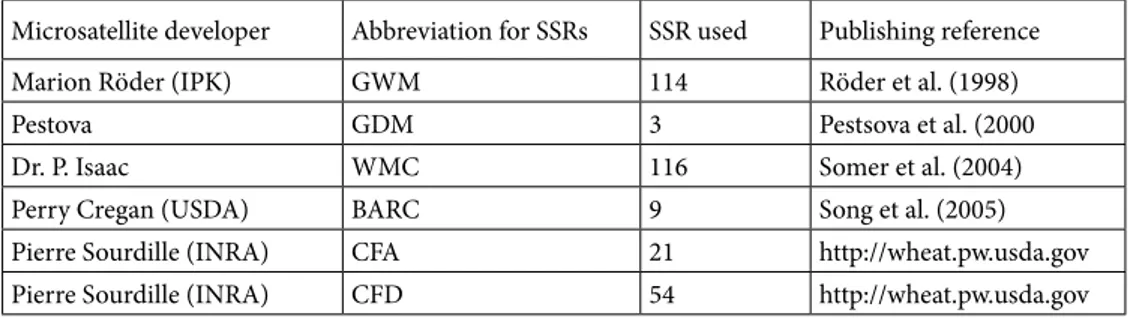
The SSR markers used in this study were selected from previous published literature (Röder et al., 1998). The origins of SSR markers used in this study are given in Table 1. In total, 317 SSR primers, previously mapped to the A, B, and D genomes, were used to screen for polymorphisms between Gerek-79 and Arrehane. Only 65 SSR primers showed polymorphisms among parents. First, M13 tailed-primer PCR amplification of SSRs was performed according to the method described by Cömertpay et al. (2012). M13 tailed-SSR markers produced some nonspecific amplification products. To reduce or eliminate nonspecific amplification of M13 tailed-SSR markers, different concentrations of the M13 primer (0.2, 0.4, 0.6, 0.8, and 1.0 pmol) and MgCl2 (0.2, 0.4, and 0.6 µL; 2.5 mM) were used. The M13 primer at a concentration of 0.6 pmol and MgCl2 in the amount of 0.6 µL (at 2.5 mM concentration) led to the best results, and minimum nonspecific amplification was observed.
The PCR mixture consisted of a total volume of 12 µL containing 1X PCR buffer (1.2 µL), 2.5 mM dNTP (0.96 µL), 25 mM MgCl2 (0.4 µL), 0.6 pmol universal M13 sequence tailed forward primer, 5 pmol (0.12 µL of forward and 0.48 µL of reverse) primer, 0.12 U/µL Taq DNA polymerase, and approximately 15 ng of genomic DNA. The PCR cycling program consisted of an initial
denaturation step of 94 °C for 5 min; 30 cycles of 94 °C for 1 min, annealing temperature (depending on primer) for 1 min, and 72 °C for 1 min; eight cycles for the M13 labeled primer consisting of 94 °C for 30 s, 53 °C for 45 s, and 72 °C for 45 s; and a final extension at 72 °C for 15 min. Polymorphism between the parents and the segregation of polymorphic alleles were revealed when samples were electrophoresed on a denatured polyacrylamide gel using a LICOR DNA analyzer (Model 4300).
2.2.3. DArT analysis
A detailed account of the methods used to prepare the high-density bread wheat DArT array has been previously reported (Petroli et al., 2012). Genomic DNA of two parental lines and 114 RILs were sent to Triticarte Pty. Ltd. (http:// www.triticarte.com.au or http://www.diversityarrays.com/). 2.2.4. Marker evaluation, segregation analysis, and map construction
Two parameters were used to eliminate problematic markers for linkage analysis. Clones with a P value (an estimate of marker quality) higher than 70 and a call rate (percentage of valid scores in all possible scores for a marker) of 80% or higher were selected for mapping analysis. DArT markers with a polymorphism information content (PIC) value of less than 0.304 were also removed from the linkage map analysis.
Diversity array technology segregation data were merged with the segregation data for 65 SSR markers. For each segregating marker, a chi-square analysis was performed to test for deviation from the 1:1 expected segregation ratio. JoinMap 3.0 was used to assign markers to linkage groups by employing a logarithm of the odds (LOD) with threshold values ranging from 3.0 to 5.0 (Van Ooijen et al., 2002). Recombination distances were determined using the Kosambi mapping function (Kosambi, 1944). The relative order of SSR markers was compared with previously published wheat microsatellite maps. The Map Chart Ver. 2 computer software program was used to draw linkage groups by using cM values obtained from the JoinMap program.
Table 1. Summary of wheat-obtained different source microsatellites used in the Gerek-79 × Arrehane
mapping population.
Microsatellite developer Abbreviation for SSRs SSR used Publishing reference
Marion Röder (IPK) GWM 114 Röder et al. (1998)
Pestova GDM 3 Pestsova et al. (2000
Dr. P. Isaac WMC 116 Somer et al. (2004)
Perry Cregan (USDA) BARC 9 Song et al. (2005)
Pierre Sourdille (INRA) CFA 21 http://wheat.pw.usda.gov
3. Results
A linkage map of Anatolian bread wheat was constructed using DArT markers anchored with SSR. Linkage analysis was conducted with 883 DArT markers. Out of 883 DArT markers used for mapping, 827 were mapped on different linkage groups, whereas the remaining 56 DArT markers were not mapped and remained unlinked. Out of 827 DArT markers, 23 were mapped on chromosomes different from their known location as reported in the published literature. Similarly, 77 DArT markers (9.3%), the chromosomal locations of which were until now not reported in the literature, were clustered on different chromosomes.
In total, 317 SSR markers were screened for polymorphisms between two parents that were previously mapped in genomes A, B, and D. Out of these, only 64 markers (20%) were polymorphic among the whole set of 114 RILs.
In the present genetic map construction, SSR markers were selected to anchor DArT markers on all 21 chromosomes of bread wheat. Unfortunately, some of the chromosomes remained without SSR markers due to the lack of polymorphisms in SSR markers for those chromosomes. Out of 64 polymorphic SSR markers, only 39 were mapped on different chromosomes, whereas the remaining 25 were not linked and remained unmapped. Some SSR markers were clustered with DArT, but were not mapped on the linkage groups due to weak or insufficient linkages between SSR and DArT markers. This reinforces the need to include a high number of SSR markers in the map, as well as other types of markers (non-DArT markers), to cover all possible genomic regions.
3.1. Genome coverage
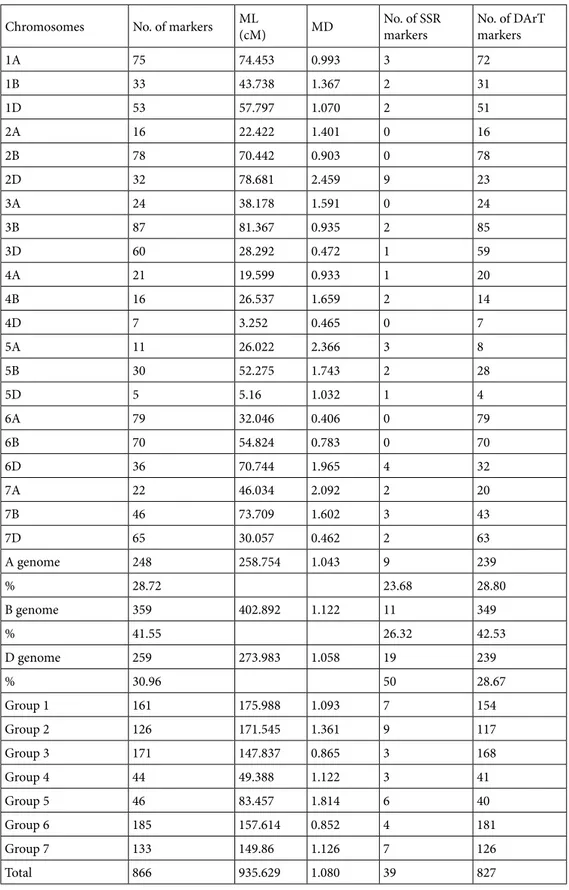
The final genetic map consisted of 866 markers, including 827 DArT and 39 SSR markers, which were assigned to all 21 chromosomes, spanning a total map length of 935.629 cM (Figures 1a and 1b). The total number of markers mapped varied from 5 to 87 depending on the chromosome (Table 2). Chromosomes 5D and 4D contained the least number of markers (five and seven markers, respectively), whereas chromosome 3B contained the highest number of mapped markers (87). The average number of mapped markers per chromosome was 41.2 and the map length of the chromosomes varied from 3.252 to 81.367 cM. Chromosome 4D had the shortest map length (3.252 cM), whereas chromosome 3B had the longest map length (81.367 cM), with an average map length of 44.54 cM. There was also variation in marker density per chromosome (Table 2). The density of markers on the map varied from 0.465 cM/marker on 4D to 2.459 cM/marker on chromosome 2D, with an average density of 1.080 cM/ marker.
The distribution of molecular markers, assignment, and cM coverage across the 21 bread wheat chromosomes
in the A, B and D genomes is given in Table 2. Genome B contained the highest number of markers (359 markers), compared with genome D (259 markers) and genome A (248 markers). The total map length of genome B was 402.892 cM, which was longer than those of genomes D (273.983 cM) and A (258.754 cM). Genome D contained 20 SSR markers, whereas 10 and 9 SSR loci were assigned to genomes B and A, respectively.
There was also a large variation in the number of markers, the length of chromosomes, and the marker density based on the homologous groups (Table 2). The highest number of markers was placed on homologous group 6 with 185 markers, followed by homologous group 3 (171 markers), homologous group 1 (161 markers), homologous group 7 (133 markers), and homologous group 2 (126 markers). The lowest number of markers was grouped in homologous group 4 with 44 markers, followed by homologous group 5 (46 markers). Homologous group 4 was the group with the shortest map length (49.388 cM), followed by homologous group 5 (83.457 cM). On the other hand, homologous group 1 had the largest map length (175.988 cM) followed by homologous group 2 (171.545 cM). The lowest marker density was noted in homologous group 6, at 0.852 cM/marker, whereas the highest marker density was recorded in homologous group 5 at 1.814 cM/ marker, followed by homologous group 2 with marker density of 1.361 cM/marker. The highest number of SSRs was mapped on homologous group 2 having nine SSR markers, followed by homologous groups 1 and 7, each having seven SSR markers. Homologous group 5 had six SSR markers. Homologous groups 3 and 4 each had three SSR markers, whereas homologous group 6 had four.
Chi-square analysis of the number of markers mapped to each linkage group indicated a significant deviation from that anticipated based upon linkage group length. Segregation analysis data indicated that 63.88% of markers were inherited from Gerek-79 and that 14% were inherited from Arrehane. Significant (P < 0.01) segregation distortion was detected for 746 markers, which was 78% of the total used for linkage analysis.
4. Discussion
4.1. Map comparison and marker order
The development of several types of molecular markers in the last 30 years has greatly facilitated the construction of genetic linkage maps for a variety of crop species. A prerequisite for the construction of genetic linkage maps is the availability of polymorphic molecular markers. In the last decade, the efficiency of genetic mapping in wheat and many other crops has been improved significantly with the increasing availability of another class of polymorphic markers called DArT markers. DArT markers are among the most widely used tools in the generation of
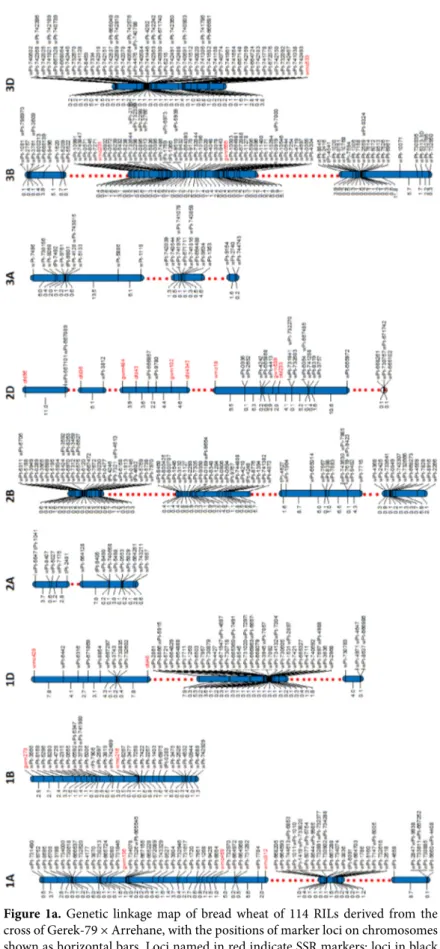
Figure 1a. Genetic linkage map of bread wheat of 114 RILs derived from the
cross of Gerek-79 × Arrehane, with the positions of marker loci on chromosomes shown as horizontal bars. Loci named in red indicate SSR markers; loci in black indicate DArT markers. Map distances are shown in cM.
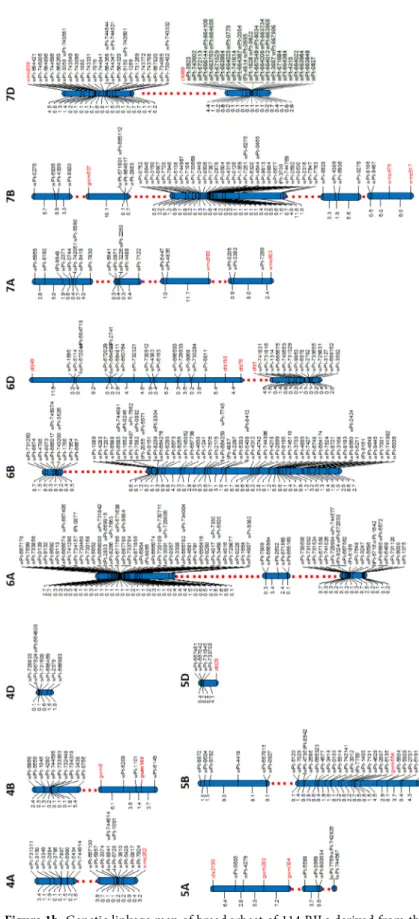
Figure 1b. Genetic linkage map of bread wheat of 114 RILs derived from the
cross of Gerek-79 × Arrehane, with the positions of marker loci on chromosomes shown as horizontal bars. Loci named in red indicate SSR markers; loci in black indicate DArT markers. Map distances are shown in cM.
Table 2. Distribution of molecular markers, assignment, and cM coverage across the 21 bread wheat
chromosomes with 7 homologous groups.
Chromosomes No. of markers ML (cM) MD No. of SSR markers No. of DArT markers
1A 75 74.453 0.993 3 72 1B 33 43.738 1.367 2 31 1D 53 57.797 1.070 2 51 2A 16 22.422 1.401 0 16 2B 78 70.442 0.903 0 78 2D 32 78.681 2.459 9 23 3A 24 38.178 1.591 0 24 3B 87 81.367 0.935 2 85 3D 60 28.292 0.472 1 59 4A 21 19.599 0.933 1 20 4B 16 26.537 1.659 2 14 4D 7 3.252 0.465 0 7 5A 11 26.022 2.366 3 8 5B 30 52.275 1.743 2 28 5D 5 5.16 1.032 1 4 6A 79 32.046 0.406 0 79 6B 70 54.824 0.783 0 70 6D 36 70.744 1.965 4 32 7A 22 46.034 2.092 2 20 7B 46 73.709 1.602 3 43 7D 65 30.057 0.462 2 63 A genome 248 258.754 1.043 9 239 % 28.72 23.68 28.80 B genome 359 402.892 1.122 11 349 % 41.55 26.32 42.53 D genome 259 273.983 1.058 19 239 % 30.96 50 28.67 Group 1 161 175.988 1.093 7 154 Group 2 126 171.545 1.361 9 117 Group 3 171 147.837 0.865 3 168 Group 4 44 49.388 1.122 3 41 Group 5 46 83.457 1.814 6 40 Group 6 185 157.614 0.852 4 181 Group 7 133 149.86 1.126 7 126 Total 866 935.629 1.080 39 827
dense genetic maps. In the present study, we report the construction of a 935.629 cM interval genetic linkage map of F7 RIL mapping population lines derived from a cross of Gerek-79 × Arrehane. Out of these, 827 DArT and 39 SSR markers were mapped and those remaining (56 DArT and 26 SSR) could be attributed to different linkage groups but were impossible to map.
The order of the DArT and SSR markers was evaluated with regression mapping. The positions of 827 DArT and 39 SSR marker loci mapped in the present study were compared with previously published maps of bread and durum wheat. Tentative assignment of the chromosomal location of each DArT marker was also provided by Triticarte Pvt. Ltd., based on many well-curated genetic maps that were built and analyzed by the Triticarte team. DArT markers were compared with consensus bread wheat maps published by Akbari et al. (2006), Semagn et al. (2006), Crossa et al. (2007), and Mantovani et al. (2008). SSR markers were compared to the bread wheat consensus map published by Somers at al. (2004), the ITMI map published by Song et al. (2005), and the bread wheat map of Zhang et al. (2008).
The linkage map generated here is consistent with other published intervarietal maps in terms of the positions and orders of commonly mapped markers (Figures 1a and 1b). The frequency (9.8%, 81 out of 827) of mapped DArT and SSR markers on the Gerek-79 × Arrehane map was similar to previously published wheat maps (Akbari et al., 2006; Semagn et al., 2006; Crossa et al., 2007; Mantovani et al., 2008). Of these, 81 DArT and 39 SSR markers were used as anchors to compare the order and position of markers on our map. There were small discrepancies in the order of markers when compared with different maps. Some rearrangements, inversions, and translocations of markers were observed in the Gerek-79 × Arrehane linkage map when compared with previously published DArT genetic linkage maps (Akbari et al., 2006; Semagn et al., 2006; Mantavoni et al., 2008; Peleg et al., 2008). Semagn et al. (2006) reported that differences in the order of markers between different genetic maps are not surprising as genetic mapping only gives an indication of the relative positions of each marker. Mantavoni et al. (2008) also illustrated that different orders of some markers are acceptable and that inconsistency in the map position could be explained by the presence of additional loci in the wheat genome.
The length of the map described in the present study was shorter than those of previously published bread wheat maps (Paillard et al., 2003; Quarrie et al., 2005; Akbari et al., 2006; Huang et al., 2006; Semagn et al., 2006; Li et al., 2007). There could be several reasons for the shorter map length in the present study. The DArT markers amplify redundant clones and then hybridize with the amplified clones to produce hundreds of fragments. However, this
large number of fragments results from a few genomic areas resulting in very close genetic distances. In our study, the average distance between two DArT loci was 0.6 cM. Low average distance between two consecutive DArT loci has been reported in many species, including bread wheat. Liu (1998) reported that marker coverage and genetic map density are influenced by many criteria such as polyploidy nature, genome length, number of markers, types of markers, distribution of markers, crossovers in the genome, mapping population size, and mapping strategy. The clustering of tightly linked DArT markers and the very low number of loci on some chromosomes in the Gerek-79 × Arrehane genetic linkage map could be explained in two ways. It might reflect the genetic situation in the population used in this study, or it might be due to specific features of the applied DArT markers.
4.2. Linkage groups
Linkage mapping in the present study identified 54 linkage groups, many of which contained more than the 21 haploid chromosomes of hexaploid wheat. The number of linkage groups varied among different chromosomes and genomes. The number of linkage groups per chromosome varied from one for 1B, 1D, 3D, 4D, and 5D to five for 7B. There could be several reasons for the higher number of linkage groups per chromosome. Large numbers of linkage groups compared with the haploid chromosomes number suggest that several genomic regions remain undetected with the present set of markers. Theoretically, the number of linkage groups should be equal to the number of haploid chromosomes, such that the genetic linkage map should include 21 linkage groups. However, this map has 54 linkage groups with 33 extra groups. Few linkage groups have only a small number of markers. This means that a larger number of markers should be included, particularly non-DArT markers, to saturate the linkage map. Similarly, a higher number of linkage groups was also reported in durum wheat. For example, 21 linkage groups were reported for JK × Ch1 (Nachit et al., 2001), 18 for MDM (Elouafi and Nachit, 2004), 23 for the K/S map (Maccaferri et al., 2008), 25 for Meridiano × Claudio, 20 for Colosseo × Lloyd (Trebbi et al., 2011), and 26 for consensus parental maps (Vaissayre et al., 2012), instead of 14 linkage groups of durum wheat. In the present study, the linkage map was constructed with 866 markers, which is higher than that used for most of the previous published maps (Suenaga et al., 2005; Semagn et al., 2006; Nalini et al., 2007). Despite the large number of markers used in the present study, several genomic regions remained undetected. Use of the DArT markers could be a possible cause of the large number of linkage groups. Iqbal et al. (2012) reported that DArT markers could be biased to certain genome regions, suggesting that a large number of markers amplified the same genomic region. Most of the markers amplified very
close to some genomic region, resulting in the gap between markers causing a large number of groups.
4.3. Marker evaluations
In the Gerek-79 × Arrehane linkage map, marker distribution along the linkage groups was far from uniform, with clusters of tightly linked loci and regions with small numbers of low density markers. The distribution of DArT markers over chromosomes as well as in the homologous groups varied; some chromosomes remained unsaturated with a low number of markers. Although some chromosomes contained a high number of markers, the chromosome length was very short, showing that most of the DArT markers were tightly linked. Homologous groups 5 and 4 contained the lowest number of DArT markers; in particular, 5D and 4D contained only five and seven markers, respectively. The low density of DArT markers in group 5 has been previously reported in both bread and durum wheat in mapping studies (Mantovani et al., 2008). Akbari et al. (2006) and Semagn et al. (2006) mapped only three markers on 5A and no DArT markers on chromosome 4A over several hundred successfully mapped DArT markers. Mantovani et al. (2008) also reported insufficient coverage of DArT markers on homologous groups 4 and 5. Underrepresentation of the polymorphic fragments on groups 5D, 5A, and 4D in the present Gerek-79 × Arrehane linkage map might be due to the activity of methylation-sensitive restriction enzymes such as PstI and Sse83871 (Mantovani et al., 2008). Van Os et al. (2006) reported that genomic representations obtained with PstI reflect the methylation status of the genomic DNA and produce markers that preferentially map to hypomethylated gene-rich regions.
Seventy-seven DArT markers, which were not published and had not been assigned to any chromosomal location in the previous linkage studies, were mapped on different chromosomes, including chromosome 1A (3), 1D (3), 2A (2), 2B (2), 2D (4), 3A (2), 3B (4), 3D (19), 4A (2), 4D (6), 5B (1), 5D (4), 6A (2), 6B (2), 6D (11), 7A (1), 7B (3), and 7D (6).
Microsatellite markers were used as anchor primers for chromosomal arms. They allow the construction of a high-confidence framework map. Microsatellite markers are genome- and chromosome-specific and/or locus-specific. Their inclusion in the linkage map allows for more precise and accurate identification of the linked genomic regions. Some SSRs were included in the present genetic map to confirm the position of the DArT markers on the chromosomes. Most SSR markers were mapped in accordance with previously published locations, except for two markers, cfd5 and cfd48. SSR marker cfd5 was mapped on chromosome 6D instead of the location reported in the literature at chromosome 5B, and cfd48 was mapped on 1B instead of 1D (Somers et al., 2004; Song et al., 2005).
All of the SSRs used in this study amplified one locus. This is consistent with earlier results that showed that the majority of SSRs are chromosome-specific and usually amplified only a single locus (Röder et al., 1998; Korzun et al., 1999; Elouafi and Nachit, 2004). SSR markers were not evenly distributed along chromosomes in the Gerek-79 × Arrehane map, even though we attempted to select appropriate SSRs according to their known positions on chromosomes. Some of the chromosomes remained without SSR markers. The level of polymorphism in SSR markers was very low among parents.
4.4. Segregation distortion
Segregation distortion (SD) is defined as the deviation of genetic segregation ratios from their expected Mendelian fraction (Lyttle, 1991). Chi-square tests indicated a significant deviation from that anticipated based upon linkage group length. The RILs can be classified into three categories according to their genotypes: families with the same parental allele frequency (201: 21.22%), families with dominant maternal allele frequency (605: 63.88%), and families with dominant paternal allele frequency (141: 14.89%). Among 947 markers, 746 marker loci (78.78%) deviated significantly from the 1:1 Mendelian segregation ratio in the progeny mapping population.
SD markers were distributed on all three genomes, spanning all 21 chromosomes. SD has been reported in previous linkage maps using DArT markers. Genomic representations obtained using PstI reflect the methylation status of the genomic DNA and produce markers that preferentially map in hypomethylated gene-rich regions (Van Os et al., 2006; Mantavoni et al., 2008). It could be presumed that the genomic representations obtained with
PstI reflect the presence of methylation sites and produce
markers in the hypomethylated gene-rich regions, and that DArT clones mostly appear in the telomeric regions of chromosomes due to high G+C contents of the PstI sites and the high recombination rate of these genetic loci. These regions in the Gerek-79 × Arrehane linkage map might be associated with SD.
The phenomenon of SD and its causes is poorly understood (Jenczewski et al., 1997). A single mechanism or a combination of different mechanisms may be responsible for SD in any particular case. SD has been frequently detected in polyploid species such as hexaploid and tetraploid wheat mapping populations. Deviations from Mendelian segregation ratios are widespread in plants and have been reported in all plants, including several Triticeae species (Heun et al., 1991; Blanco et al., 1998; Nachit et al., 2001). In our study, most of the distorted loci (63.88%) skewed towards the maternal parent (Gerek-79), which implies that SD is much more frequent in the female parent than in the male parent. This is consistent with the hypothesis that megasporocytes are more tolerant of
genetic imbalance than are microsporocytes, suggesting the occurrence of some form of selection at the female gamete level. The deviation of markers from the expected segregation ratios might be related to the passage through male or female gametes rather than being dependent on a specific genotype.
Genetic control of segregation disturbance has been reported in rice (Xu et al., 1997). Castro et al. (2011) reported the presence of segregated distorted loci on linkage group 4 of the chickpea genetic map, pointing towards those genetic factors that are responsible for SD. Eujayl et al. (1997) also concluded that SD occurred not because of the marker technique, but because of SD of the gametes or zygotes leading to the F2 progenies. The apparent preferential transmission of one parental genotype towards some areas of the genome suggests that these areas may carry genes that affect gamete viability.
The phenomenon of SD might be an important limitation in map construction as it may affect both the establishment of linkage groups and the estimation of recombination frequencies. In this study, we first eliminated markers showing SD and constructed linkage groups with only solid markers that followed the 1:1 Mendelian segregation order. In total, 201 markers with normal segregation were used in preliminary linkage map construction. Later, we subsequently added the distorted markers with low-level SD. When distorted markers were integrated into the map framework, their introduction did not affect the previous statistical confidence of marker order. Furthermore, they were distributed among linkage groups with normally segregating loci. Consequently, we included the full set of markers. Our result is consistent with that of Anhalt et al. (2008), who also illustrated that the inclusion of skewed markers had no effect on the linkage arrangement. Chen et al. (2011) also found significant SD in kenaf (Hibiscus cannabinus L.) using ISSR, SRAP, and RAPD markers and reported that inclusion of distorted loci did not have any negative effect on the placement of normal markers or on linkage groups. Conversely, Anhalt et al. (2008) reported that ignoring SD markers in a mapping population for further analysis or eliminating them from further calculation is questionable. These markers distort the distances of genetic markers on a map and can lead to underestimation of the number of required markers for fine mapping studies. In our population, SD was higher than that observed for other plant species, as well as for durum and bread wheat. However, in the ryegrass (Lolium
perenne) VrnA F2 mapping population (Jensen et al.,
2005), 60% of the marker loci demonstrated SD.
SD is most commonly observed in interspecific crosses; however, previous studies showed that the distortion phenomenon also occurs in intraspecific crosses. While SD is a common phenomenon in different types of mapping
populations, for example F2, RILs, or doubled haploids (DHs), RIL populations have the highest potential for such distortions due to the existence of selection forces over many generations (Singh et al., 2007), which can amplify the loss of vigor with enforced inbreeding. According to Anhalt et al. (2008), population structure seems to be an important factor for SD and can lead to variation in the proportion of distorted markers. Xu et al. (1997) published a study based on six genetic linkage maps of rice with different population structures and reported that RILs demonstrated the highest frequency of markers displaying SD. Lu et al. (2002) made a similar observation and described that there was higher SD in RIL populations than in DH, backcross, and F2 populations. An explanation for SD in RIL populations could be inbreeding depression because of an increase in the number of homozygote genotypes over heterozygote genotypes. All of the above-mentioned researchers indicated that SD most likely accumulates along with the additional generation of meiosis during inbreeding. Furthermore, Nachit et al. (2001) reported that the selective survival of RILs due to the single-seed descent method could be a possible cause of SD in the RIL population. These SDs might also be due to chromosomal rearrangements (Tanksley, 1984), alleles that induce gametic or zygotic selection, reproductive differences between the two parents (Foolad et al., 1995), lethal genes (Blanco et al., 1998), or sterility induced by the distant genetic parental background. Moreover, the diverse genetic background could be a possible reason for segregation distortion. For example, Gerek-79 and Arrehane are genetically distant parents, and segregating progeny were also derived from a cross of spring and winter wheat varieties.
A genetic map with full genome coverage and confidence in locus order is necessary for the detection, mapping, and estimation of gene effects on phenotypic traits. This is the first genetic map of bread wheat from Turkey and from the gene pool of the WANA region; therefore, it could serve as a valuable source to identify new markers that are linked with unique alleles from this region. This map provides a valuable resource for wheat genetic research, confirming the genetic location of DArT markers on their relevant chromosomes. Moreover, around 77 DArT markers were also mapped on different chromosomes, which were not previously reported and had not been previously assigned to any chromosomal location, thus expanding the pool of markers available for wheat research. A limitation of QTL studies performed on individual biparental populations is the low number of molecular markers present in the region in which the QTL is identified. The construction of a highly saturated linkage map for Gerek-79 × Arrehane, which segregates for several traits of interest, will enhance gene discovery and ultimately increase the efficiency of
molecular breeding for bread wheat. Therefore, more non-DArT markers should be incorporated to increase the density and resolution of this map for future study. The present study describes a representative genetic map of the bread wheat gene pool from Turkey. This map will be used to detect further QTLs for agronomic, quality, and kernel characteristics of bread wheat, and as a tool for MAS and map-based breeding for traits of interest. Thus, in the future, the Gerek-79 × Arrehane map might provide
useful information for cloning major QTLs that control economically important traits.
Acknowledgments
The authors express their gratitude to TÜBİTAK (the Scientific and Technological Research Council of Turkey, TOVAG-111O663) and the Çukurova University Scientific Research Projects Unit (ZF2004BAP17) for their financial support.
References
Akbari M, Wenzl P, Caig V, Carling J, Xia L, Yang S, Uszynski G, Mohler V, Lehmensiek, A, Kuchel H et al. (2006). Diversity arrays technology (DArT) for high-throughput profiling of the hexaploid wheat genome. Theor Appl Genet 113: 1409-1420. Alsaleh A, Baloch FS, Derya M, Azrak M, Kilian B, Özkan H, Nachit
M (2014). Genetic linkage map of Anatolian durum wheat derived from a cross of Kunduru-1149 × Cham1. Plant Mol Biol Rep 33: 209-220.
Andeden EE, Yediay FE, Baloch FS, Shaaf S, Kilian B, Nachit M, Özkan H (2011). Distribution of vernalization and photoperiod genes (Vrn-A1, Vrn-B1, Vrn-D1, Vrn-B3, Ppd-D1) in Turkish bread wheat cultivars and landraces. Cereal Res Commun 39: 352-364.
Anhalt UC, Heslop-Harrison PJ, Byrne S, Guillard A, Barth S (2008). Segregation distortion in Lolium: evidence for genetic effects. Theor Appl Genet 117: 297-306.
Baloch FS, Kurt C, Arıoğlu H, Özkan H (2010). Assaying of diversity among soybean (Glycin max (L.) Merr.) and peanut (Arachis
hypogaea L.) genotypes at DNA level. Turk J Agric For 34:
285-301.
Bennett MD, Smith JB (1976). Nuclear DNA amounts in angiosperms. Philos T R Soc B 274: 227-274.
Blanco A, Bellomo MP, Cenci A, De Giovanni C, D’ovidio R, Iacono E, Laddomada B, Pagnotta MA, Porceddu E, Sciancalepore A et al. (1998). A genetic linkage map of durum wheat. Theor Appl Genet 97: 721-728.
Cadalen T, Boeuf C, Bernard S, Bernard M (1997). An intervarietal molecular marker map in Triticum aestivum L. Em. Thell. and comparison with a map from a wide cross. Theor Appl Genet 94: 367-377.
Castro P, Rubio J, Cabrera A, Millan T, Gil J (2011). A segregation distortion locus located on linkage group 4 of the chickpea genetic map. Euphytica 179: 515-523.
Chen MX, Wei CL, Qi JM, Chen XB, Su JG, Li AG, Tao AF, Wu WR (2011). Genetic linkage map construction for kenaf using SRAP, ISSR and RAPD markers. Plant Breeding 130: 679-687. Cömertpay G, Baloch FS, Kilian B, Ülger AC, Özkan H (2012).
Diversity assessment of Turkish maize landraces based on fluorescent labelled SSR markers. Plant Mol Biol Rep 30: 261-276.
Crossa J, Burgueno J, Dreisigacker S, Vargas M, Herrera-Foessel SA, Lillemo M, Sing RP, Trethowan R, Warburton M, Franco J et al. (2007). Association analysis of historical bread wheat germplasm using additive genetic covariance of relatives and population structure. Genetics 177: 1889-1913.
Doyle JJ, Doyle JL (1990). Isolation of plant DNA from fresh leaf tissue. Focus 12: 13-15.
Elouafi I, Nachit MM (2004). A genetic linkage map of the durum × Triticum dicoccoides backcross population based on SSRs and AFLP markers and QTL analysis for milling traits. Theor Appl Genet 1083: 401-413.
Eujayl I, Baum M, Erskine W, Pehu E, Muehlbauer FJ (1997). Use of RAPD markers for genetic mapping and evaluation of segregation distortion in lentil (Lens culinaris Medik.). Euphytica 96: 405-412.
Foolad MR, Arulsekar S, Becerra V, Bliss FA (1995). A genetic map of Prunus based on an interspecific cross between peach and almond. Theor Appl Genet 91: 262-269.
Heun M, Kennedy AE, Anderson JA, Lapitan NLV, Sorrells ME, Tanksley SD (1991). Construction of a restriction fragment length polymorphism map for barley Hordeum vulgare. Genome 34: 437-447.
Huang XQ, Cloutier S, Lycar L (2006). Molecular detection of QTLs for agronomic and quality traits in a doubled haploid population derived from two Canadian wheats Triticum
aestivum L. Theor Appl Genet 113: 753-766.
Iqbal MJ, Mamidi S, Ahsan R, Kianian SF, Coyne CJ, Hamama AA, Narina SS, Bhardwaj HL (2012). Population structure and linkage disequilibrium in Lupinus albus L. germplasm and its implication for association mapping. Theor Appl Genet 125: 517-530.
Jenczewski E, Gherardi M, Bonnin I, Prosperi JM, Olivieri I, Huguet T (1997). Insight on segregation distortions in two intraspecific crosses between annual species of Medicago (Leguminosae). Theor Appl Genet 94: 682-669.
Jensen LB, Aarens P, Andersen CH, Holm PB, Ghesquiere M, Julier B, Lübberstedt T, Muylle H, Nielsen KK, De Riek J et al. (2005). Development and mapping of a public reference set of SSR markers in Lolium perenne L. Mol Ecol Notes 5: 551-557.
Korzun V, Röder MS, Wendehake K, Pasqualone A, Lotti C, Ganal MW, Blanco A (1999). Integration of dinucleotide microsatellites from hexaploid bread wheat into a genetic linkage map of durum wheat. Theor Appl Genet 98: 1202-1207.
Kosambi DD (1944). The estimation of map distances from recombination values. Ann Eugenic 12: 172-175.
Li S, Jizeng J, Wei X, Zhang X, Li L, Chen H, Fan Y, Sun H, Zhao X, Lei T et al. (2007). A intervarietal genetic map and QTL analysis for yield traits in wheat. Mol Breeding 20: 167-178.
Liu BH (1998). Statistical Genomics: Linkage, Mapping, and QTL Analysis. 1st ed. Boca Raton, FL, USA: CRC Press.
Lu H, Romero-Severson J, Bernardo R (2002). Chromosomal regions associated with segregation distortion in maize. Theor Appl Genet 105: 622-628.
Lyttle TW (1991). Segregation distortion. Annu Rev Genet 25: 511-557.
Maccaferri M, Sanguineti MC, Corneti S, Araus O, Ben JA, Salem M, Deambrogio JBE, Garcia Del Moral LF, Demontis A, El-Ahmed A et al. (2008). Quantitative trait loci for grain yield and adaptation of durum wheat (Triticum durum Desf.) across a wide range of water availability. Genetics 178: 489-511.
Mantovani P, Maccaferri M, Corinna SM, Tuberosa R, Catizone I, Wenzl P, Thomson B, Carling J, Huttner E, Deambrogio E et al. (2008). An integrated DArT-SSR linkage map of durum wheat. Mol Breeding 22: 629-648.
Nachit MM, Elouafi I, Pagnotta MA, El Saleh A, Lacono E, Labhilili M, Asbati A, Azrak M, Hazzam H, Benscher D et al. (2001). Molecular linkage map for an intraspecific recombinant inbred population of durum wheat (Triticum turgidum L. var. durum). Theor Appl Genet 102: 177-186.
Nalini E, Baghwat SG, Jawali N (2007). An intervarietal genetic linkage map of Indian bread wheat (Triticum aestivum L.) and QTL maps for some metric traits. Genet Res 89: 165-179.
Paillard S, Schnurbusch T, Winzeler M, Messmer M, Sourdille P, Abderhalden O, Keller B, Schachermayr G (2003). An integrative genetic linkage map of winter wheat (Triticum aestivum L.). Theor Appl Genet 107: 1235-1242.
Patnaik D, Khurana P (2001). Wheat biotechnology: a mini review. Electron J Biotechn 4: 74-102.
Peleg Z, Saranga Y, Suprunova T, Ronin Y, Röder MS, Kilian A, Korol AB, Fahima T (2008). High-density genetic map of durum wheat x wild emmer wheat based on SSR and DArT markers. Theor Appl Genet 117: 103-115.
Petroli CD, Sansaloni CP, Carling J, Steane DA, Vaillancourt RE, Myburg AA, Grattapaglia D (2012). Genomic characterization of DArT markers based on high-density linkage analysis and physical mapping to the Eucalyptus genome. PLoS One 7: e44684.
Quarrie SA, Steed A, Calestani C, Semikhodskii A, Lebreton C, Chinoy C, Steele N, Pljevljakusic D, Waterman E, Weyen J et al. (2005). A high-density genetic map of hexaploid wheat (Triticum aestivum L.) from the cross Chinese Spring × SQ1 and its use to compare QTLs for grain yield across a range of environments. Theor Appl Genet 110: 865-880.
Röder MS, Korzun V, Wendehake K, Plaschke J, Tixer MH, Leroy P, Ganal MW (1998). A microsatellite map of wheat. Genetics 149: 2007-2023.
Semagn K, Bjornstad A, Skinnes H, Maroy AG, Tarkegne Y, William M (2006). Distribution of DArT, AFLP, and SSR markers in a genetic linkage map of a doubled-haploid hexaploid wheat population. Genomes 49: 545-555.
Singh K, Ghai M, Garg M, Chhuneja P, Kaur P, Schnurbusch T, Keller B, Dhaliwal HS (2007). An integrated molecular linkage map of diploid wheat based on a Triticum boeoticum × T. monococcum RIL population. Theor Appl Genet 115: 301-312.
Somers DJ, Isaac P, Edwards K (2004). A high-density wheat microsatellite consensus map for bread wheat Triticum aestivum L. Theor Appl Genet 109: 1105-1114.
Song QJ, Shi JR, Singh S, Fickus EW, Costa JM, Lewis J, Gill BS, Ward R, Cregan PB (2005). Development and mapping of microsatellite (SSR) markers in wheat. Theor Appl Genet 110: 550-560. Suenaga K, Khairallah M, William HM, Hoisington DA (2005). A new
intervarietal linkage map and its application for quantitative trait locus analysis of “gigas” features in bread wheat. Genome 48: 65-75.
Tanksley SD (1984). Linkage relationships and chromosomal locations of enzyme-coding genes in pepper, Capsicum annum. Chromosoma 89: 352-360.
Trebbi D, Maccaferri M, Heer P, Sorensen A, Giuliani S, Salvi S, Sanguineti MC, Massi A, Vossen E, Tuberosa R (2011). High-throughput SNP discovery and genotyping in durum wheat (Triticum durum Desf.). Theor Appl Genet 123: 555-569. Vaissayre L, Ardisson M, Borries C, Santoni S, David J, Roumet P
(2012). Elite durum wheat genetic map and recombination rate variation in a multiparental connected design. Euphytica 185: 61-75.
Van Ooijen J, Boer W, Jansen R, Maliepaard C (2002). MapQTL 4.0, Software for the Calculation of QTL Positions on Genetic Maps. Wageningen, the Netherlands: Plant Research International.
Van Os H, Andrzejewski S, Bakker E, Barrena I, Bryan GJ, Caromel B, Ghareeb B, Isidore E, De Jong W, Van Koert P et al. (2006). Construction of a 10,000-marker ultra-dense genetic recombination map of potato: providing a framework for accelerated gene isolation and a genome wide physical map. Genetics 173: 1075-1087.
Wenzl P, Carling J, Kudrna D, Jaccoud D, Huttner E, Kleinhofs A, Kilian A (2004). Diversity Arrays Technology (DArT) for whole-genome profiling of barley. P Natl Acad Sci USA: 101: 9915-9920. Xu Y, Zhu L, Xiao J, Huang N, McCouch SR (1997). Chromosomal
regions associated with segregation distortion of molecular markers in F2, backcross, double haploid and recombinant inbred population in rice (Oryza sativa L.). Mol Gen Genet 253: 535-545.
Yang S, Pang W, Ash G, Harper J, Carling J, Wenzl P, Huttner E, Zong X, Kilian A (2006). Low level of genetic diversity in cultivated pigeonpea compared to its wild relatives is revealed by diversity arrays technology. Theor Appl Genet 113: 585-595.
Yediay FE, Andeden EE, Baloch FS, Börner A, Kilian B, Özkan H (2011). The allelic state at the major semi-dwarfing genes in a panel of Turkish bread wheat cultivars and landraces. Plant Genetic Resources 9: 423-429.
Yediay FE, Baloch FS, Kilian B, Ozkan H (2010). Testing of rye-specific markers located on 1RS chromosome and distribution of 1AL. RS and 1BL. RS translocations in Turkish wheat (Triticum aestivum L., T. durum Desf.) varieties and landraces. Genet Resour Crop Ev 57: 119-129.
Zhang W, Chao S, Manthey F, Chicaiza O, Brevis JC, Echenique V, Dubcovsky J (2008). QTL analysis of pasta quality using a composite microsatellite and SNP map of durum wheat. Theor Appl Genet 117: 1361-1377.