© 2015 Ankara University WIRELESS DEVICE IDENTIFICATION USING DESCRIPTIVE STATISTICS
MEMDUH KÖSE, SELÇUK TAġCIOĞLU, ZĠYA TELATAR Ahi Evran Univ, Computer Sciences Research and Application Center Kirsehir, Turkey
Ankara Univ, Faculty of Engineering, Electrical and Electronics Engineering Department Ankara, Turkey
E-mail : [email protected], {selcuk.tascioglu, ziya.telatar}@eng.ankara.edu.tr (Received: March 13, 2015; Accepted: April 19, 2015 )
ABSTRACT
Physical layer identification systems classify the wireless devices by exploiting some distinctive device characteristics which can be measured from transmissions. In this paper, characteristic features based on descriptive statistics are extracted from the transient part of the received WiFi signals for classification purpose. Classification performance of the features is evaluated through experimental data. Feature sets consisting of combinations of descriptive statistics are tested in order to evaluate the distinctiveness of statistics which measures the central tendency and dispersion of data. Classification results for independent trials are presented in terms of mean and standard deviation of classification accuracy as well as confusion matrix.
KEYWORDS: Wireless device identification, transient signal, descriptive statistics, classification performance evaluation
1. INTRODUCTION
Wireless device identification process based on some unique characteristics caused by hardware imperfections in transmitter circuitry is called physical layer identification. Various feature extraction and classification methods based on physical layer characteristics of devices have been proposed in order to identify wireless devices [1]-[6]. This identification approach has been shown to be useful to enhance the wireless network security, e.g. in [1] security enhancement was achieved by identifying IEEE 802.11b WiFi devices through experimental data. Danev et al. presented a survey of physical layer identification systems in a systematic way [7].
Commun.Fac.Sci.Univ.Ank.Series A2-A3 Volume 57, Number 1, Pages 1-10 (2015) DOI: 10.1501/commua1-2_0000000083 ISSN 1303-6009
2 MEMDUH KÖSE, SELÇUK TAġCIOĞLU, ZĠYA TELATAR
Distinctive features of devices can be measured from various parts of transmitted signals such as transients, preambles and data. Accuracy for the detection of the signal part to be used has a substantial effect on the identification system performance, especially for transient based approaches since the detection of transients is a difficult task due to their noise-like characteristics [1]. Several transient detection algorithms such as multifractal segmentation method [8], Bayesian step detector [9] and Bayesian ramp detector [10] have been proposed so far.
After detecting signal part, appropriate features are defined so as to represent the unique characteristics of the device. For this purpose, descriptive statistics obtained from signal characteristics such as amplitude frequency and phase responses have been employed. For example, statistics such as standard deviation, variance, skewness, and kurtosis have been used as features for classification of wireless devices [2]-[6]. Time domain and wavelet domain statistical features were extracted from preamble part of 802.11a signals in [2]. Statistical features were generated from amplitude, phase and frequency characteristics of transmitted signals. Classification of devices was performed through a multiple discriminant analysis/maximum likelihood in a Bayesian framework. In addition to the time domain and the wavelet domain schemes a feature extraction method in spectral domain was proposed in [3]. Spectral domain features were obtained from the power spectral density of emitted WiMax signals. In [4], classification performance of features extracted from instantaneous phase responses of midmable and near-transient signal regions of GSM signals were compared using the experimental data. It was shown that a better classification performance was achieved with the features extracted from near-transient signal regions. Harmer et al. showed that statistical features obtained from time domain preambles and corresponding spectral domain responses based on normalized power spectral density can be employed for classification of WiFi and WiMax signals [5]. Rehman et al. proposed to use statistical features from the energy envelope of transient signals for classification of Bluetooth devices [6]. Feature vector is defined to consist of duration of the transient, maximum slope of the transient curve, area under the curve in addition to statistical features based on the first four moments. It was shown that the proposed features can be employed with a high accuracy rate at low sampling rates. Zhao et al. proposed an identification method base on features obtained from the envelope of the transient signal using the compressed sensing theory [11]. Transient envelop is calculated by using complex analytical wavelet transform. It was showed that the
WIRELESS DEVICE IDENTIFICATION 3 identification performance of this method is better than that of the method proposed in [6] for the case of high attenuation.
In this paper, a transient based classification system is considered. Transient detection is carried out using Bayesian ramp detector proposed in [10]. Statistical features obtained from instantaneous amplitude responses of transients are used as features. Classification performance of descriptive statistics which measures the central tendency and the dispersion of data have been evaluated separately and together.
The organization of the paper is as follows: In section 2, transient characteristics of WiFi signals is presented. In section 3, features based on descriptive statistics are defined. Performance evaluation of the classification method is given in Section 4. Section 5 concludes the paper.
2. TRANSIENT CHARACTERISTICS OF WIFI SIGNALS
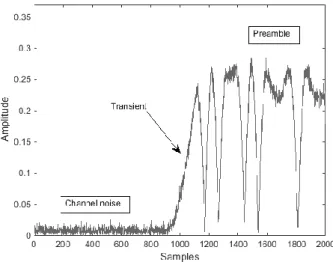
A radio transmitter generates transient signal until a stable carrier is produced. Transient signals have unique characteristics which can be exploited for identification of these devices. An accurate transient detector increases the performance of transient based identification systems [1], [7]. Transient signal behavior can be measured in terms of instantaneous signal characteristics, such as instantaneous amplitude and phase [1]. In this paper, we used instantaneous amplitude characteristics to extract unique characteristics of transients. Instantaneous amplitudes of the real valued experimental signals were obtained from the corresponding analytical signals calculated by using Hilbert transform [12]. Figure 1 shows an example for the instantaneous amplitude of a transmission from a WiFi device. As shown in this figure, recorded transmission contain transient signal following the channel noise and the steady state preamble part of the received signal. Therefore, the first task of the classification system is to detect the transient part of instantaneous amplitude signal. Transient starting point is estimated using a Bayesian ramp detector which is proposed in [10]. In this method, transient signal detection problem was formulated as a change-point detection problem and a ramp signal model was employed to separate the transients from the channel noise in a Bayesian framework. Transient duration for WiFi devices was found to be around 200 ns in [1], which corresponds 200 samples for the test signals in this work. After detecting transient signals, the unique characteristics based on descriptive statistics were extracted from instantaneous amplitudes of transients.
4 MEMDUH KÖSE, SELÇUK TAġCIOĞLU, ZĠYA TELATAR
Figure 1. Instantaneous amplitude for a received signal from a WiFi device
3. FEATURES BASED ON DESCRIPTIVE STATISTICS
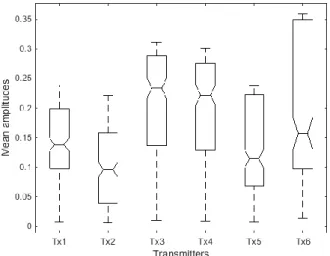
Instantaneous characteristics such as instantaneous amplitude and phase of received signals from wireless devices have some distinctive properties caused by transmitters. These properties have been used to identify wireless devices. For example in [1], instantaneous amplitudes and dimension reduced form of these characteristics, obtained by using principle component analysis, were used as features. In this paper, we summarize the instantaneous amplitudes through the descriptive statistics in order to reduce the feature dimension while keeping the ability to distinguish transmitters. Characteristics of a number of the descriptive statistics can be visualized by means of boxplot of data. For this purpose, average over fifty received signals was calculated for each transmitter and statistical summary of these average signals is provided by a boxplot in Figure 2. The notches of the boxes indicate the second quartile (Q2) values which is also called the median. The edges of the boxes correspond to the first quartile (Q1), also called the 25th percentile, and the third quartile (Q3), also called the 75th percentile, values. The lengths of a boxes give interquartile range (IQR=Q3-Q1) values. The edges of dashed lines represent the most extreme data points. As seen from this figure, there are statistically significant differences between some of the statistics of different transmitters while some of them are close to overlap. For example, Q3 values of Tx6 is far away from
WIRELESS DEVICE IDENTIFICATION 5 those of other transmitters while Q2 values of Tx6 and Tx1 are closer to each other. Thus, classification of these devices cannot be accomplished by using a simple threshold. In this paper, a PNN (probabilistic neural network) classifier is used to carry out the classification.
Figure 2. Boxplot of averaged data from each transmitter
Descriptive statistics can be categorized in two groups according to data characteristics to be measured [13]. Statistics such as mean and median measure the central tendency, average and location of data, while statistics such as standard deviation, skewness and kurtosis measure the dispersion or variability of data. A list of statistics used as features in this study is presented in Table 1.
4. CLASSIFICATION PERFORMANCE EVALUATION
Classification performance of the features based on descriptive statistics was evaluated experimentally. Experimental data from six different IEEE 802.11b WiFi devices operating in the 2.4 GHz ISM band were used to evaluate the classification performance. Data set contains fifty transmissions from each wireless device. In the PNN classifier, ten of fifty measurements were used as training vectors and remaining forty measurements were employed as test vectors for a trial. The test results presented herein were given over 100 independent trails. In each trial, the train and the test vectors were selected randomly. Four different feature set combination is generated from the descriptive statistics. Feature Set1 is defined as including all the considered statistics. Set2 is defined as including only
6 MEMDUH KÖSE, SELÇUK TAġCIOĞLU, ZĠYA TELATAR
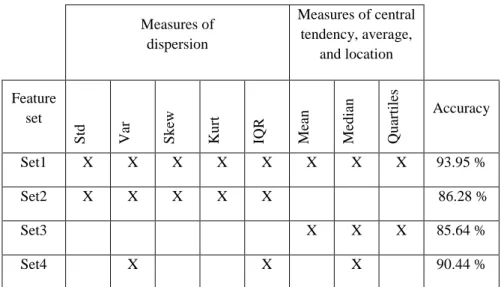
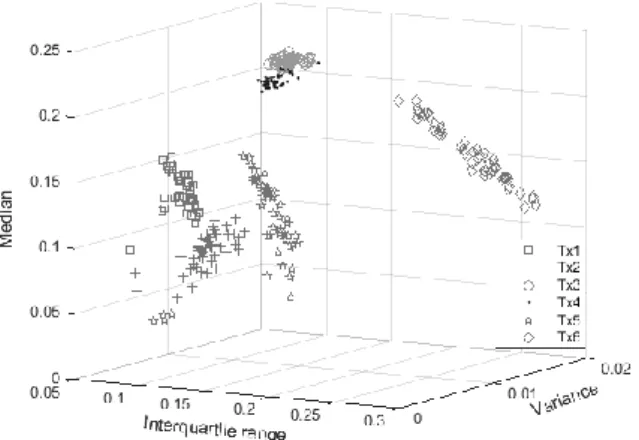
dispersion measurements, whereas Set3 is consist of central tendency, average and location measurements. Set4 is a combination of statistics from both two groups, which is used in order to visualize the features in the three dimensional feature space (Figure 3). Classification performance of these feature sets is presented in Table 1. As seen from this table, best classification performance with a correct classification rate of about 94 % is achieved for Set1.
Table 1 Classification accuracy values for four different feature sets
Measures of dispersion Measures of central tendency, average, and location Feature set Std Var Sk ew Ku rt IQR Mean Me d ian Qu ar tiles Accuracy Set1 X X X X X X X X 93.95 % Set2 X X X X X 86.28 % Set3 X X X 85.64 % Set4 X X X 90.44 %
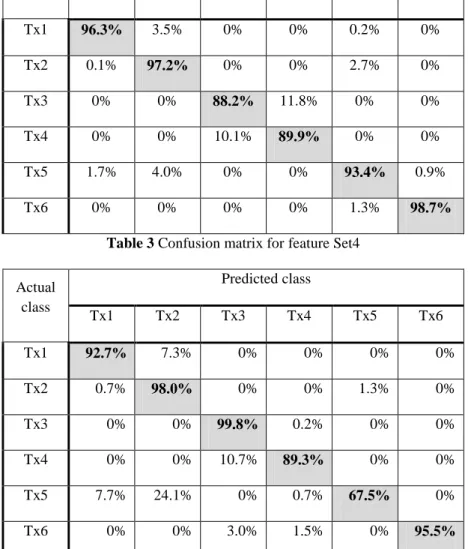
Using only one of the measurement groups (Set2 or Set3) reduces the correct classification rate. Classification accuracies are 86.28% and 85.64% for feature Set2 and Set3, respectively. It is evident from the accuracy rates of Set1 and Set4 that classification accuracy increases as the measurements from both groups are employed together. Classification performances of feature Set1 and Set4 were also visualized through confusion matrices in Table 2 and Table 3. From these tables correct classification rates for all transmitters as well as misclassification rates can be seen. For example, for feature Set1, correct classification rate for the test signals from Tx1 is 96.3% when it is incorrectly labeled as Tx2 and Tx5 with a rate of 3.5% and 0.2%, respectively. It can be deduced by comparing these tables that total classification performance of feature Set1 is better than that of feature Set4, even though Set4 is more distinctive for a specific transmitter, e.g. Tx3. The separability of feature Set4 can also be visually inspected from
WIRELESS DEVICE IDENTIFICATION 7 three dimensional feature space in Figure 3. This figure shows that test signals from Tx6 can be easily separated from other transmitters while test signals from Tx5 can be incorrectly labeled as Tx2 since features from these two transmitters overlap in the some regions of feature space. This result is consisted with the results in Table 3.
Table 2 Confusion matrix for feature Set1
Actual class Predicted class Tx1 Tx2 Tx3 Tx4 Tx5 Tx6 Tx1 96.3% 3.5% 0% 0% 0.2% 0% Tx2 0.1% 97.2% 0% 0% 2.7% 0% Tx3 0% 0% 88.2% 11.8% 0% 0% Tx4 0% 0% 10.1% 89.9% 0% 0% Tx5 1.7% 4.0% 0% 0% 93.4% 0.9% Tx6 0% 0% 0% 0% 1.3% 98.7%
Table 3 Confusion matrix for feature Set4
Actual class Predicted class Tx1 Tx2 Tx3 Tx4 Tx5 Tx6 Tx1 92.7% 7.3% 0% 0% 0% 0% Tx2 0.7% 98.0% 0% 0% 1.3% 0% Tx3 0% 0% 99.8% 0.2% 0% 0% Tx4 0% 0% 10.7% 89.3% 0% 0% Tx5 7.7% 24.1% 0% 0.7% 67.5% 0% Tx6 0% 0% 3.0% 1.5% 0% 95.5%
8 MEMDUH KÖSE, SELÇUK TAġCIOĞLU, ZĠYA TELATAR
Figure 4 shows mean and standard deviation of classification accuracy for 100 independent Monte Carlo trials. In each trial ten training vectors were randomly selected from fifty transmissions and remaining forty transmissions were employed as test vectors. Mean values of classification accuracy are represented as circles inside the boxes as the length of the boxes represent standard deviation of classification accuracy. As seen from this figure, best classification performance is achieved with Set1. Mean of classification accuracy for Set1 is higher than those of
WIRELESS DEVICE IDENTIFICATION 9 Figure 4 Classification accuracy for four different feature sets.
other sets, as well as minimum standard deviation is obtained with Set1. From the same figure it is evident that a slightly better classification performance is achieved with the statistics of dispersion compared to the statistics of central tendency in terms of both mean and standard deviation of classification accuracy. This figure also shows that Set4 has a better classification performance in terms of mean accuracy values compared to Set2 and Set3, however standard deviations of classification accuracy for these three sets are close to each other.
5. CONCLUSIONS
Features based on descriptive statistics are extracted from the transient part of transmissions from WiFi devices in order to classify these devices. Experimental results show that descriptive statistics can be used as features for classification. Experimental test results demonstrated that combined use of descriptive statistics, which measure the central tendency and dispersion of data, increases the classification performance.
ÖZET: Fiziksel tabaka tanımlama sistemleri, iletim sinyallerinden ölçülebilen ayırt edici cihaz
karakteristiklerini kullanarak kablosuz cihazları sınıflandırırlar. Bu makalede betimleyici istatistiklere dayalı öznitelikler sınıflandırma amacıyla WiFi sinyallerinin geçici rejim kısımlarından elde edilmektedir. Sınıflandırma baĢarımı deneysel verilerle değerlendirilmektedir. Betimleyici istatistiklerin farklı kombinasyonlarından oluĢan öznitelik kümeleri kullanılarak merkezi eğilimi ve dağılımı ölçen istatistiklerin ayırt ediciliği değerlendirilmektedir. Bağımsız deneyler için sınıflandırma sonuçları, hata matrisinin yanı sıra sınıflandırma baĢarımının ortalama ve standart sapması üzerinden verilmektedir.
REFERENCES
[1] O. Ureten and N. Serinken, Wireless security through RF fingerprinting, Canadian Journal of Electrical and Computer Engineering, vol. 32, (2007), p.27-33.
[2] R.W. Klein, M.A. Temple, M.J. Mendenhall, Application of wavelet-based RF fingerprinting to enhance wireless network security, Journal of Communications and Networks, vol. 11, (2009), p.544-555.
[3] M.D. Williams, S.A. Munns, M.A. Temple, M.J. Mendenhall, RF-DNA fingerprinting for airport WiMax communications security, 4th International Conference on Network and System Security (NSS), (2010), p.32-39.
10 MEMDUH KÖSE, SELÇUK TAġCIOĞLU, ZĠYA TELATAR
[4] D.R. Reising, M.A. Temple, M.J. Mendenhall, Improving intra-cellular security using air monitoring with RF fingerprints, Wireless Communications and Networking Conference ,(2010), p.1-6.
[5] P. Harmer, M.A. Temple, M. Buckner, E. Farquhar, 4G security using physical layer RF-DNA with de-optimized LFS classification, Journal of Communications, vol. 6, (2011), p.671-681.
[6] S.U. Rehman, K. Sowerby, C. Coghill, RF fingerprint extraction from the energy envelope of an instantaneous transient signal, Australian Communications Theory Workshop (AusCTW), (2012), p.90-95.
[7] B. Danev, D. Zanetti, S. Capkun, On physical-layer identification of wireless devices, ACM Computing Surveys, vol. 45, (2012), p.1–29.
[8] D. Shaw and W. Kinsner, Multifractal modeling of radio transmitter transients for clasification, Proceedings of the IEEE Conference on Communications, Power and Computing, (1997), p.306-312.
[9] O. Ureten and N. Serinken, Detection of radio transmitter turn-on transients, Electronics Letters, vol. 35, (1999), p.1996-1997.
[10] O. Ureten and N. Serinken, Bayesian detection of Wi-Fi transmitter RF fingerprints, Electronics Letters, vol. 41, (2005), p.373-374.
[11] C. Zhao, X. Wu, L. Huang, Y. Yao, Y.C. Chang , Compressed sensing based fingerprint identification for wireless transmitters, The Scientific World Journal, vol. 2014, (2014), p.1-9.
[12] R.G. Lyons, Understanding Digital Signal Processing, (Prentice Hall, New Jersey, 2004), p.688.
[13] S. Bernstein, R. Bernstein, Schaum's Outline of Theory and Problems of Elements of Statistics I: Descriptive Statistics and Probability, (The McGraw-Hill Companies, Inc. 1999), p.354.